HR Dashboard Software
What is an HR dashboard?
HR teams juggle data from a dozen different places: your ATS, payroll system, engagement surveys, time tracking tools, and more. An HR dashboard pulls all of that into one view, so you're not toggling between five tabs to answer a simple question like "why is attrition up this quarter?"
A good HR dashboard shows you the metrics that actually matter: attrition trends, revenue per employee, hiring costs, employee satisfaction, and more, all in one place, updated automatically as new data comes in.
Types of HR dashboards
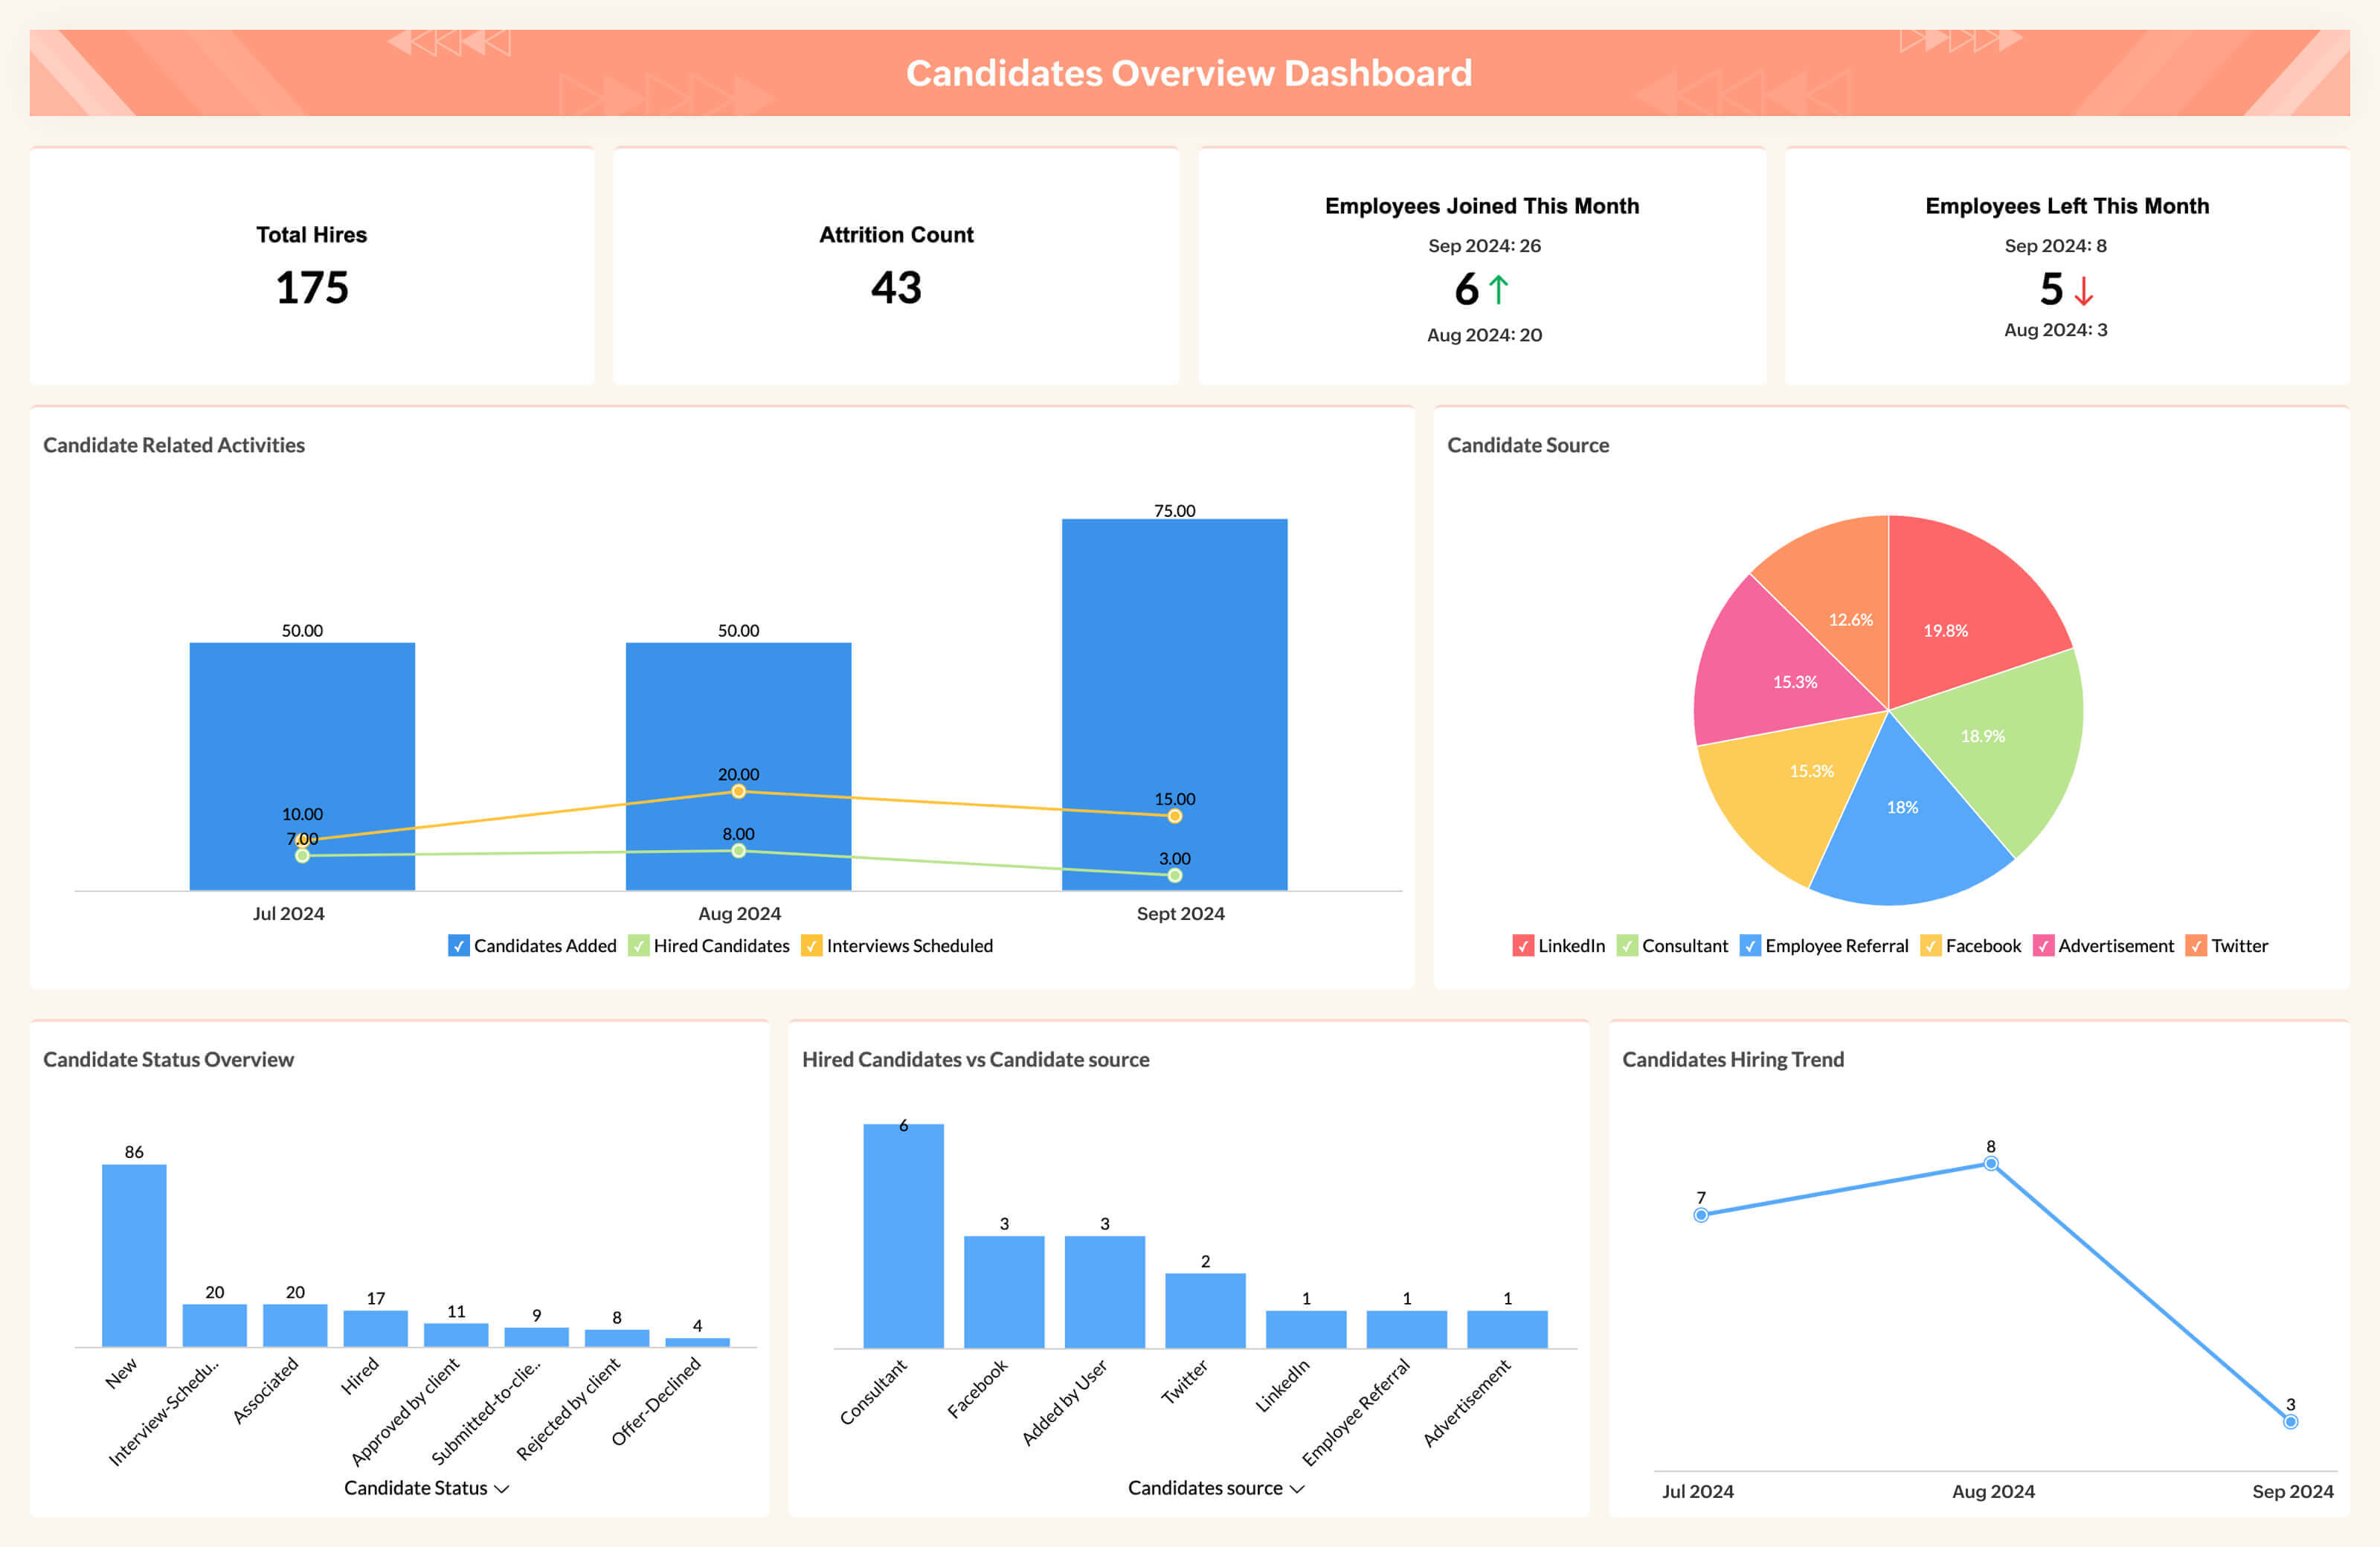
Candidate Overview Dashboard
See where every applicant stands, from first application to final offer. Spot which sourcing channels bring in candidates who actually stay long-term, and cut hiring costs by focusing on what's working.
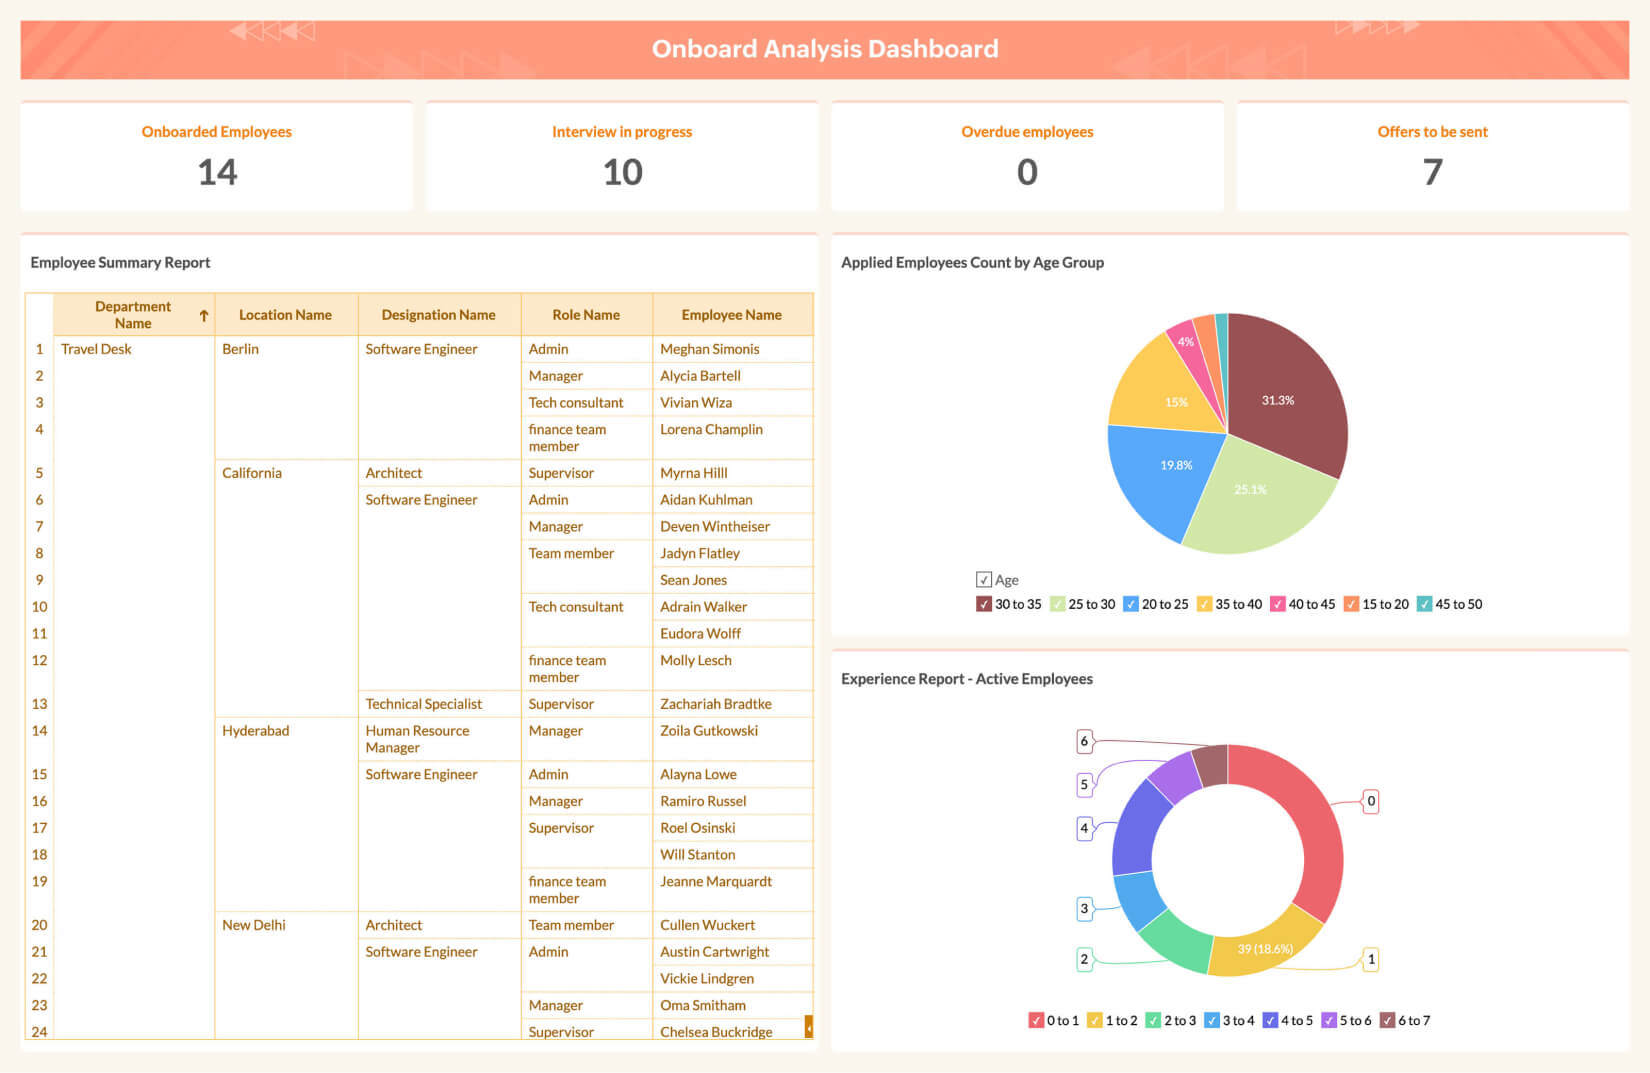
Onboarding Analysis Dashboard
New hires who feel lost in their first 90 days tend to leave. This dashboard tracks onboarding milestones and completion rates by team, so you can catch and fix friction points before they turn into early attrition.
Tasks Dashboard
Attendance gaps and missed deadlines are easy to miss until they pile up. Track time and productivity by employee or team, and set alerts so managers know the moment someone's falling behind.

Employee Dashboard
Not everyone is motivated by the same thing. This dashboard breaks down engagement and interests by employee, so you can personalize incentives instead of running one generic program for everyone.

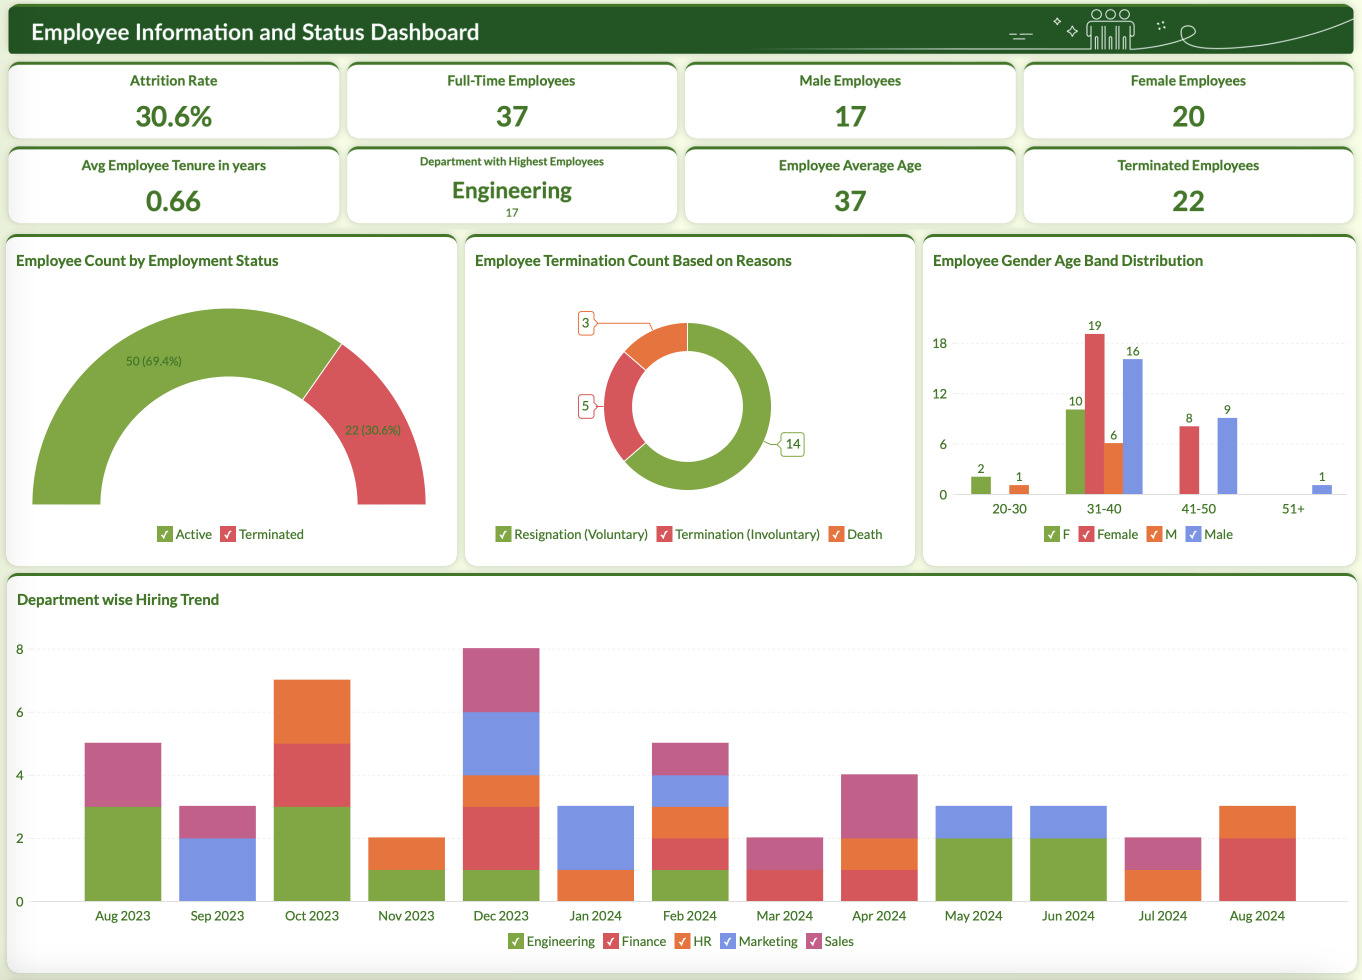
Attrition Analysis Dashboard
When attrition spikes, "why" matters more than "how much." Break down attrition by designation, age, tenure, and department to find the actual pattern, then act on it before it spreads.
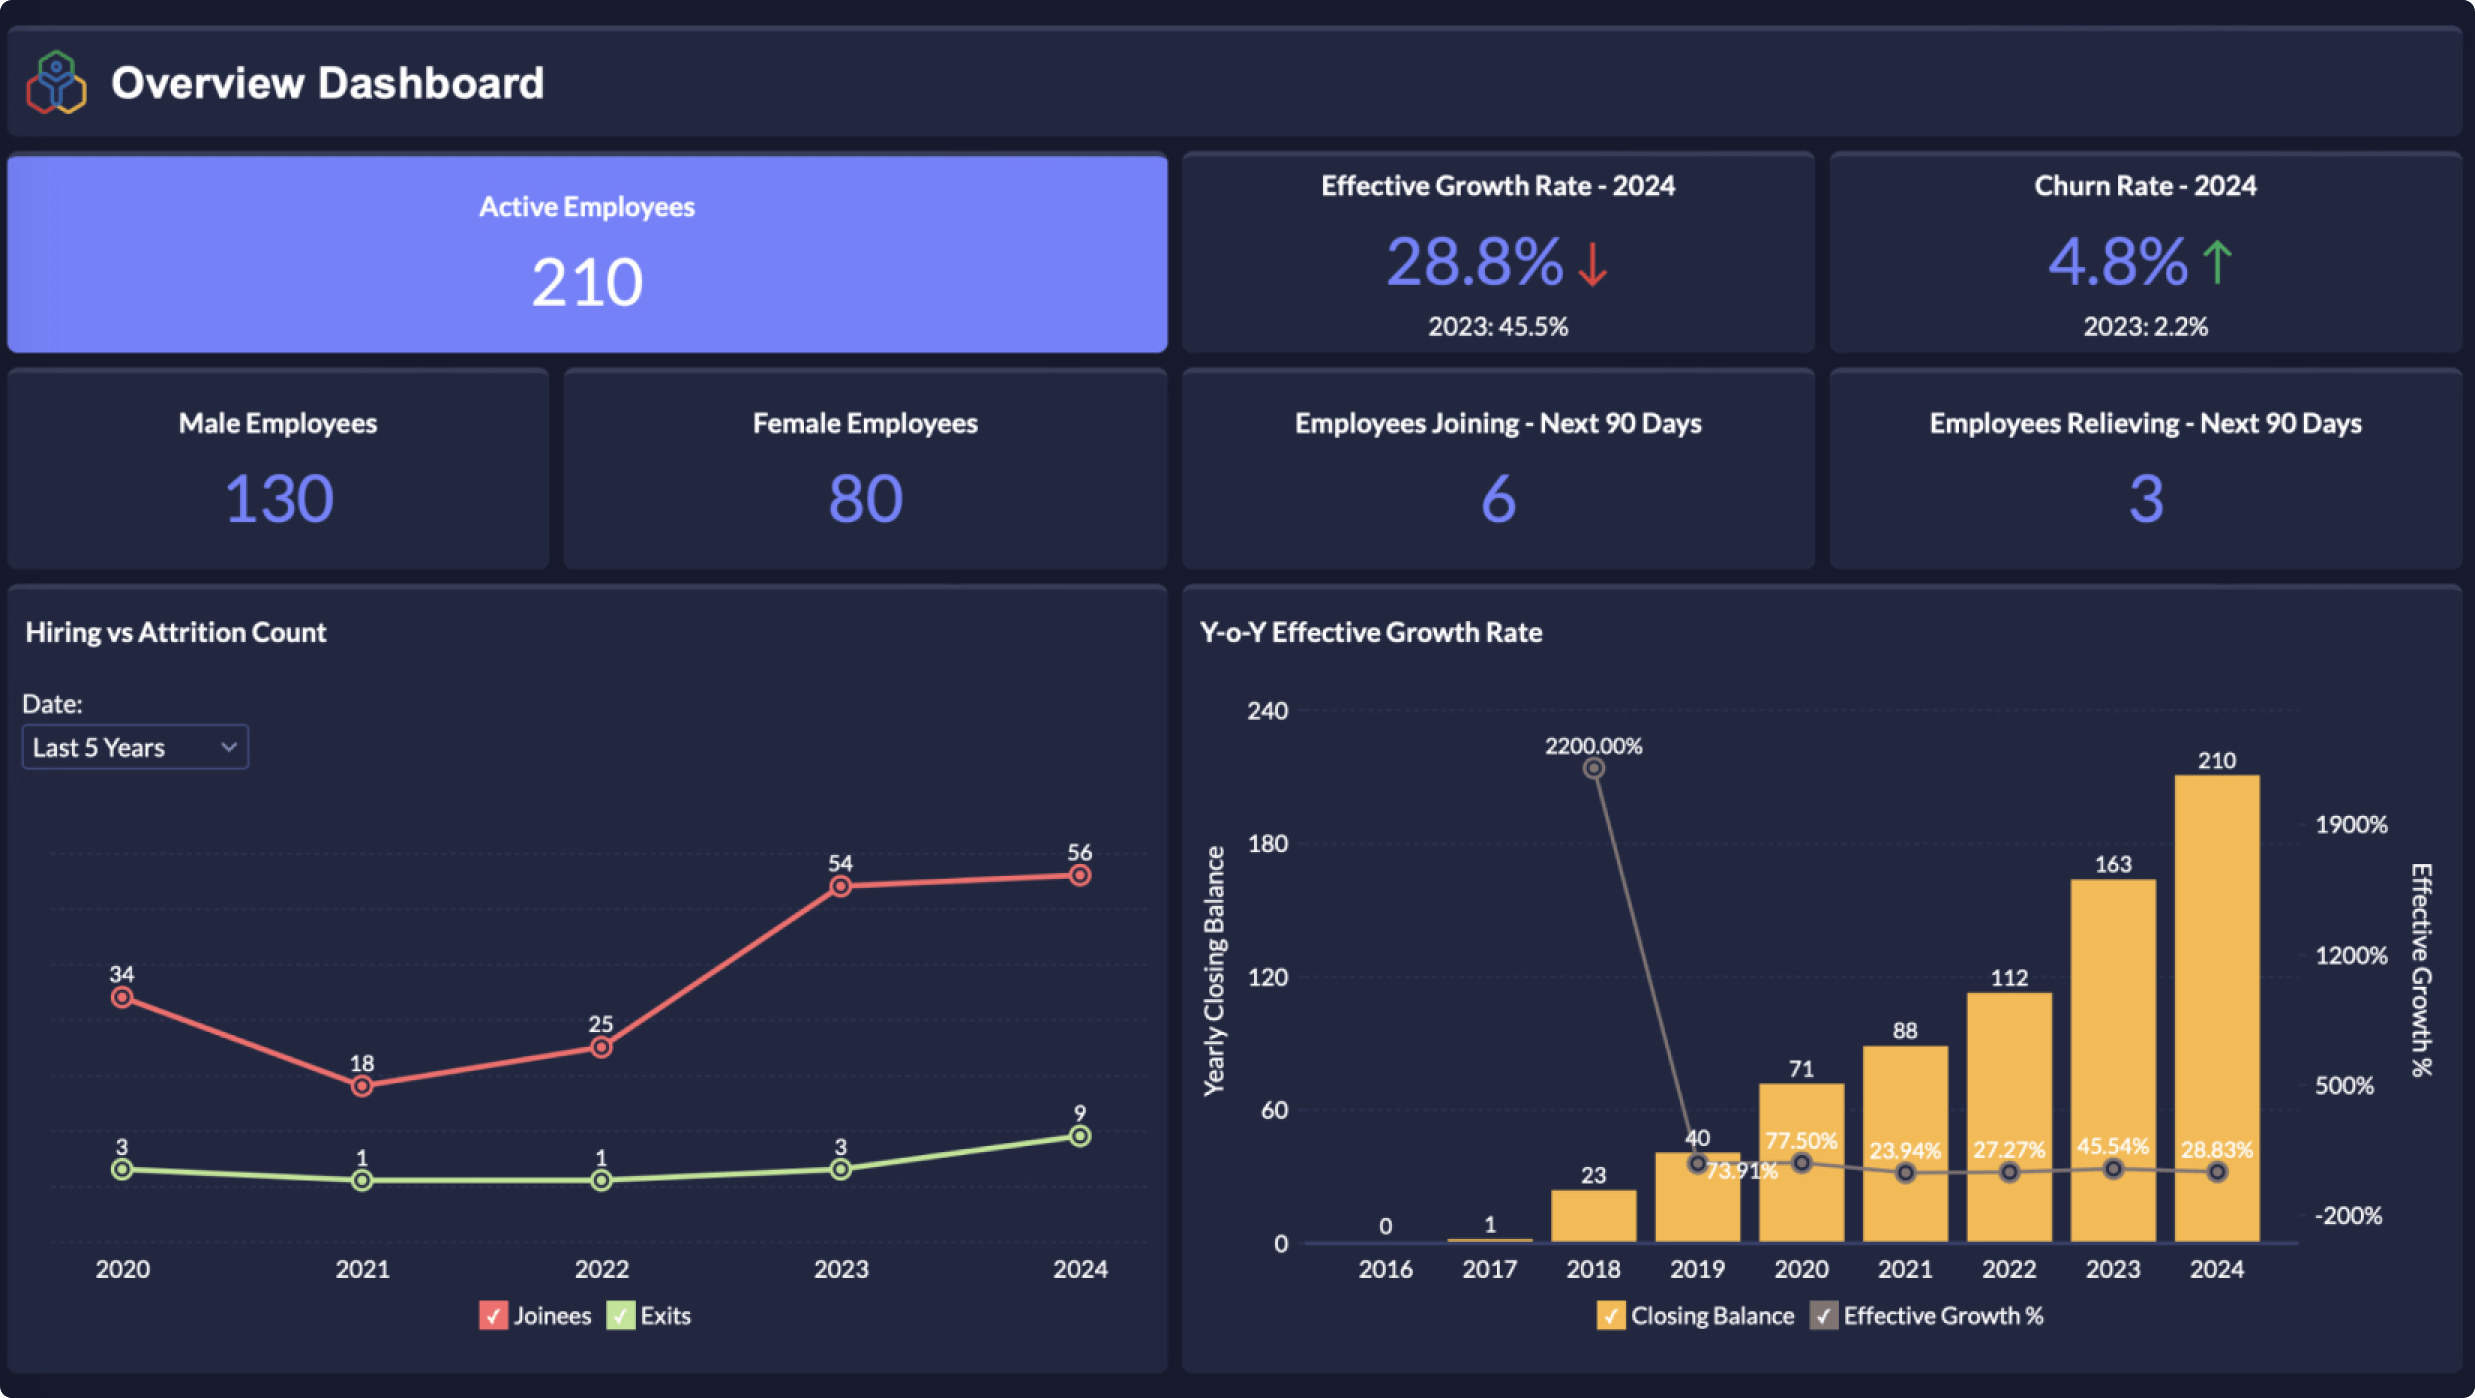
Executive HR Dashboard
For leadership, one number rarely tells the whole story. This dashboard rolls up recruitment, onboarding, engagement, performance, and attrition into a single view built for decisions, not deep dives.
KPIs to track in an HR dashboard
Not every KPI matters equally to every reader. A CFO cares about cost per hire and revenue per employee. An HR manager cares about absenteeism and engagement scores. The KPIs below cover both ends, so pick the ones that match what you're actually trying to fix.
Employee Turnover Rate:
Calculation: (Number of employees who left during a period / Average number of total employees) * 100
Employee turnover rate is a crucial KPI that sheds light on how quickly employees are leaving the company, which can signal underlying issues with retention and engagement.
Employee Satisfaction Score:
Calculation: Average score from employee satisfaction surveys
To measure overall employee satisfaction, organizations conduct periodic surveys to assess how content employees are with their work, their work environment, and their management.
Absenteeism Rate:
Calculation: (Total number of days absent / Total number of available workdays) * 100
Absenteeism rate is another vital metric that helps organizations understand how often and to what extent employees are absent from work, as this can have a significant impact on productivity and morale.
Cost Per Hire:
Calculation: (Total recruitment costs / Number of hires)
Cost per hire is a metric used to calculate the average expenses incurred in recruiting and hiring new employees, encompassing various costs such as advertising, recruiter fees, and related expenditures.
Time to Fill Vacancies:
Calculation: (Total time taken to fill vacancies / Number of vacancies filled)
Time to fill vacancies measures the average duration it takes to fill open positions within the organization, providing insights into the efficiency of the recruitment process.
Training and Development Investment:
Calculation: Total expenditure on employee training and development
Investment in training and development is evaluated through this metric, which assesses the resources allocated by the organization to enhance the skills and knowledge of its workforce.
Revenue per Employee:
Calculation: Total revenue / Total number of employees
Revenue per employee is a key indicator of workforce efficiency, as it measures the organization's ability to generate revenue per employee, indicating productivity levels.
Employee Engagement Score:
Calculation: Average score from employee engagement surveys
Employee engagement surveys measure the emotional commitment and motivation of employees towards their work and the organization.
Performance Appraisal Completion Rate:
Calculation: (Number of performance appraisals completed / Total number of performance appraisals due) * 100
This KPI tracks the percentage of performance appraisals completed within the scheduled time frame, indicating the effectiveness of performance management processes.
Diversity and Inclusion Metrics:
Calculation: Percentage of diverse hires, Percentage of diverse promotions, Employee demographics (gender, ethnicity, etc.)
These metrics evaluate the organization's efforts in promoting diversity and inclusion within the workforce, reflecting its commitment to creating a more equitable workplace.
Key capabilities of an HR dashboard:
Ask questions in plain English
Instead of building a new report every time someone asks "what's our attrition rate for engineering this year," just ask Zia, Zoho Analytics' AI assistant, and get an answer in seconds. No need to know SQL, and no waiting on the data team.
Pull data from wherever it lives
Most HR teams run on more than one tool: an ATS, payroll software, a survey tool, maybe a separate time-tracking app. Zoho Analytics connects to all of them and blends the data automatically, so you're not exporting spreadsheets by hand every month.
Build it yourself, no developer required
Drag-and-drop report building means HR teams can create and adjust their own dashboards without filing a ticket with IT every time a metric needs to change.
Check it from anywhere
Dashboards work the same on desktop and mobile, so a hiring manager can check candidate pipeline status from their phone between interviews.
Share without losing control
Give leadership a live view of hiring and attrition trends, restrict what each team can see, and collaborate on the same dashboard in real time instead of emailing screenshots back and forth. Facilitate easy sharing and collaboration of interactive data visualizations to enhance organizational effectiveness.
HR dashboard templates
What Makes Zoho Analytics the Best HR Dashboard Software?
Zoho Analytics stands out as a powerful, user-friendly HR dashboard software to transform raw workforce data into actionable insights. Here’s why it’s trusted by HR teams across industries:
- Unified HR data analysis - Seamlessly integrate data from various HR systems to eliminate silos and gain a holistic view of your workforce.
- Ready-to-use dashboard templates - Access a wide range of prebuilt dashboards for key HR areas and start tracking essential KPIs right away.
- AI-powered insights with Zia - From forecasting attrition to identifying skill gaps, Zia helps HR teams make faster, data-backed decisions.
- Self-service, collaborative analytics - Empower HR professionals to build and customize their own reports with an intuitive drag-and-drop interface. Share dashboards securely and collaborate in real time across teams.
See Your HR Data in a Dashboard, Not a Spreadsheet
Connect your HR data and get a working dashboard in minutes, not weeks.
SIGN UP FOR FREEFrequently Asked Questions
What should I look for when choosing HR dashboard software?
The right HR dashboard software connects to the tools your team already uses, like ATS, payroll, engagement surveys, and time tracking, and blends data from all of them automatically. Beyond connectivity, look for self-service reporting so HR managers can update dashboards themselves, role-based sharing so leadership sees the right metrics without accessing everything, and AI assistance that answers plain-English questions. Zoho Analytics covers all of this without a lengthy setup.