What will I learn?
- What is Business Intelligence reporting?
- Why is BI reporting important?
- How does BI reporting work?
- Types of Business Intelligence reports
- BI reporting examples and use cases
- How to create a quality BI report?
- Best practices of BI reporting
- Why you need BI reporting tools
- Key features of BI reporting tools
- Common BI reporting challenges and considerations
- Best BI reporting tool
Business Intelligence Reporting
Organizations that utilize data effectively are reaping rich dividends. Hence, business intelligence is becoming a crucial part of the decision-making process that necessitates the use of business intelligence reporting.
What is Business Intelligence reporting?
The term Business Intelligence (BI) reporting refers to the process of data collection, analysis, and presentation of actionable insights. It acts as a key tool for businesses to understand the current state of business by identifying trends and patterns, and serves as an important enabler for effective decision-making.
Why is BI reporting important?
Business Intelligence (BI) reporting is a necessity in today's organizations due to the following reasons:
- Strategic Planning: BI reporting offers a detailed and comprehensive view of key performance indicators and business trends. This helps organizations to formulate and fine-tune their strategies in line with the current business landscape.
- Performance Monitoring: BI reporting facilitates monitoring of key performance metrics in real-time to track progress, identify areas of improvement, and tweak strategies wherever necessary.
- Operational Efficiency: BI reporting helps with identification of bottlenecks, improving resource allocation, and thereby enabling streamlined process workflows and efficient, seamless operation.
- Competitive Advantage: By leveraging BI reporting, organizations can stay up-to-date about key facets of the business like customer behavior, market demands etc, to make strategic moves in order to stay ahead of the competition.
How does BI reporting work?
BI reporting is a process that is systematic and repetitive. The key components of the BI data reporting process include:
- Data collection: Raw data is collected and synthesized from a plethora of sources such as files and feeds, local or cloud databases, business applications, information systems, and more. The collected data is then cleansed, transformed, and modeled for further analysis.
- Data Analysis: Users can analyze data effectively through self-service BI components like charts, tables, widgets etc. Using these components, they can design interactive reports/dashboards that enables ad-hoc analysis and collaboration with peers anytime.
- Presentation: Apart from presenting insights through reports/dashboards, they can be assimilated through more user-friendly consumable formats like slideshows, portals or even through contextual embedding within relevant business workflows.
- Collaboration: Business stakeholders with access to the assimilated reports/dashboards can collaborate over it through contextual comment threads or real-time messaging in order to expedite decision-making.
Types of Business Intelligence reports and dashboards
Since BI reporting is used by stakeholders at all levels in an organizational hierarchy, we can categorize the BI reports (or) dashboards into four types:
- Strategic BI reports and dashboards are focused on tracking long-term strategic objectives and outcomes through high-level metrics.
- Operational reports enable monitoring of operational processes through relevant performance metrics tracked mostly in real-time.
- Analytical reports are purpose-specific ones created by analysis packed with relevant insights for stakeholders.
- Tactical BI reports are used by middle-managers to track their department or function specific performance over standard durations like daily, monthly, or yearly.
BI reporting examples and use cases
Sales
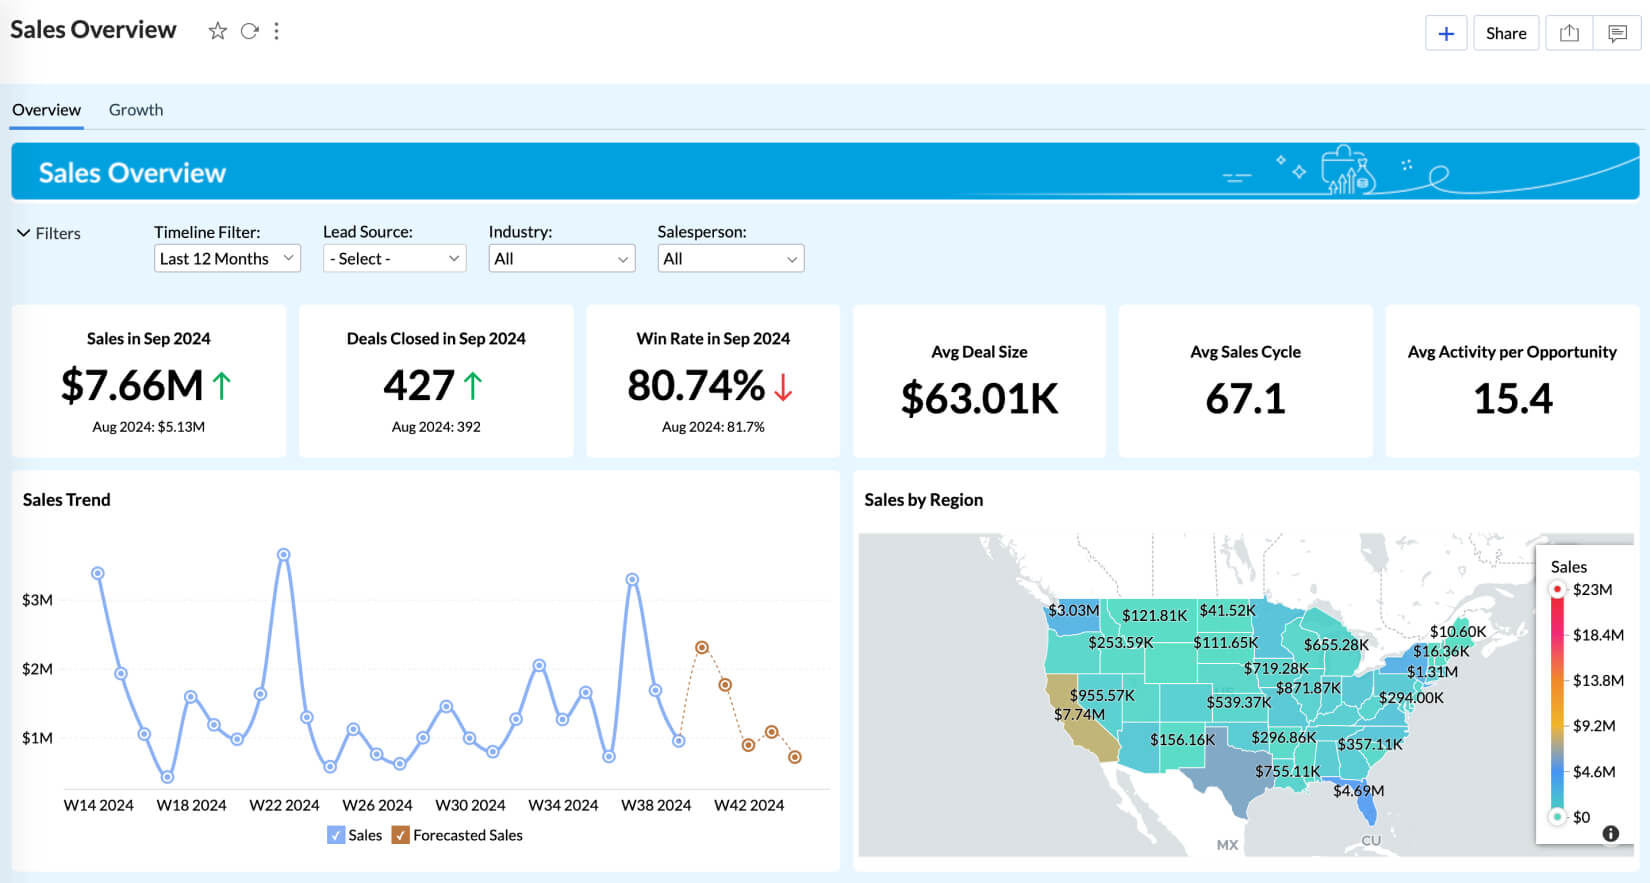
BI reporting using sales analytics tools, can provide a complete view of prospects' journeys—all the way from initial interest to final purchase. The detailed insights available on their behavior and preferences help in crafting targeted campaigns with personalized messaging.
Marketing
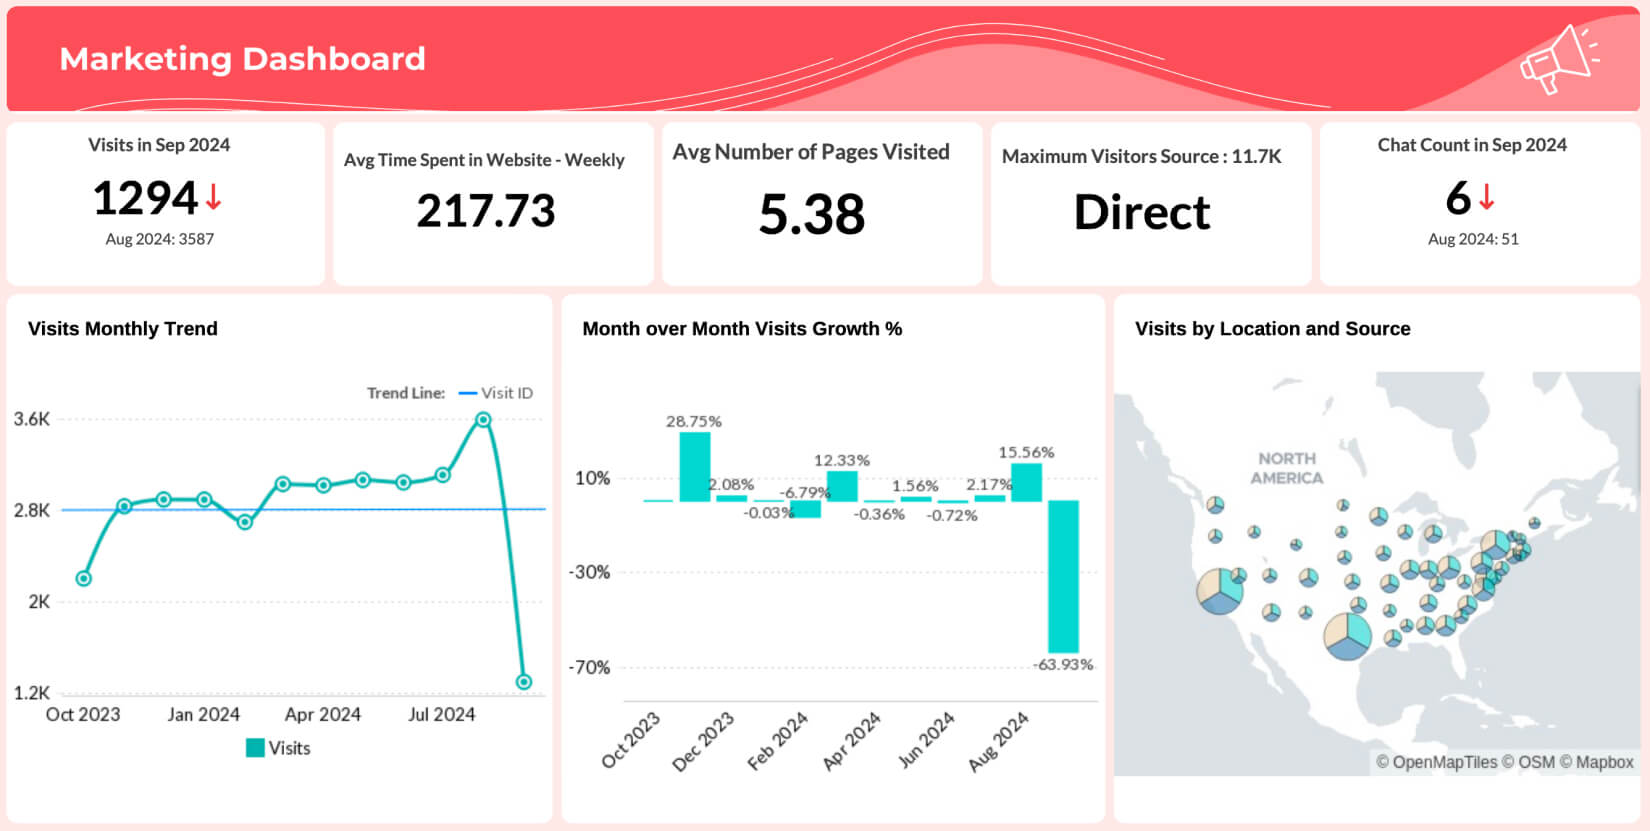
Measure the impact of your marketing initiatives in terms of reach, engagement, and conversion rates, continually with BI reporting using marketing analytics software. Share relevant insights easily with stakeholders for their awareness, monitoring, and decision-making.
Human Resources
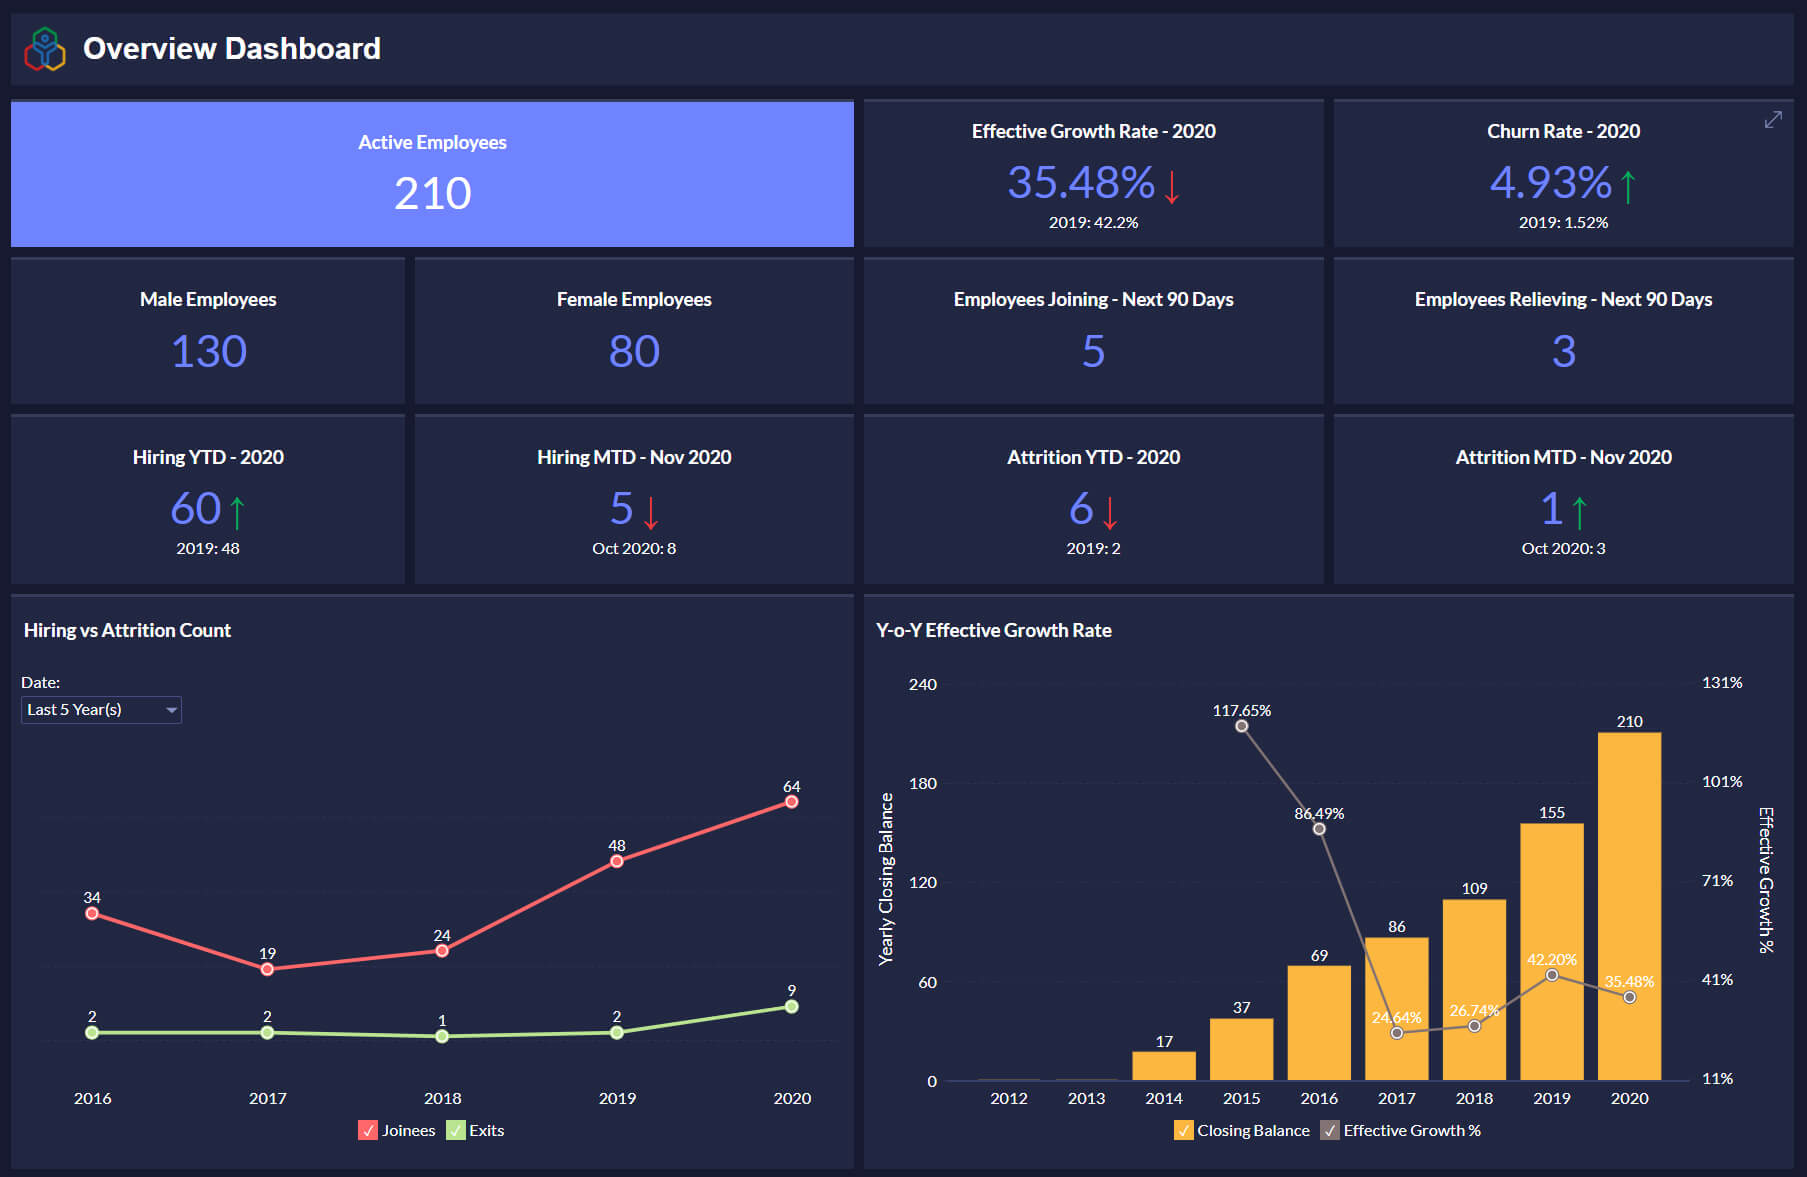
BI reporting provides timely insights for organizations to hire the right talent, optimize benefits for employee retention, and identify areas for skill development. It also enables seamless collaboration of HR with other departments for workforce planning and monitoring. Know more about building HR dashboards>
Finance
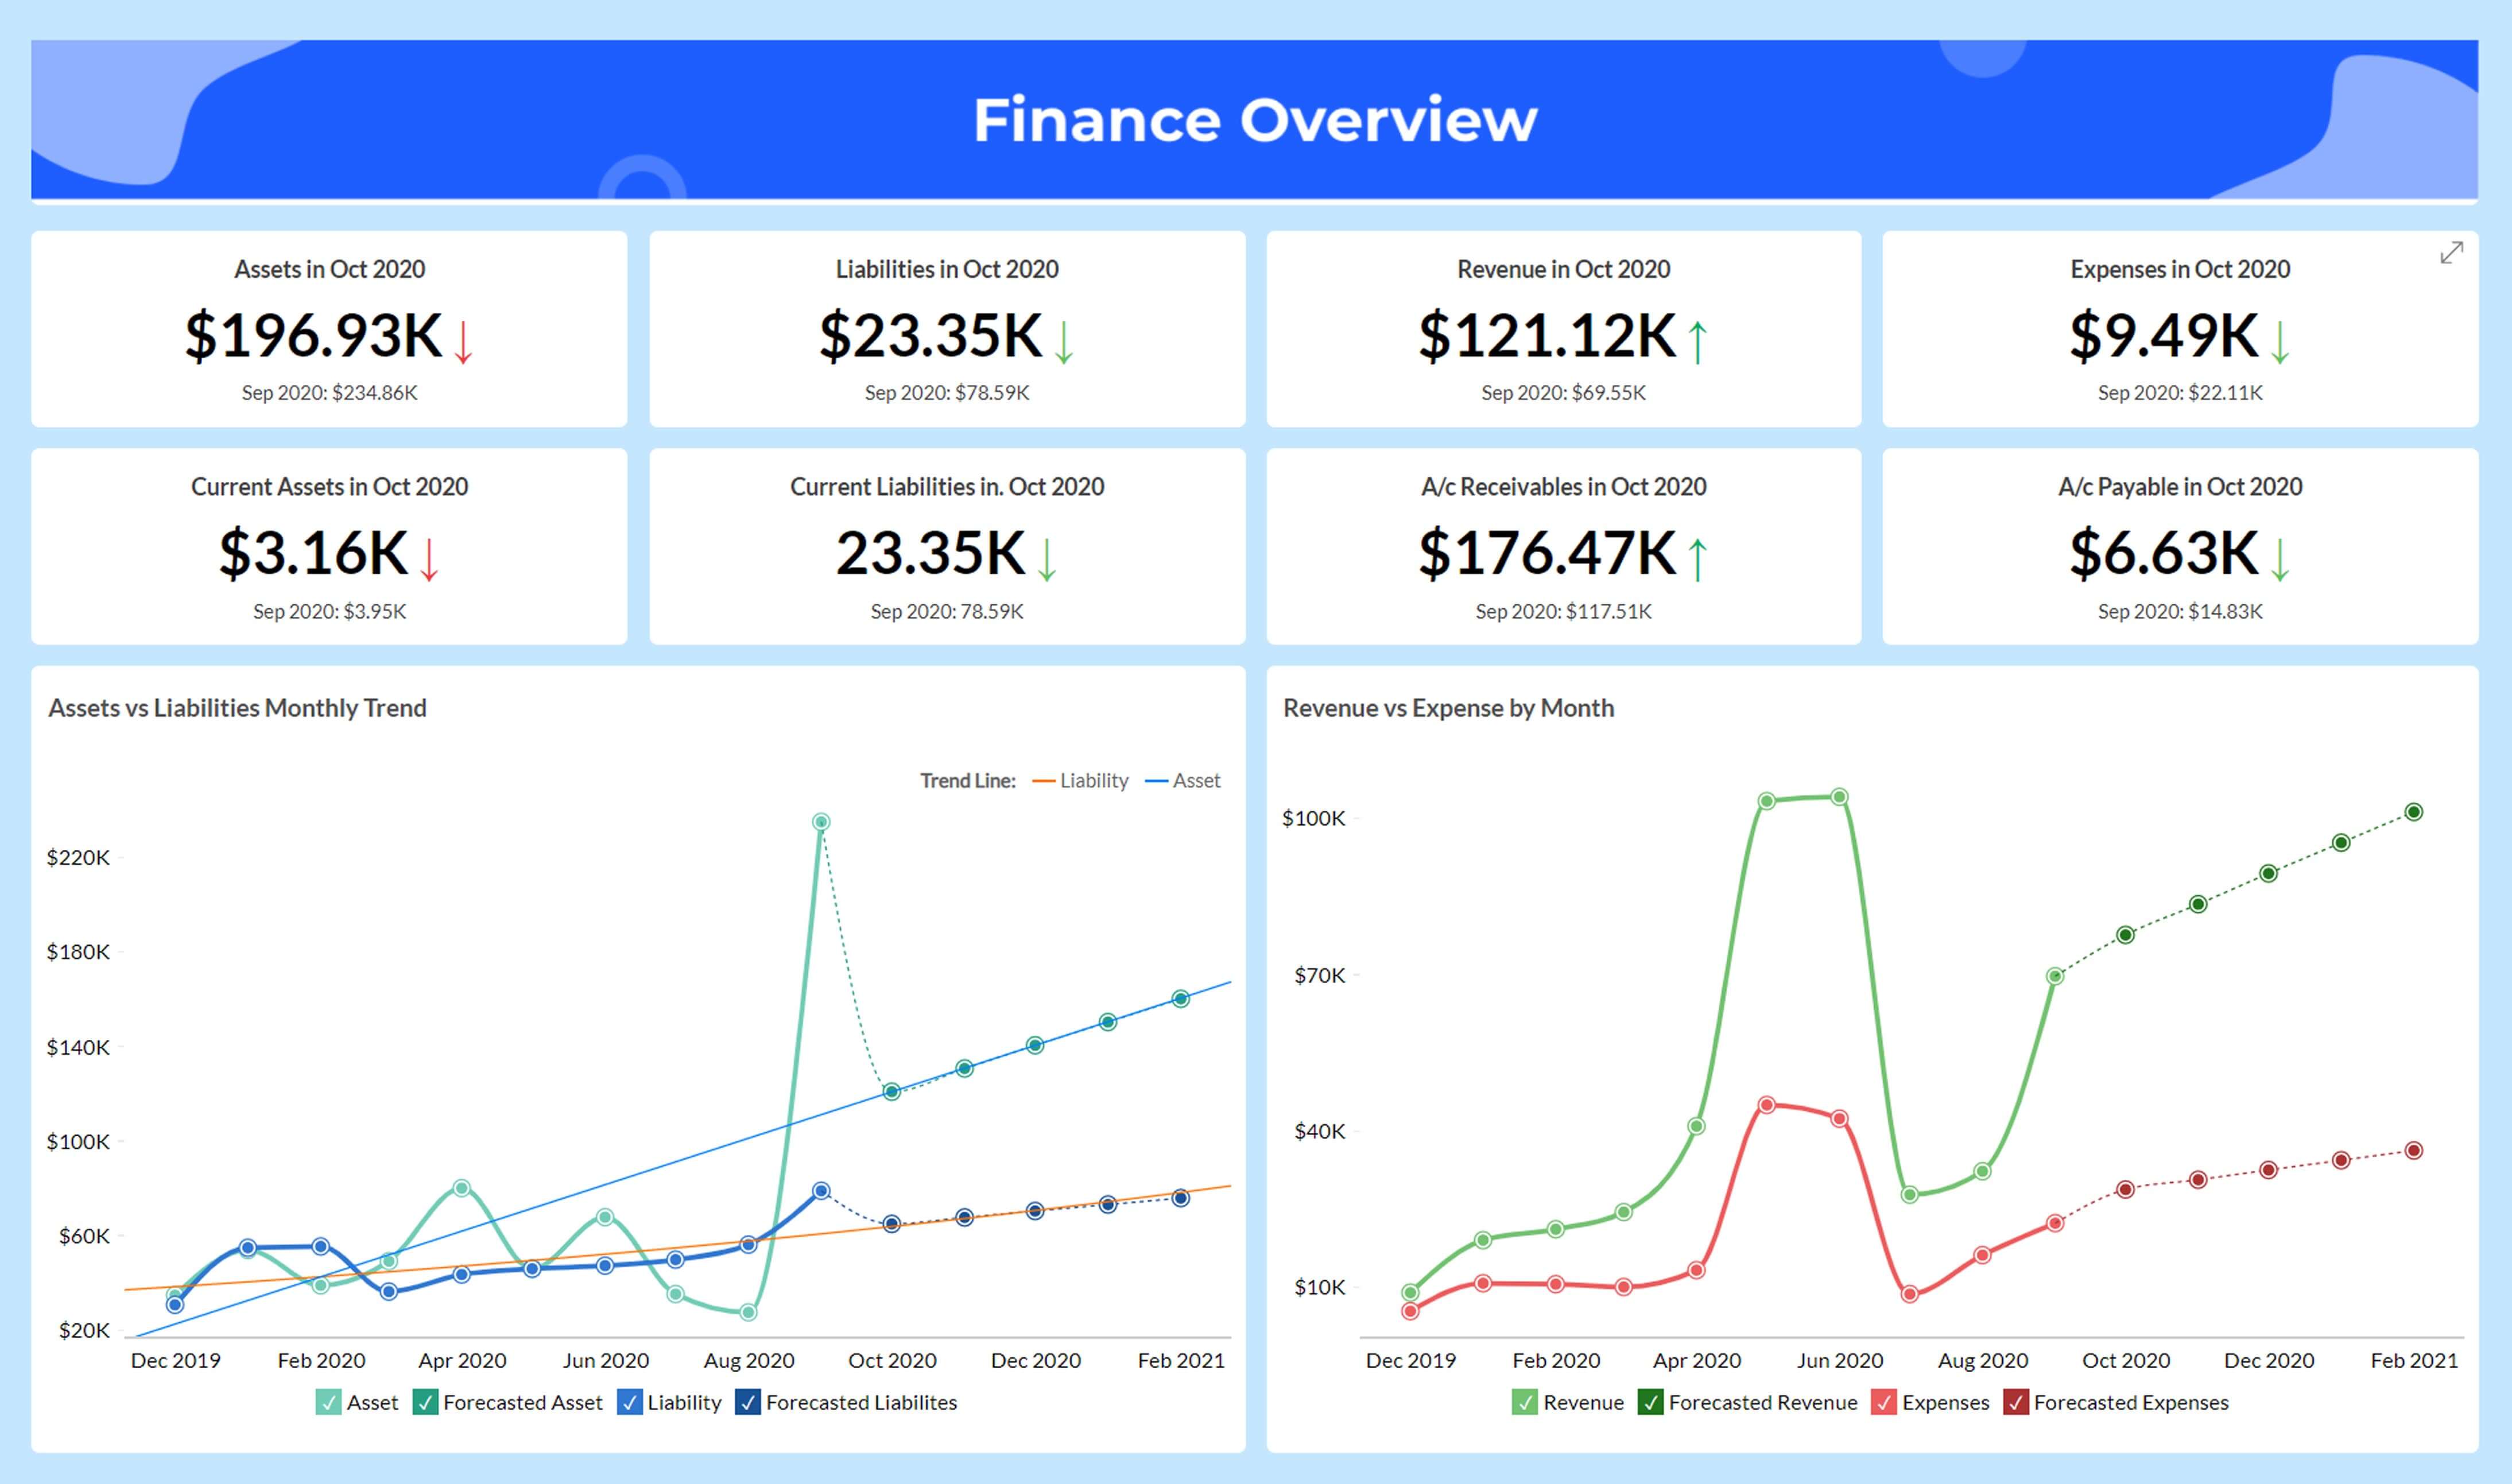
The financial health and performance of an organization can be effectively monitored through tracking of key indicators like cash flow volume, profit margins, forecasted revenue, etc.Know more about financial analytics
Customer Service
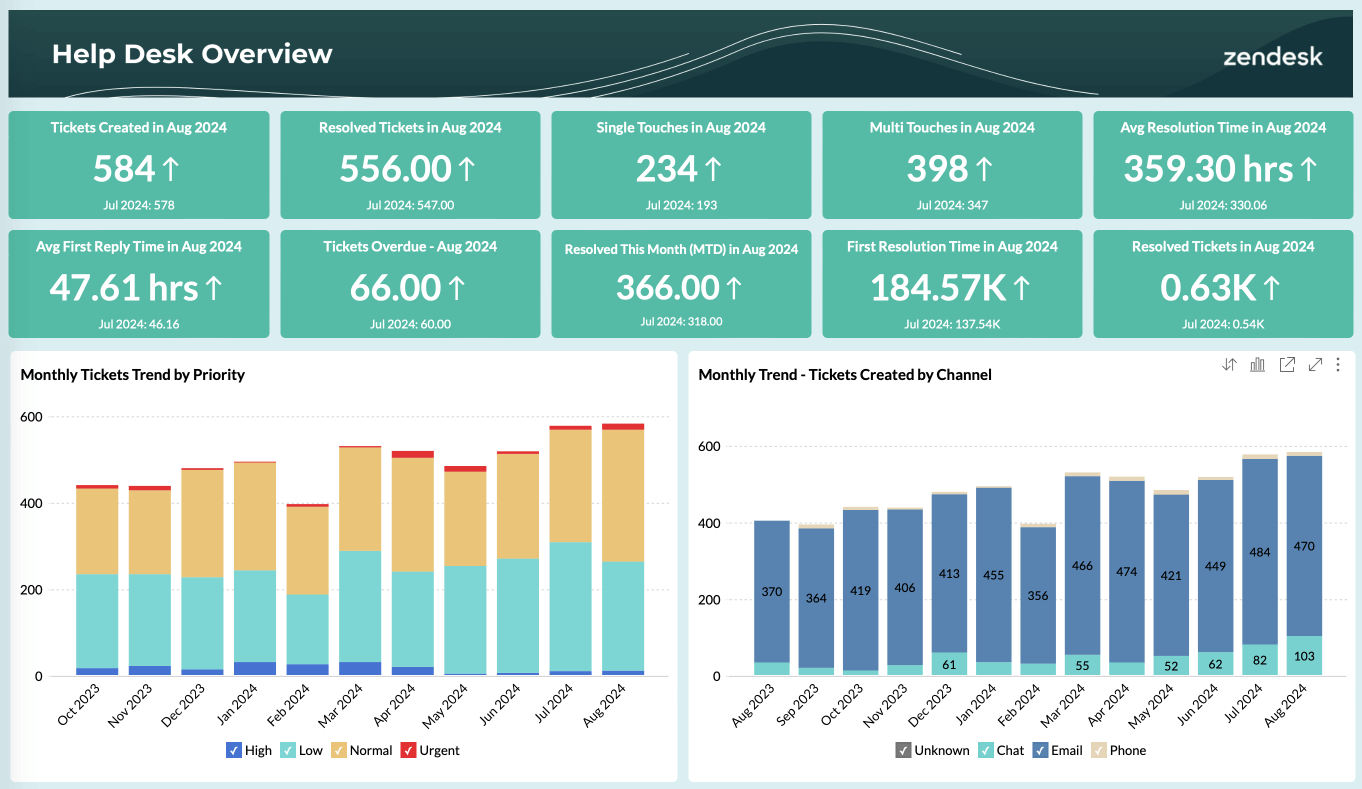
BI reporting offers relevant insights on support agent performance, customer satisfaction and retention, and much more. Organizations can tailor personalized customer experience based on the detailed analysis of customer data.
How to create a quality BI report?
Creating a quality Business Intelligence (BI) report ensures effective communication of insights and supports informed decision-making. Here's our 4-step guide on creating a quality BI report:
- Know your audience - It is important to understand your target users to build reports that resonate emotionally and intellectually with them. This involves knowing the specific needs of users based on their business roles and their usability preferences like font, colors and more.
- Handle diverse data - Collect relevant data from all possible sources. Cleanse, transform and enrich the data for further analysis. Use the most suitable visualization for each data format to make the overall BI report effective.
- Augmenting interactivity - Enabling interactive capabilities like drill-down, filtering, and sorting in BI reports facilitates ad hoc analysis and allows users to uncover more relevant insights in real-time.
- Brand guidelines - To ensure consistency and high standards in the visual form and function of BI reports, it is important to adhere to established brand guidelines and standard data governance practices.
Best practices for BI reporting
- Comprehend User Needs: The most important aspect before setting up a BI reporting system is thorough understanding of the end-users, i.e., their persona, and their specific needs or behavior, in order to tailor appropriate reports for them.
- Establish Data Governance: Leveraging robust data governance practices for BI reporting like establishing data standards, defining data ownership, regular audit, and cleaning up of data shall ensure the quality and consistency of data, especially for cloud BI reporting
- Use Key Performance Indicators (KPIs): Identify apt key performance indicators (KPIs) that align with organizational goals and use them to provide actionable insights to decision makers with respect to monitoring performance and progress.
- Enable Interactivity: BI reporting with capabilities like drill-downs, filters, and automated insights enable users to gain deeper and contextual insights with interaction and exploration with data. There should be scope for mobile BI that enable users to easily access and interact with reports on the go.
- Keeping reports up-to-date: Refresh and update data to ensure that the BI reports reflect the latest information. Also ensure the relevance and effectiveness of the reports by gathering user feedback regularly.
- Foster Collaboration: BI reporting powered with collaboration features like sharing reports, contextual comment threads, etc., fosters a tightly-knit working environment between stakeholders that enable them to make data-driven decisions collectively.
Why you need BI reporting tools
Business Intelligence (BI) reporting tools play a vital role in extracting vital, actionable insights from raw business data. Here are some compelling reasons why organizations need BI reporting tools.
- Data Consolidation: BI reporting tools allow organizations to gather and collate data from multiple sources like files and feeds, databases, business applications, external systems, and more. The consolidation offers an unified view of data for further analysis and reporting.
- Data Analysis and Exploration: BI reporting tools enable users to analyze data by building interactive visualizations, create ad-hoc queries, apply filters to uncover patterns and trends, etc.
- Efficiency and Automation: BI reporting tools can automate a large chunk of activities that would require huge manual effort like data collection and preparation, analysis and report creation. This automation minimizes errors, and ensures consistency of the reporting process.
- Ad Hoc Reporting: Modern BI tools offer the flexibility for users to meet their specific information needs through ad-hoc report generation capabilities powered by an intuitive visualization builder, AI-powered conversational analytics etc.
- Scalability: Today's AI-powered BI tools can scale to handle larger volumes of data to meet evolving business needs.
Key features you should look for when evaluating BI reporting tools
When evaluating Business Intelligence (BI) reporting tools, it is essential to look out for several key features to ensure that the selected tool meets your business needs and objectives. Here are some of them:
- Data Connectivity: A comprehensive BI reporting tool should support data sources across multiple categories, including databases, spreadsheets, cloud-based storage, and external APIs. This ability also enhances the tool's versatility.
- Data Visualization Options: A BI based tool that offers visualization flexibility, i.e., a variety of options such as charts, graphs, maps, and BI dashboards, enables users to present insights in relevant and suitable formats.
- Advanced Analytics: Evaluate whether the BI tool offers advanced analytics features such as predictive modeling, scenario analysis and machine learning (ML) powered capabilities, that can facilitate a more robust and sophisticated data analysis.
- Customization Options: Look for BI tools that offer a high degree of customization, i.e., the ability to design reports, dashboards, and visualizations according to organizational branding and user preferences.
- Ease of Use: User-friendly BI tools should have an intuitive interface design, allowing both technical and non-technical users to easily navigate and create reports.
Zoho Analytics has all the salient features listed above and much more to be an effective BI reporting software
Common BI reporting challenges and considerations
Implementing Business Intelligence (BI) reporting solutions can bring both benefits and challenges for organizations. Understanding the challenges and crafting appropriate responses is essential for a sustainable BI reporting system for successful BI implementation.
Here are some common BI reporting challenges for consideration:
Data Quality and Integration
- Challenges: The key reasons for inaccuracy in BI reporting are inconsistency in data quality and difficulty in integrating data from various sources.
- Consideration: The approach to ensure a reliable and unified dataset should be based on enforcing data quality measures like standardization of data formats, and usage of effective data integration tools.
Tool Complexity & Usage
- Challenge: Some features or capabilities of BI reporting systems can be inherently complex, making it difficult, especially for non-technical users, to leverage them.
- Consideration: The complete set of BI capabilities can be leveraged by a wider user base by
- Providing sufficient training and detailed user documentation about the BI reprting tool.
- Making data democratization as an ingredient of the business culture through various measures like upskilling stakeholders and raising awareness with respect to leveraging data and analytics
Data Security
- Challenge: In today's big data era, with so much of threats and challenges to data security and privacy all around, it is natural for organizations to be skeptical about the data security practices of third-party BI tools.
- Consideration: BI reporting and analytics must provide the necessary requisites from their end, for their clients to set up robust security measures and processes in order to protect their data.
What makes Zoho Analytics a best BI reporting tool?
Zoho Analytics stands out as a leading BI reporting software owing to its depth, flexibility, and ease of use for all types of users. Here are a few key aspects that set the platform apart:
- End-to-End Reporting:Zoho Analytics supports the entire BI lifecycle, from data preparation and modeling to advanced reporting and sharing, all within a single, unified platform.
- AI-Powered Insights:With Zia, Zoho’s built-in AI assistant, users can ask questions in natural language, receive instant insights, and generate smart narratives without writing a single line of code.
- Multi-Source Data Integration:Connect and blend data from 250+ sources, including files, cloud drives, local/cloud databases, and popular business applications.
- Embedded Analytics:Deliver custom-branded reports or seamlessly embed analytics into your own applications using Zoho’s developer-friendly tools and white-labeling capabilities.
- Secure Sharing & Collaboration:Share reports with fine-grained access controls, collaborate via contextual comments, and enable in-report discussions with built-in messaging tools.
Zoho Analytics as a Business Intelligence(BI) reporting software, has a proven record to create easily customizable reports and dashboards at scale. You can get started with Zoho Analytics for free.
SIGN UP FOR FREE