Sankey Chart
A Sankey chart is a visualization that shows the directional flow of processes and activities from an initial node to a terminal point through interconnected lines. The width or thickness of the interconnecting lines is proportional to the flow rate. The width of each connecting line is determined by the value of the corresponding pairing, relative to other values present in the data.
An alluvial (multi- level sankey) chart visualizes the flow and relationships between categories over multiple stages or time periods. It uses interconnecting lines to represent the transitions between categories, illustrating how they evolve and interact across different stages.
- When to use
- Data Requirement
- Creating a Sankey Chart
- Customizing a Saney Chart
- Creating an Alluvial Chart
- Customizing an Alluvial Chart
- Possible Combinations
When to Use
- To visualize the customer's journey from initiation to purchase.
- To understand the movement of stock in a supply chain.
- To map out website traffic flow and the user journey.
Data Requirement
A minimum of two dimension columns and one measure column is required to create a sankey chart.
Creating a Sankey Chart
- Access the table for which you want to visualize the flow
- Click the Create icon on the side navigation panel and choose New Chart View from the drop-down menu.
- In the chart edit, add the columns as given below
- X-axis: Add a dimensional column that denotes the initial node of a process or activity.
- Y-axis: Add a dimensional column that denotes the terminal node in a process.
- Text/Size/Tooltip : Add a Metrics Column.
- Click Generate Graph. A bubble chart will be created. Change the chart type to Sankey.
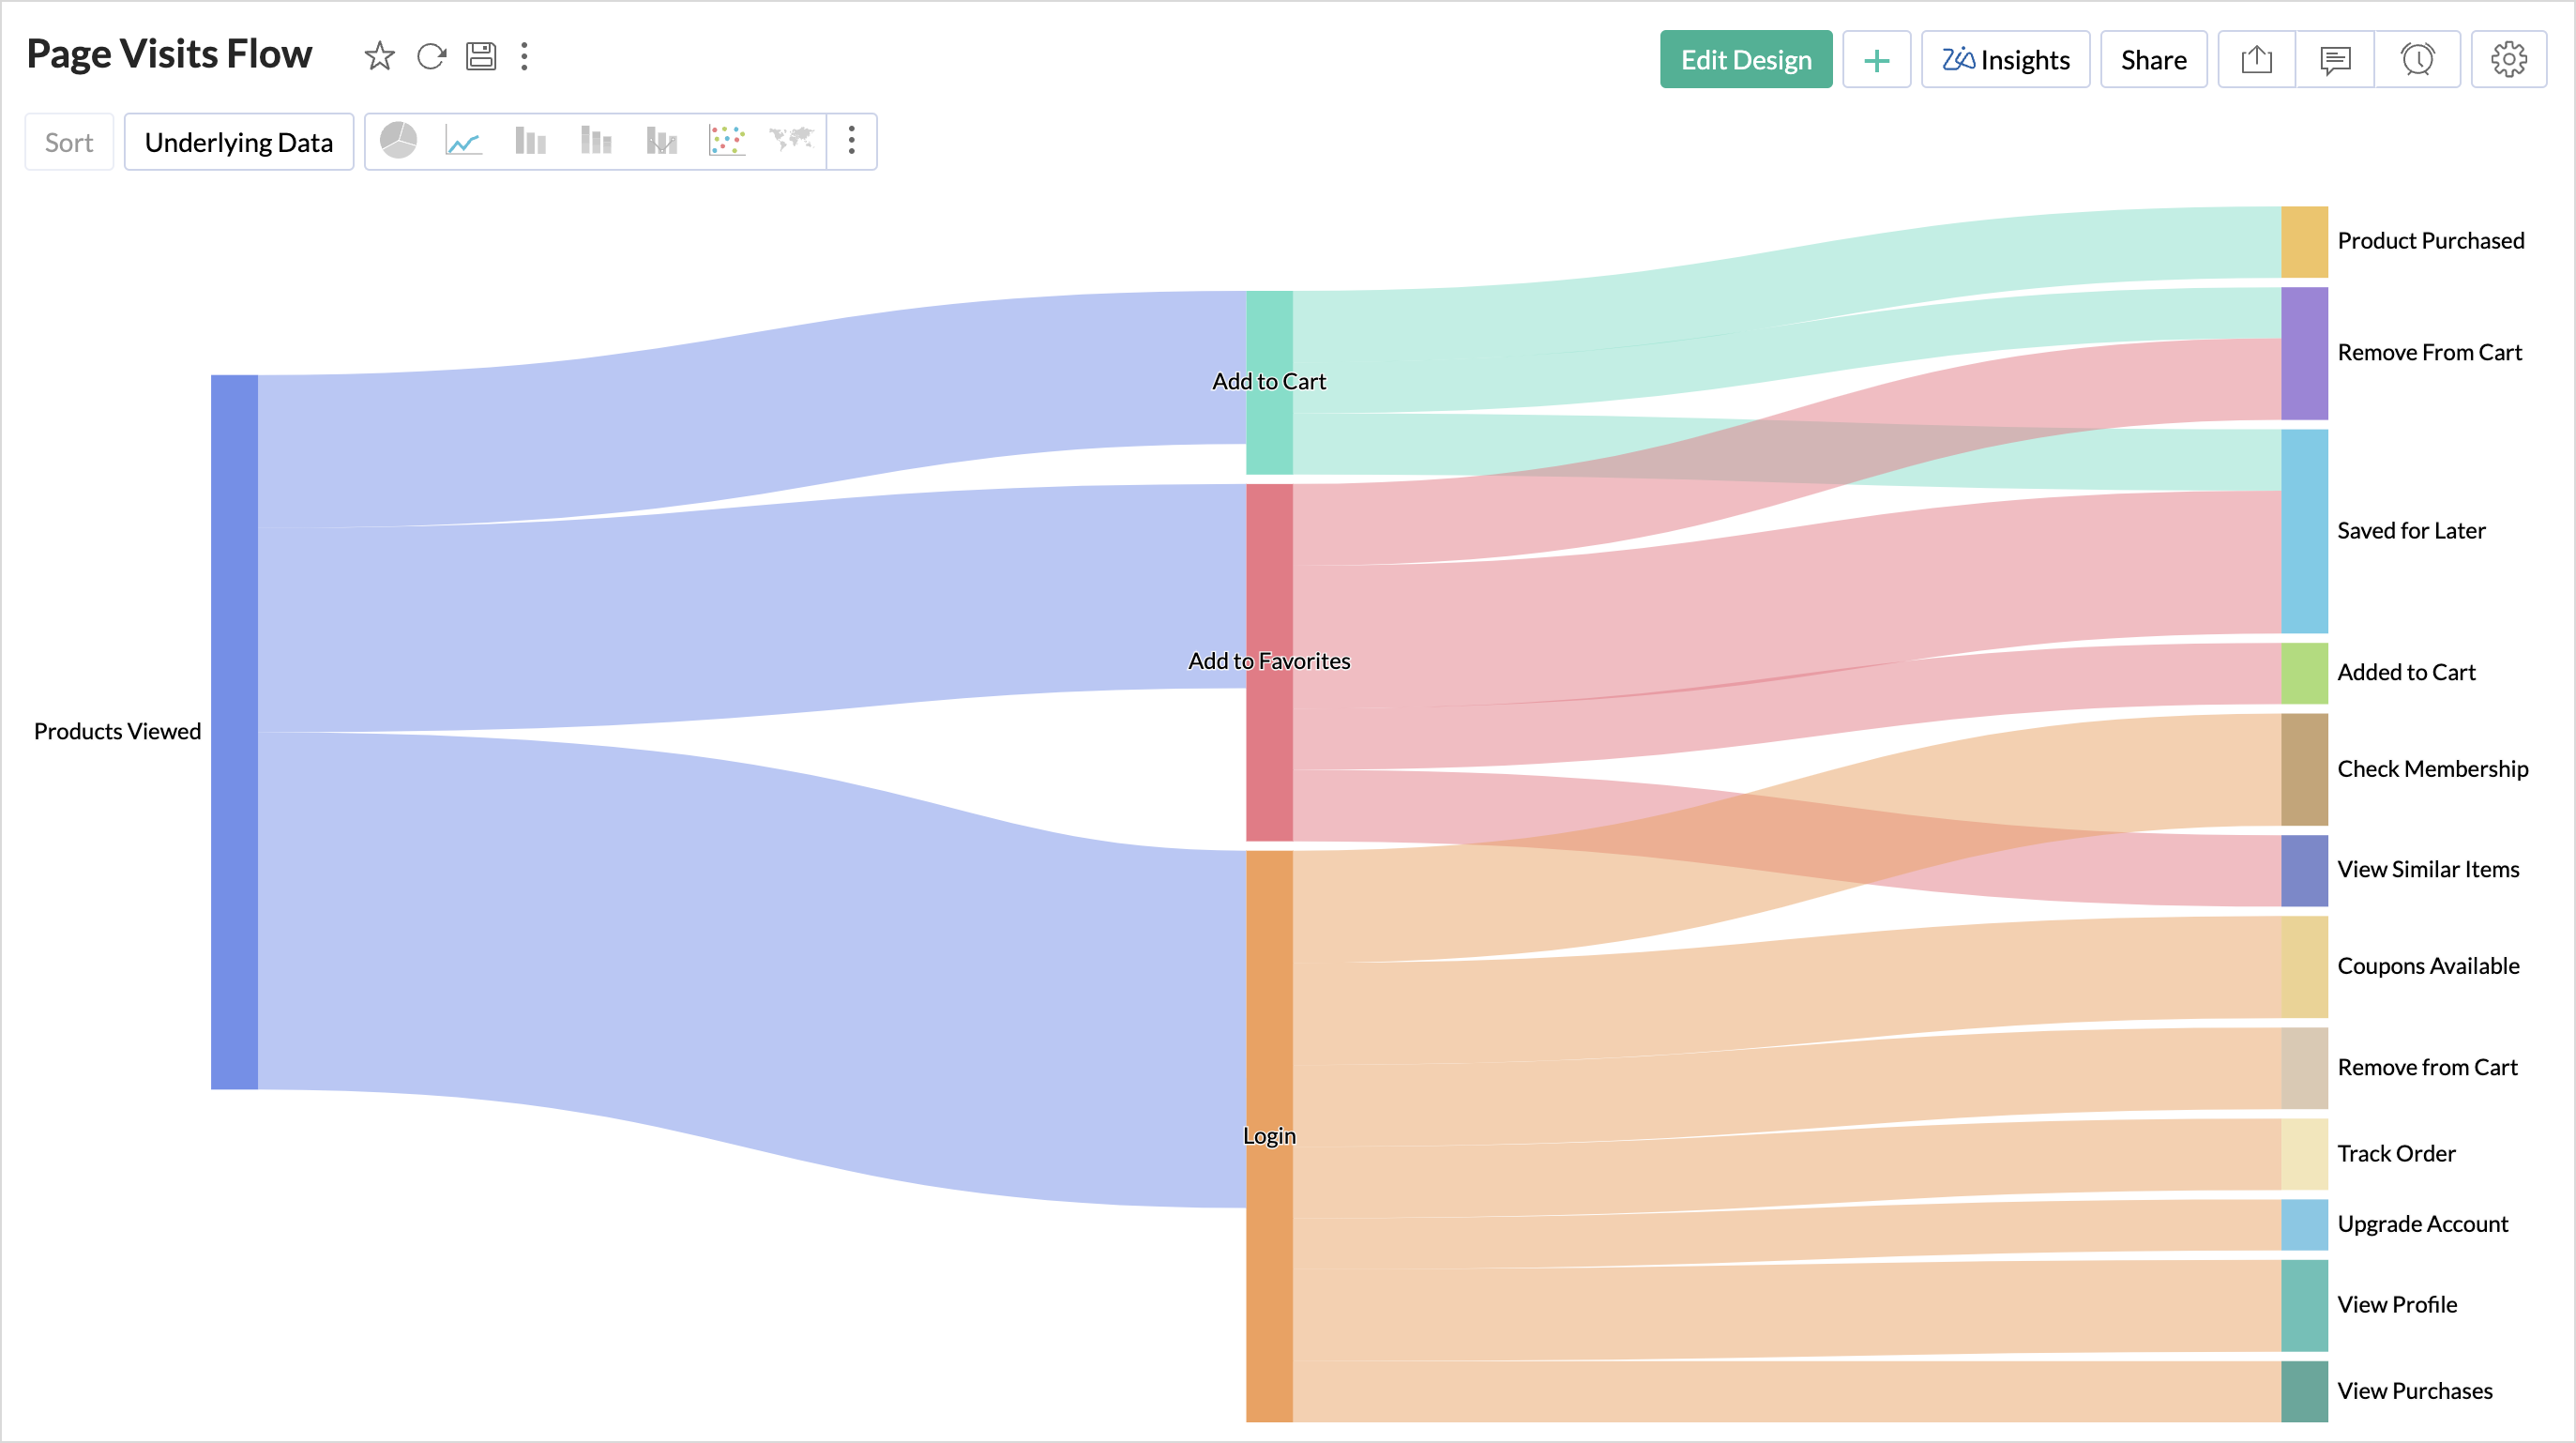
- A sankey chart will be created as shown in the below image.
Customizing a Sankey Chart
Zoho Analytics offers extensive options to customize any chart. This section explains the customization options specific to sankey chart. Refer to the Customizing Charts article to learn more.
- Click the Settings icon in the top right corner.
- Access the Sankey tab.
- The Node Color option helps you customize the color that should be applied for the chart.
- The Across fields option applies specific colors to each node. It helps easily differentiate nodes. The Color Values option helps choose the different colors to be applied.
- The Source option applies colors to the initial nodes and gray color to the destination node. The Color Values option helps choose the different colors to be applied to the initial node. The Other Node Color helps customize the color to be applied to the final node.
- The Destination option applies selected color to the final nodes and gray color to the Source node. The Color Values option helps choose the different colors to be applied to the destination node. The Other Node Color helps customize the color to be applied to the Source node.
- The Link Color option helps customize the color that should be applied to the interconnecting links or lines.
- Source applies the source node color to the interconnecting links.
- Destination applies the color of the terminal node to interconnecting links.
- Gradient gradually transitions from the source node color to the destination node’s color.
Creating an Alluvial Chart (Multi Level Sankey Chart)
- Access the table for which you want to visualize the flow
- Click the Create icon on the side navigation panel and choose New Chart View from the drop-down menu.
- In the chart editor, add the columns as given below
- X-axis: Add a dimensional column that denotes the initial node of a process or activity you want to visualize
- Y-axis: Drag and drop the intermediate (stages) dimensional columns one at a time. You can add a max of three dimension columns to the y-axis.
- Text/Size/Tooltip: Add a Metrics Column. You can add a maximum of three metrics columns to the Text, Size, and tooltip shelves. Click Generate Graph. A bubble chart will be created.
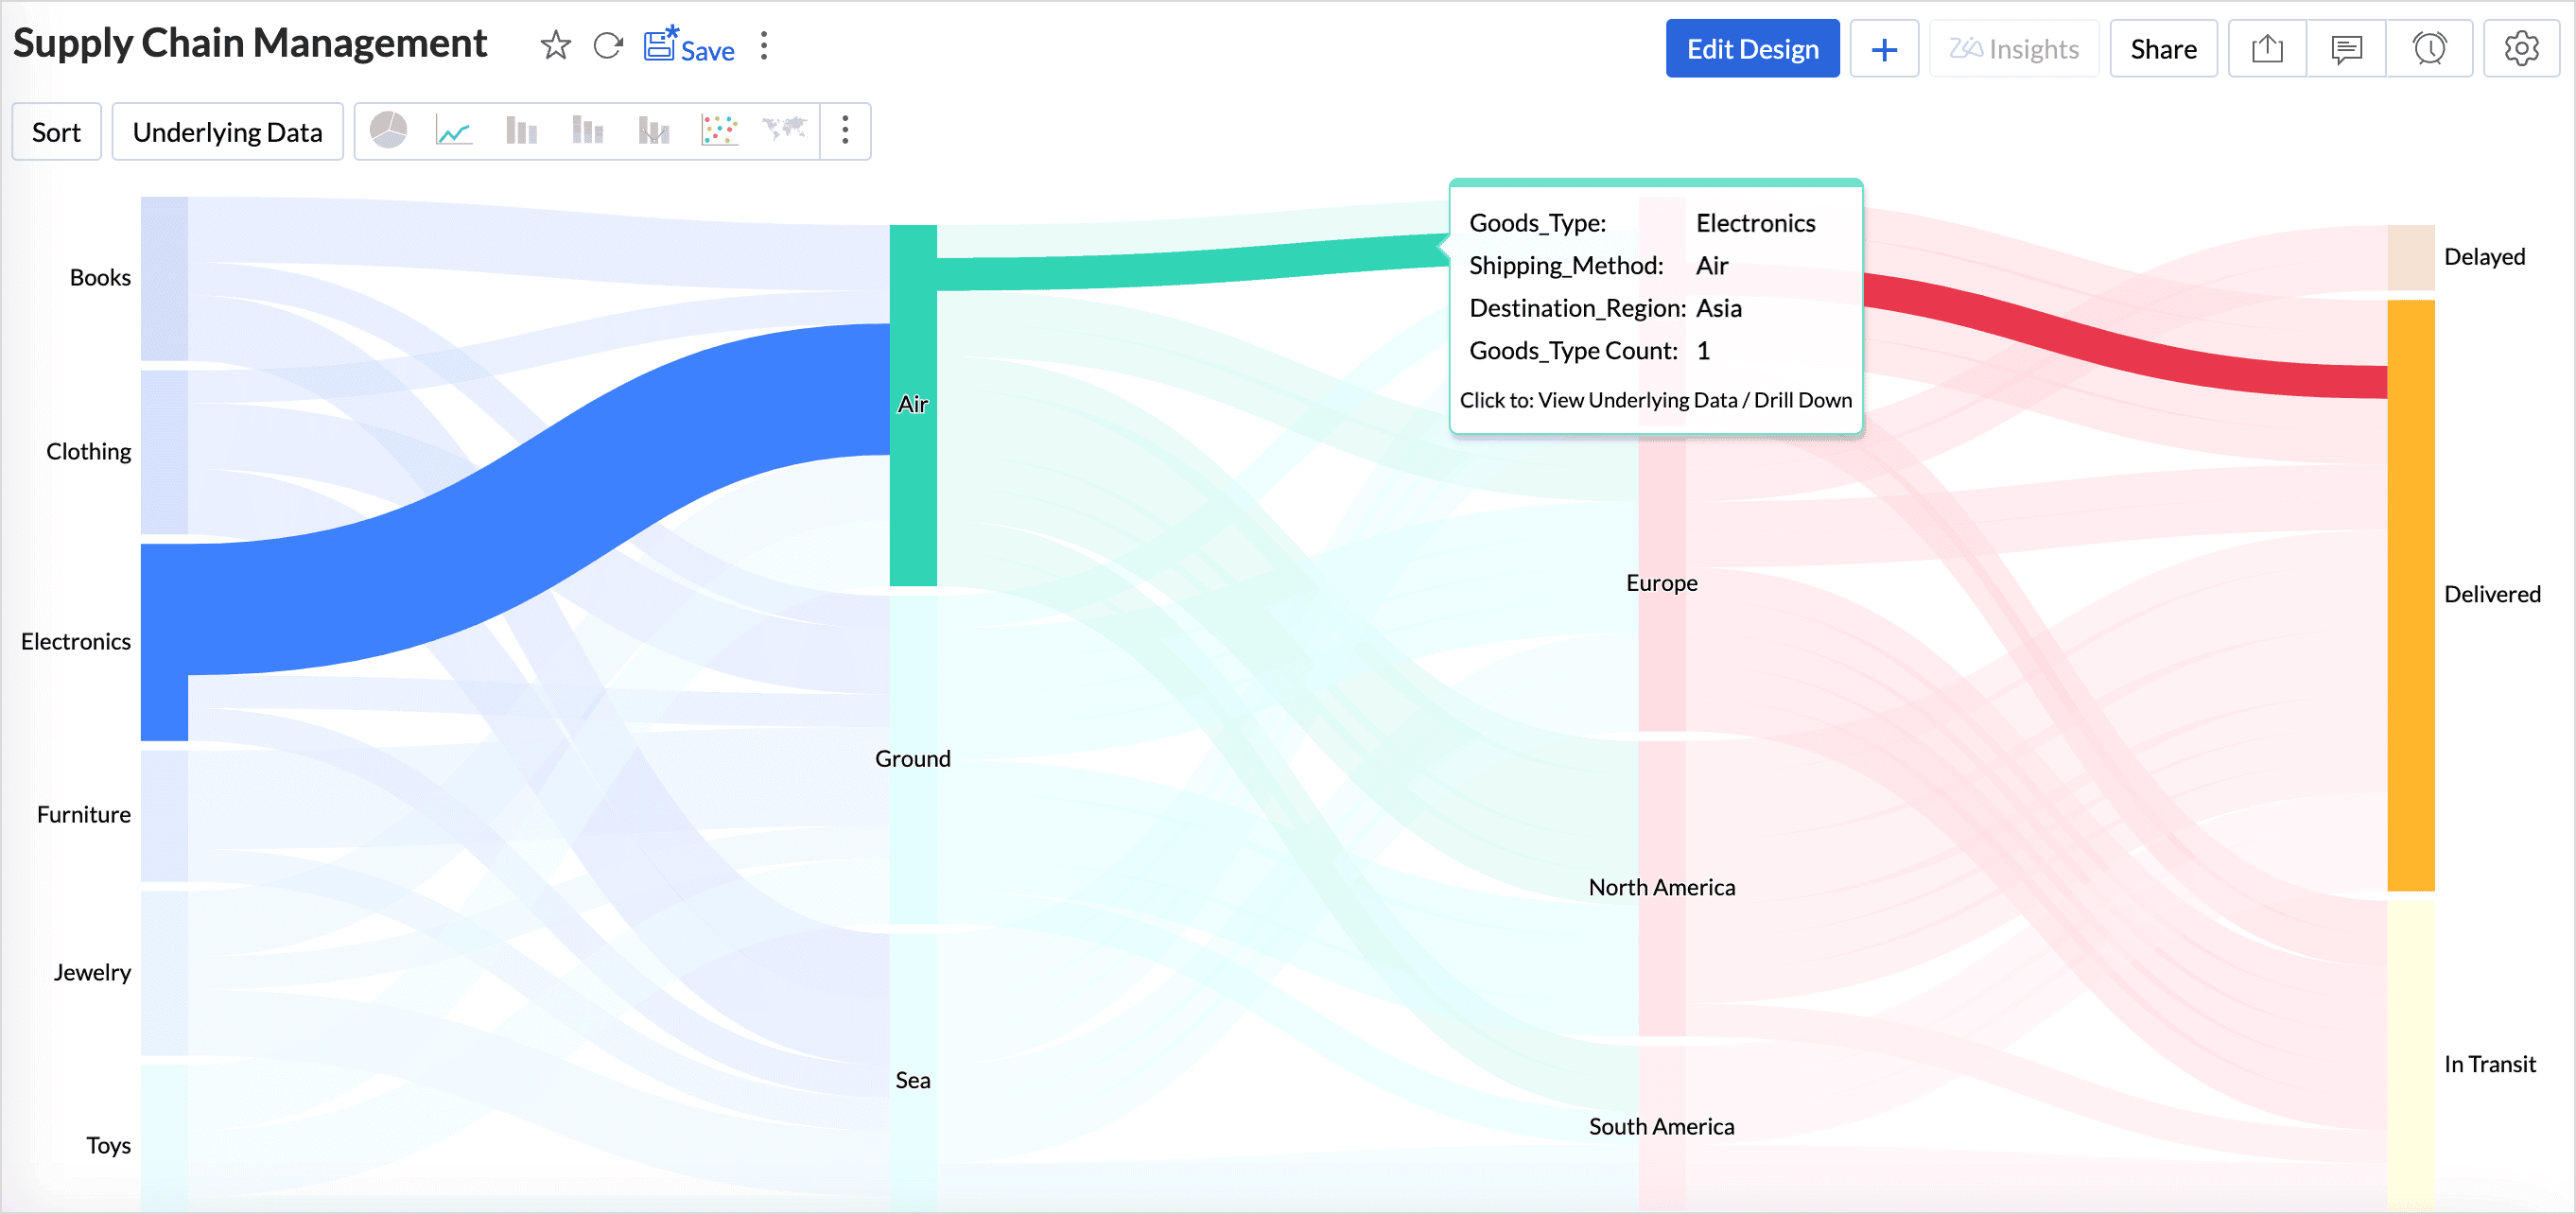
Click the More icon and choose the sankey chart type.
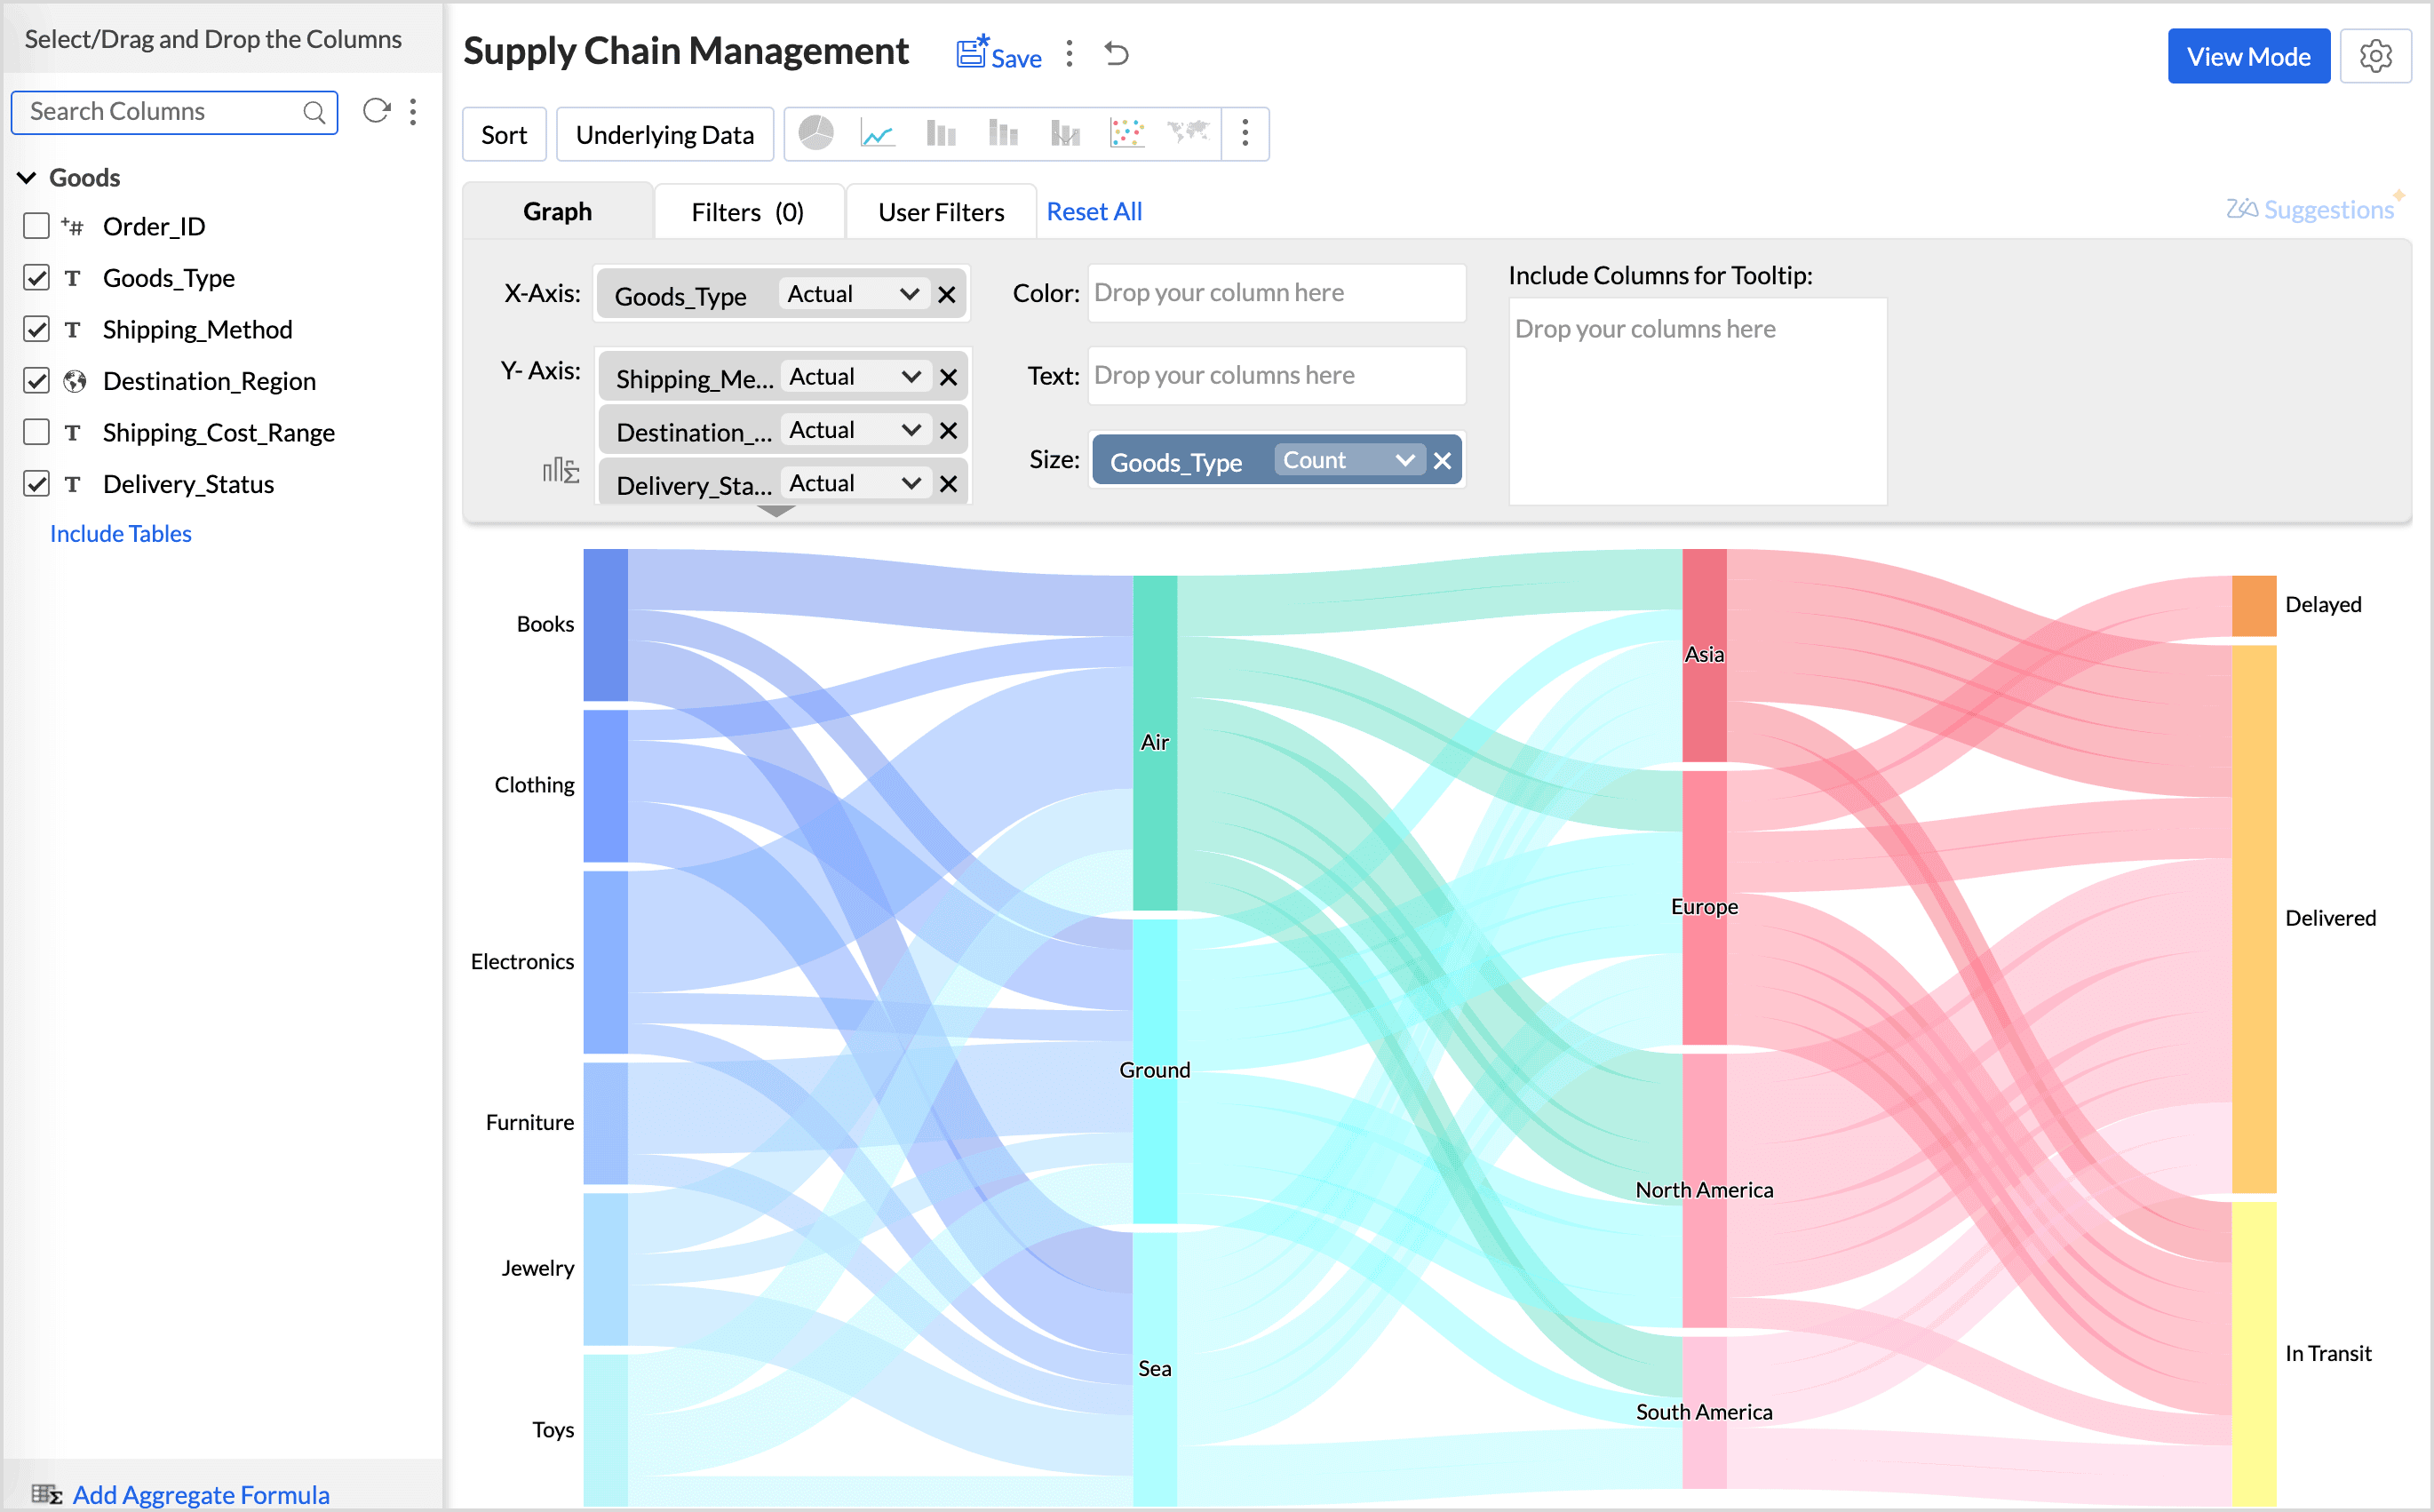
Hover over a data point in the Sankey chart to view the entire flow from the initial to the final node.
Customizing an Alluvial Sankey Chart
Zoho Analytics offers extensive options to customize any chart. This section explains the customization options specific to sankey chart. Refer to the Customizing Charts article to learn more.
- Click the Settings icon in the top right corner.
- Click the Sankey option.
- The Node Color option helps you customize the color that should be applied for the chart.
- Level Coloring applies a unique color to each stage (or level) in the flow. Each vertical section or level of nodes is colored differently to represent the flow through the various stages. This helps differentiate between the phases and makes it easier to track how elements move from one level to another.
- Node Coloring applies specific colors to individual nodes. This helps highlight key nodes and can be used to differentiate nodes within the same level.
- The Enable Tint option applies a unique color scheme, often by adding a slight shade or gradient to the existing colors. This can be done to highlight certain elements while keeping the overall flow readable.
- The Link Color option helps customize the color that should be applied to the interconnecting links or lines.
- Source applies the color of the initial node to the links.
- Destination applies the color of the terminal node to the links.
- Gradient gradually transitions from the source node color to the destination node’s color.
Possible Combinations
| X-axis | Y-axis | Color | Text | Size | Tooltip | |
| Case 1 | Dimension | Dimension | - | Aggregate/Measure | Aggregate/Optional | Aggregate/ Measure/ Optional |
| Case 2 | Dimension | Dimension | - | Aggregate/Measure/ Optional | Aggregate | Aggregate/ Measure/ Optional |
Case 3 | Dimension | Dimension | - | Aggregate/Measure/ Optional | Aggregate/Optional | Aggregate/ Measure |