Cluster Analysis
Grouping data points helps understand relationships and makes data interpretation easier. Cluster Analysis is a method used in data analysis to group similar data points based on certain factors or similarities across multiple measures and dimensions. Each cluster contains data points that are more similar to each other than to those in other clusters.
Zoho Analytics leverages advanced machine learning models like K-means, K-modes, and K-prototype for cluster analysis.
On this Page
- Business Use Cases
- Points to Note
- How to Perform Cluster Analysis in Zoho Analytics?
- Cluster Analysis Information
- Clustering Models
- Export Cluster Analysis Reports
Business Use Cases
Market Segmentation: Cluster analysis helps businesses understand their customer base by segmenting it based on different characteristics, such as purchasing behavior and demographics, allowing them to create targeted marketing strategies and personalize recommendations.
Social Network Analysis: By analyzing web logs, cluster analysis can reveal common behavior patterns among users, such as navigation paths, popular content sequences, or exit pages. These insights help optimize site structure and improve user experience.
Credit Risk Analysis: Cluster analysis can help financial institutions like banks group their customers based on their credit scores, income levels, and age to assess the risk levels and determine the appropriate loan limits.
Points to Note
- A minimum of five data points are required for cluster analysis.
- Cluster Analysis is supported for scatter plots, bar charts (horizontal and vertical), and bubble charts.
- Cluster Analysis is not supported with Forecast, Trend line, and Anomaly analysis.
How to Perform Cluster Analysis in Zoho Analytics?
- Drag and drop the required columns into the report builder.
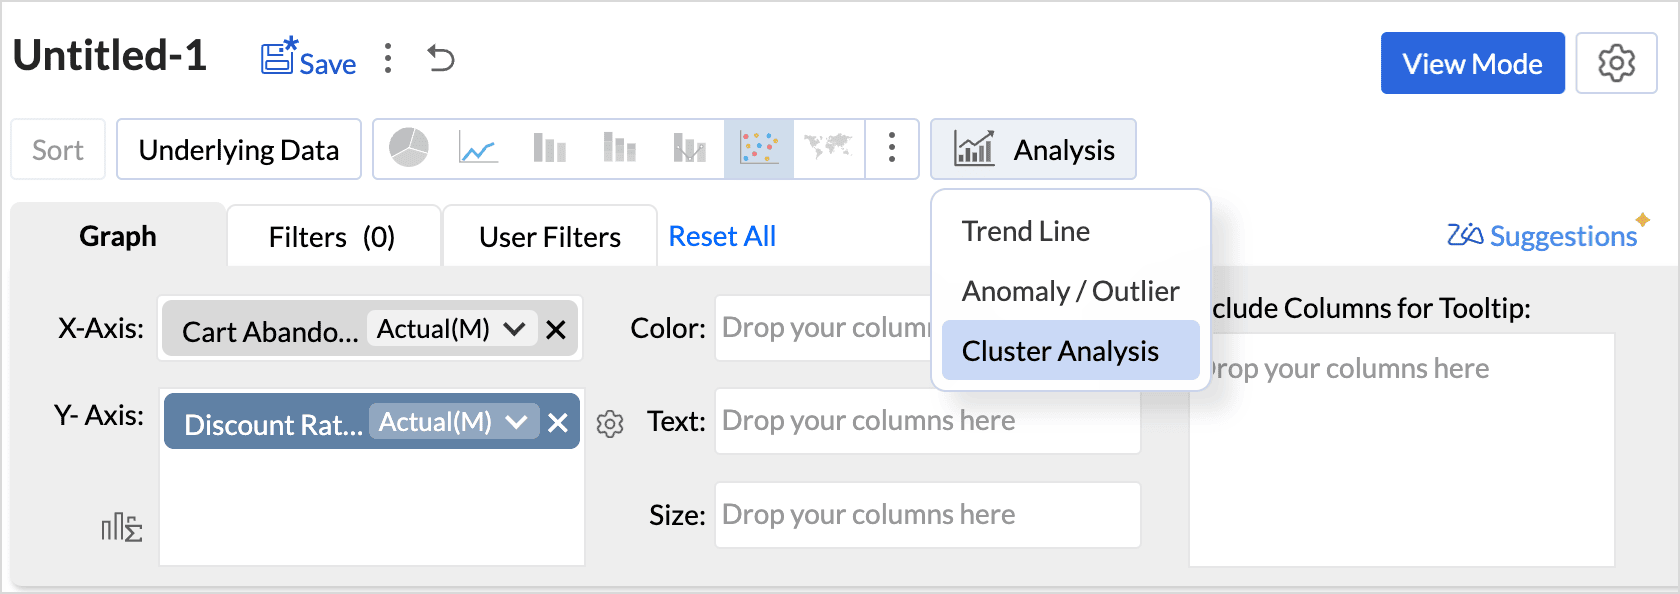
- Click the Analysis icon in the tool bar and select Cluster Analysis from the drop-down menu.
(or)
Click the Settings icon on the top right and access the Analysis tab.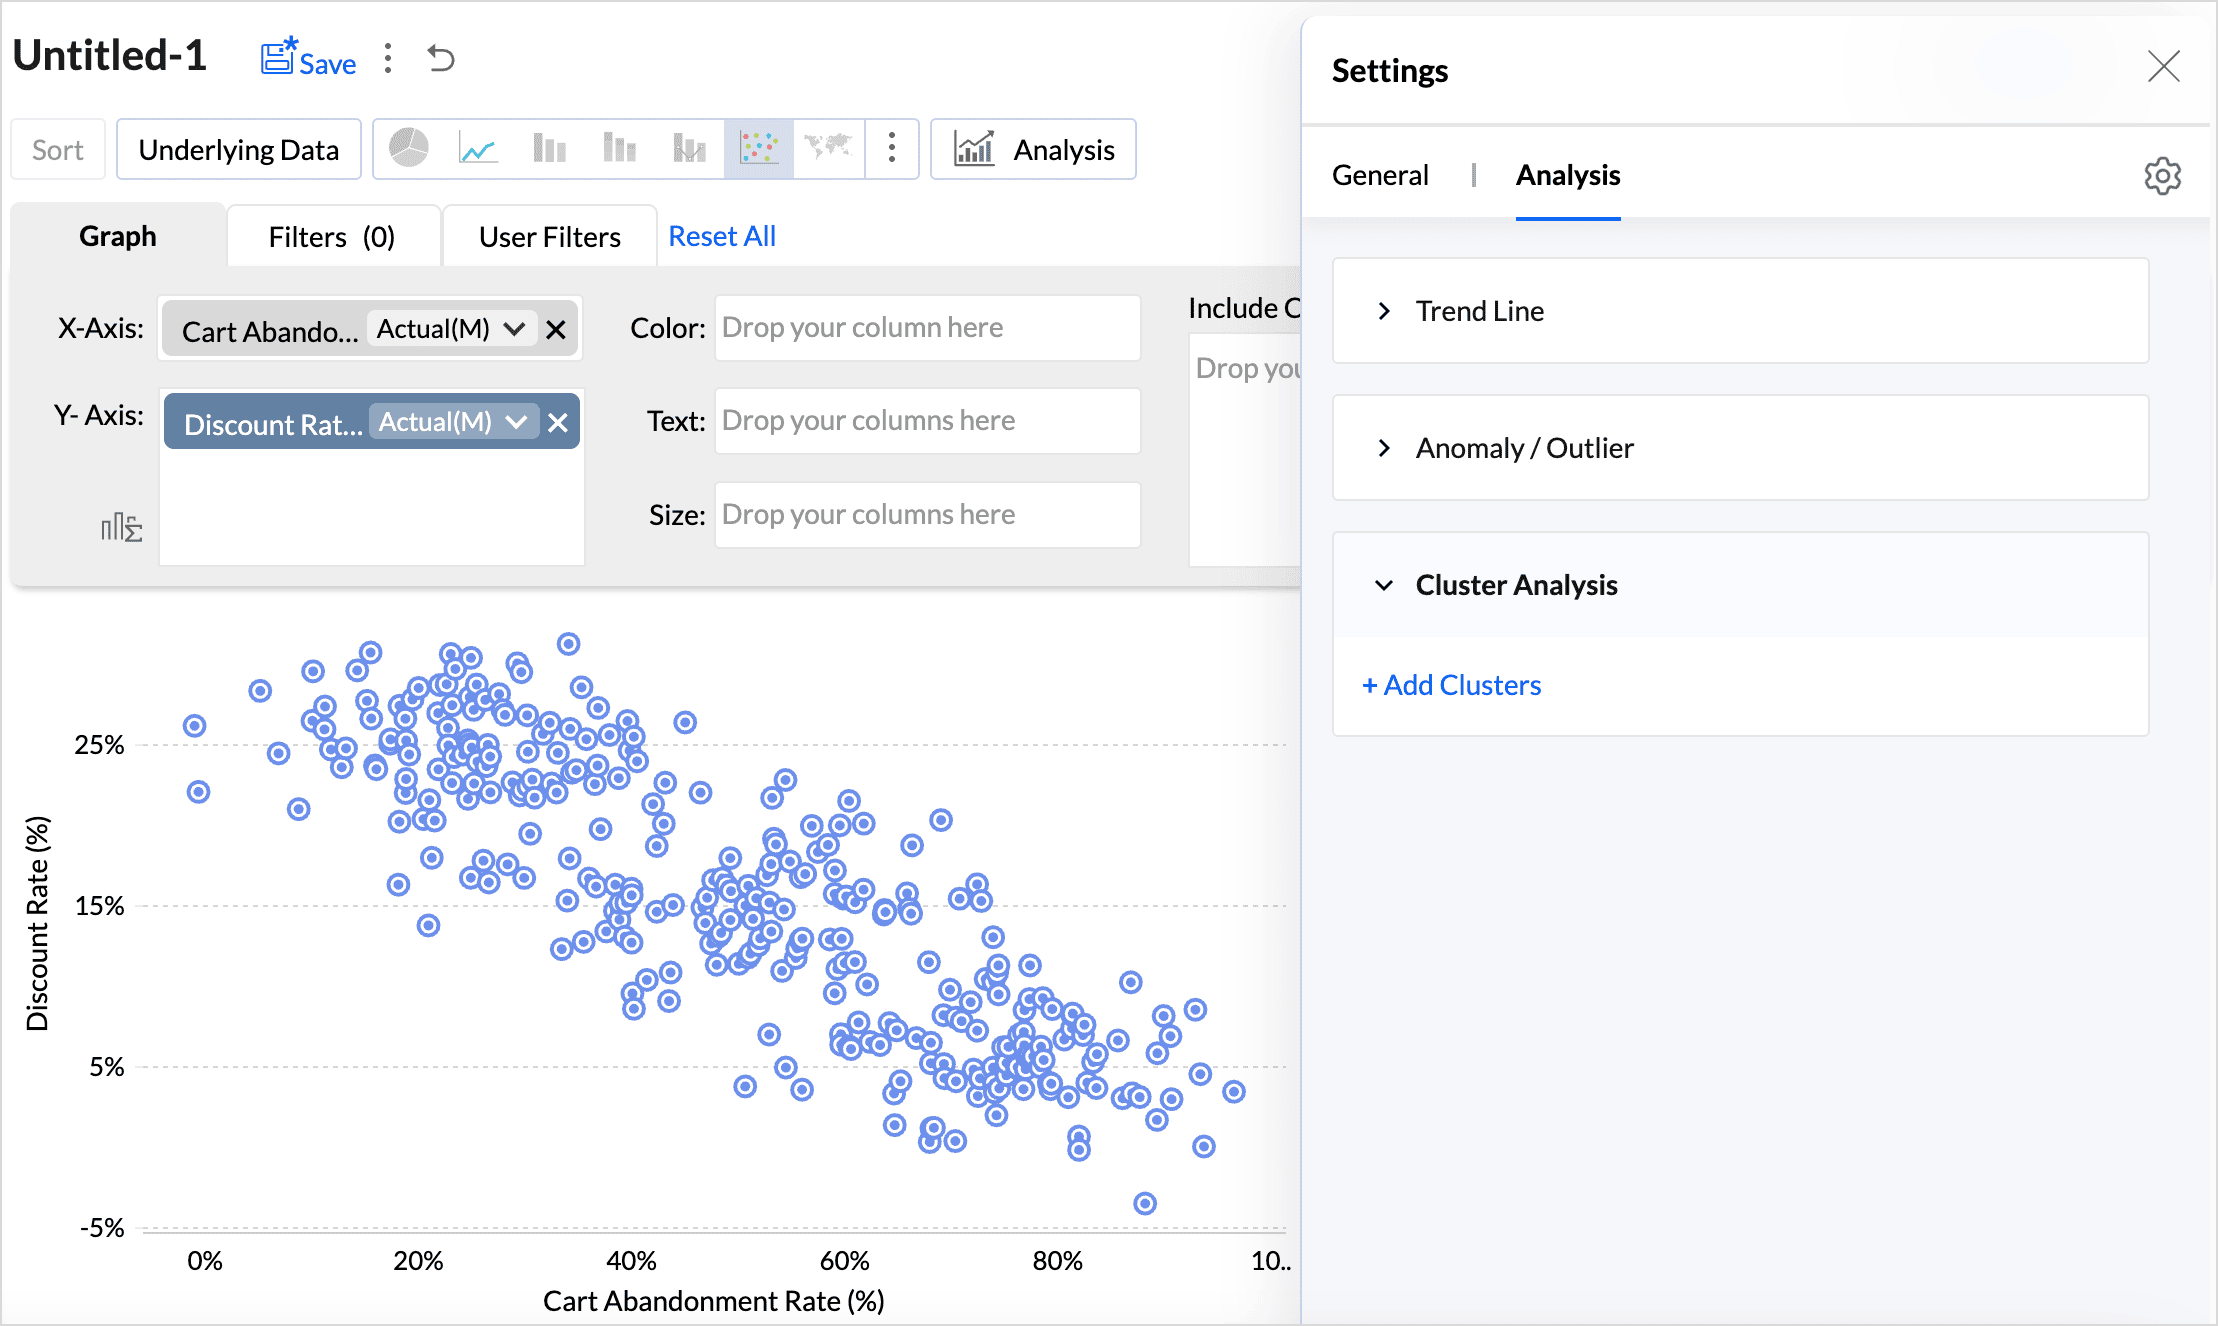
- Click Add Clusters.
- The Model is auto selected based on the columns used in the report. (You can also choose the model that should be used for clustering.)
- Factors are the columns or conditions based on which the data points are grouped. At least one factor is required for cluster analysis, and up to 20 factors can be used.
- Factors are listed based on the model selected for analysis. Refer to the Clustering Models section to learn more
- All the Measure columns and the Dimension columns with the Count function will be listed for the K-means model, as the data points are grouped based on the Euclidean distance.
- All the Dimension columns are listed for the K-modes model, as the data points are grouped based on the binary distance.
- Both Measure and Dimension columns are listed for the K-prototype model as the data points are grouped based on both Euclidean distance and binary distance.
- Choose the Number of Clusters into which the data points should be grouped. The Number of Clusters is set as three by default. This can be changed as per the requirements. A minimum of 2 clusters and a maximum of 30 clusters can be specified for clustering. Ensure to consider the number of data points while deciding on the number of clusters. The total number of clusters should be at least one less than the number of data points.
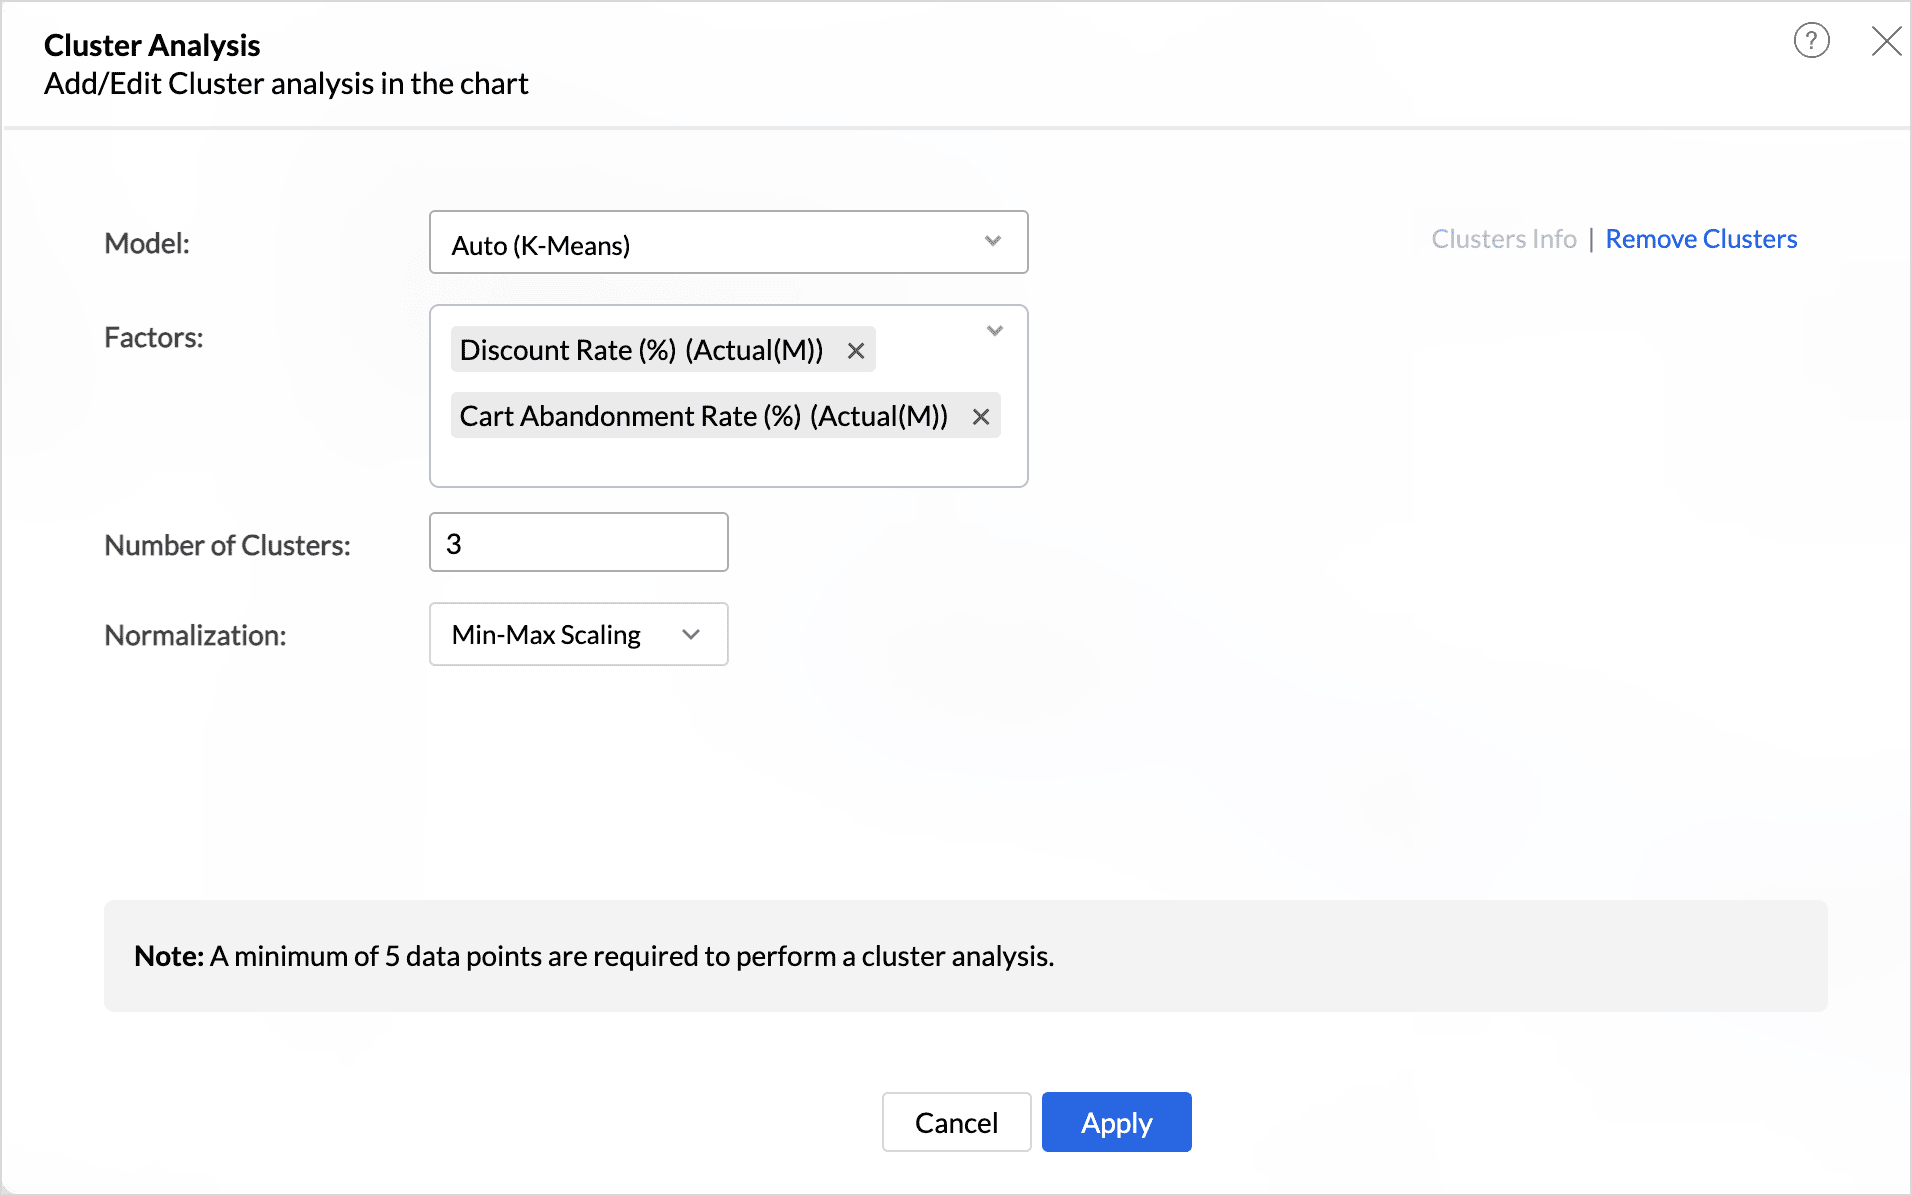
- Choose the Normalization method that should be used to transform the data before clustering. This is done to prevent factors with large ranges or different scales from dominating the results, ensuring that all factors contribute equally to the analysis. Normalization is the technique used to transform the data to have a common scale.
- Min-Max Scale - In this method, all the data points are rescaled between the ranges of 0 and 1.
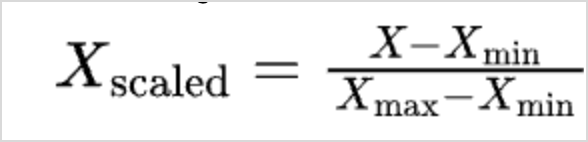
Where, X is the current value
Xmin is the minimum value in the data
Xmax is the maximum value in the data Z-Score -represents the number of standard deviations a data point is from the mean of the dataset. This transformation is designed to center the data around a mean of 0 and standardize it so that the standard deviation is 1 for the entire dataset.
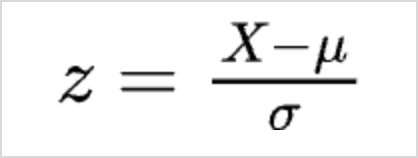
Where,
X is the current value
µ is the mean
σ is the standard deviation
- Min-Max Scale - In this method, all the data points are rescaled between the ranges of 0 and 1.
- For the K- prototype model, specify the Weightage to be given for numerical and categorical factors. The weightage values range from 0.1 to 2. By default, Zoho Analytics gives equal weightage (1.00) to both numerical and categorical factors. Weightage value closer to 0.1 indicates, numerical columns will have more weightage, and value closer to 2 indicates, categorical columns will have more weightage.
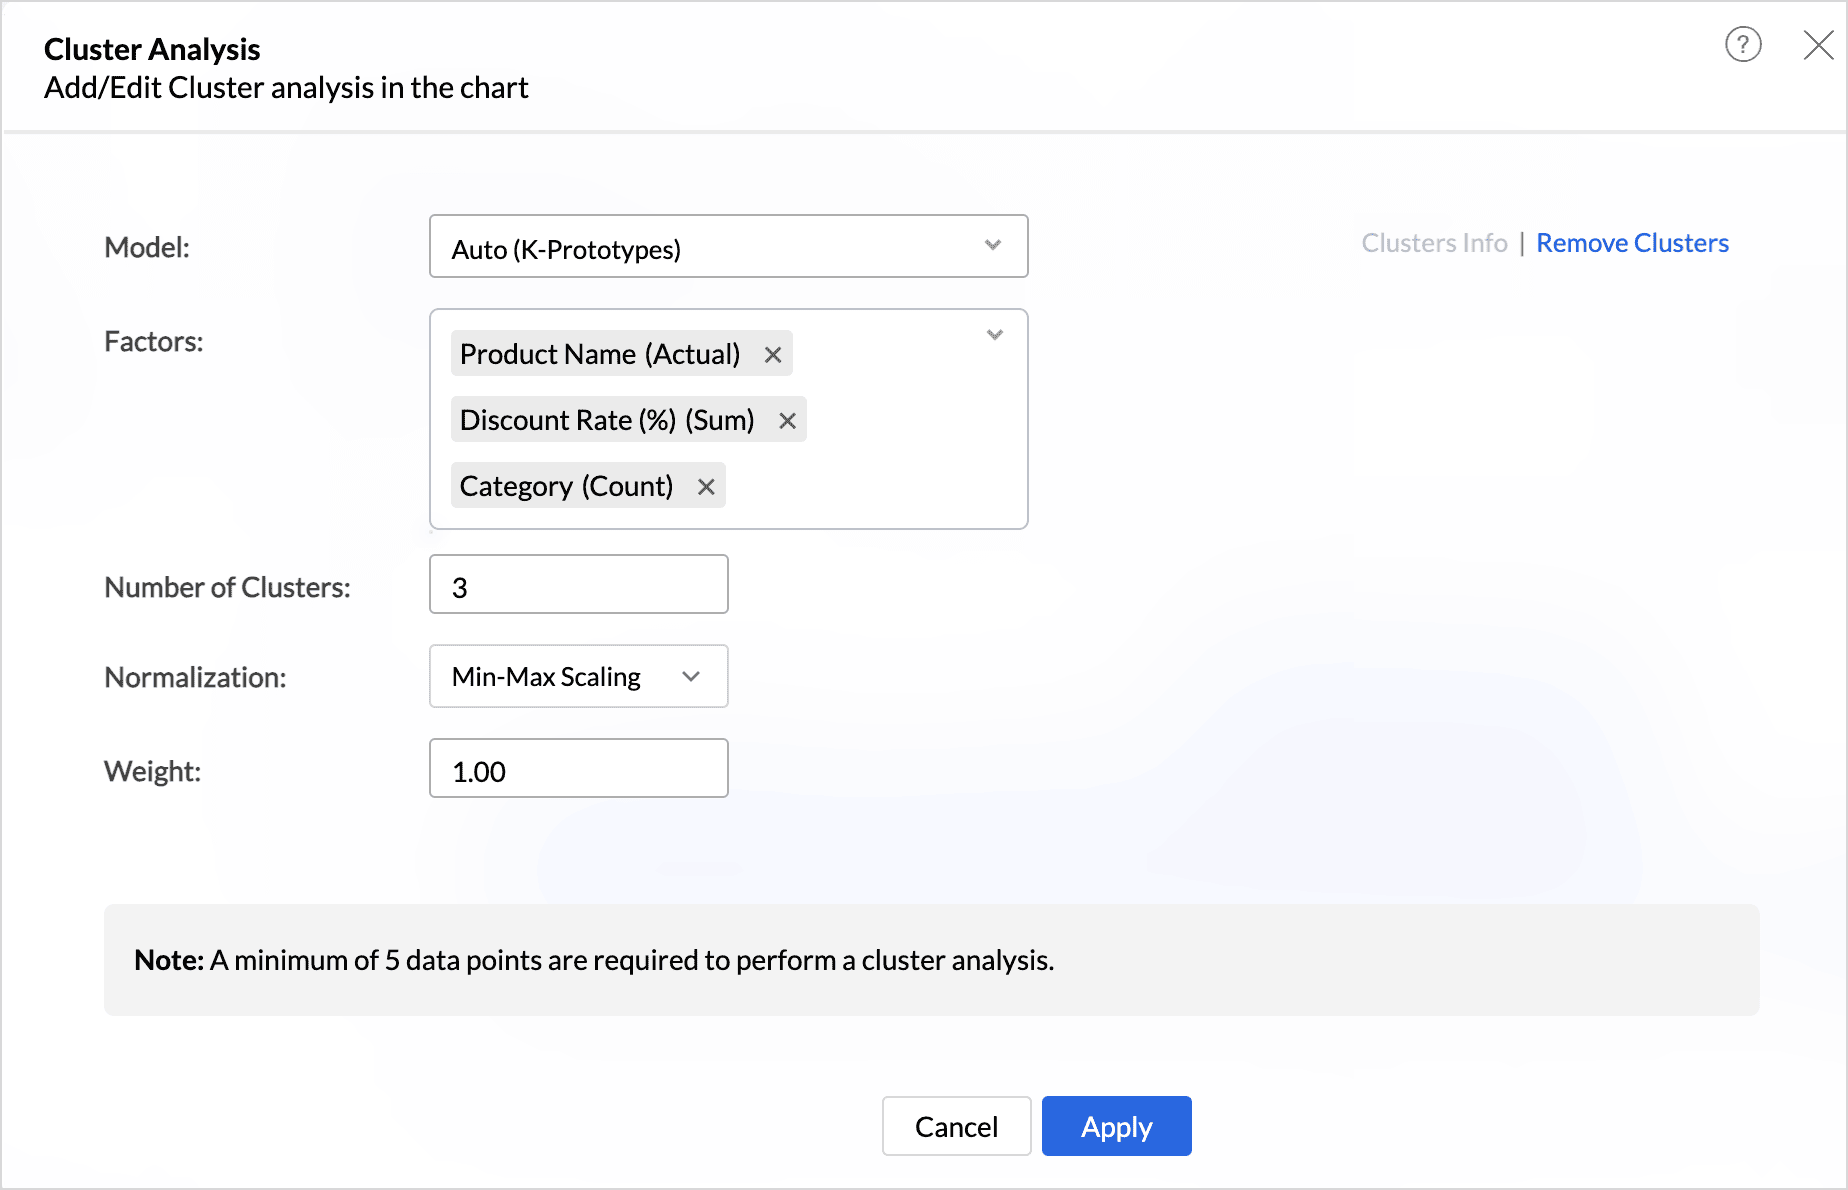
Click Apply.
Note: Rows with missing values are not considered for cluster analysis. Such data points are indicated in gray as Not Clustered in the legend.
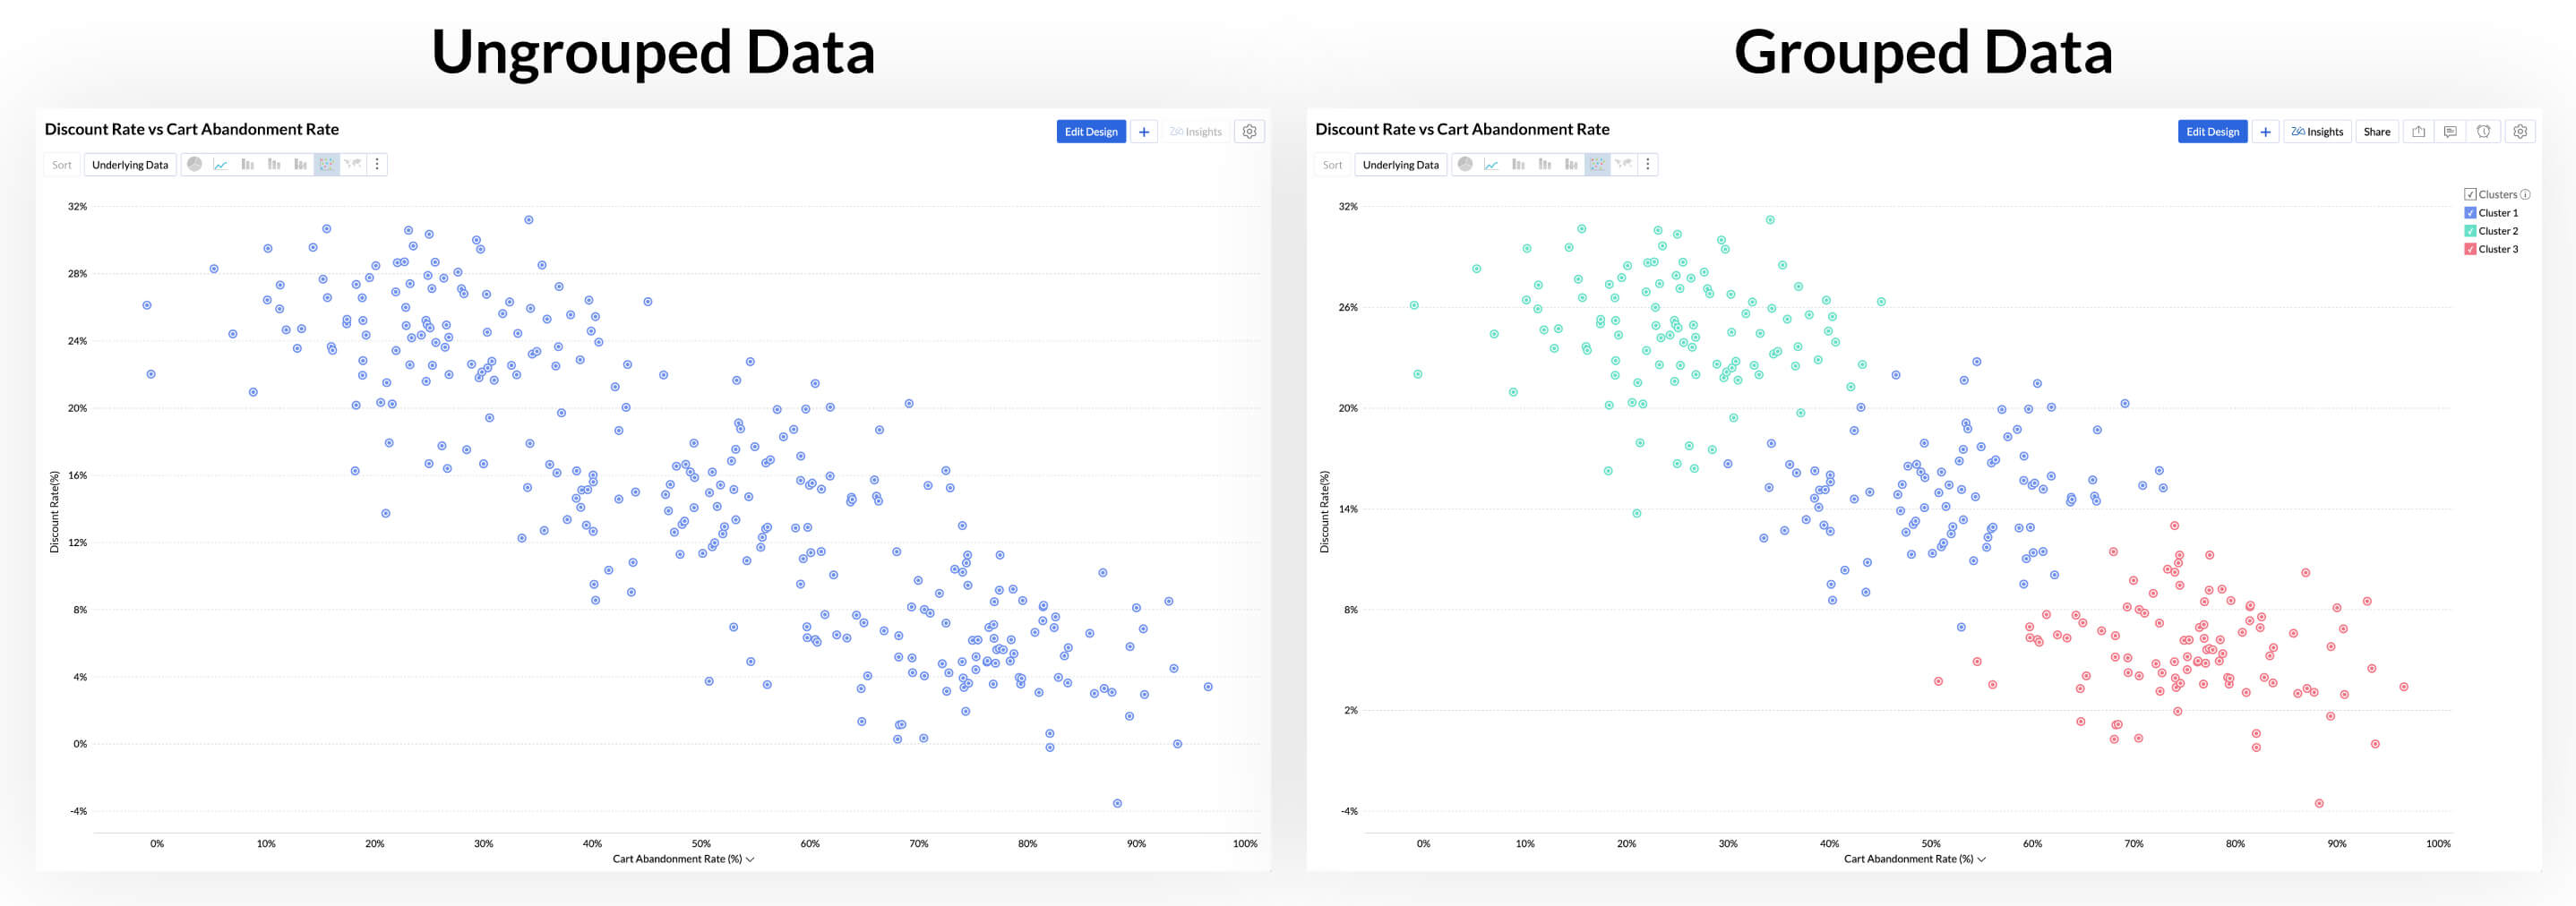
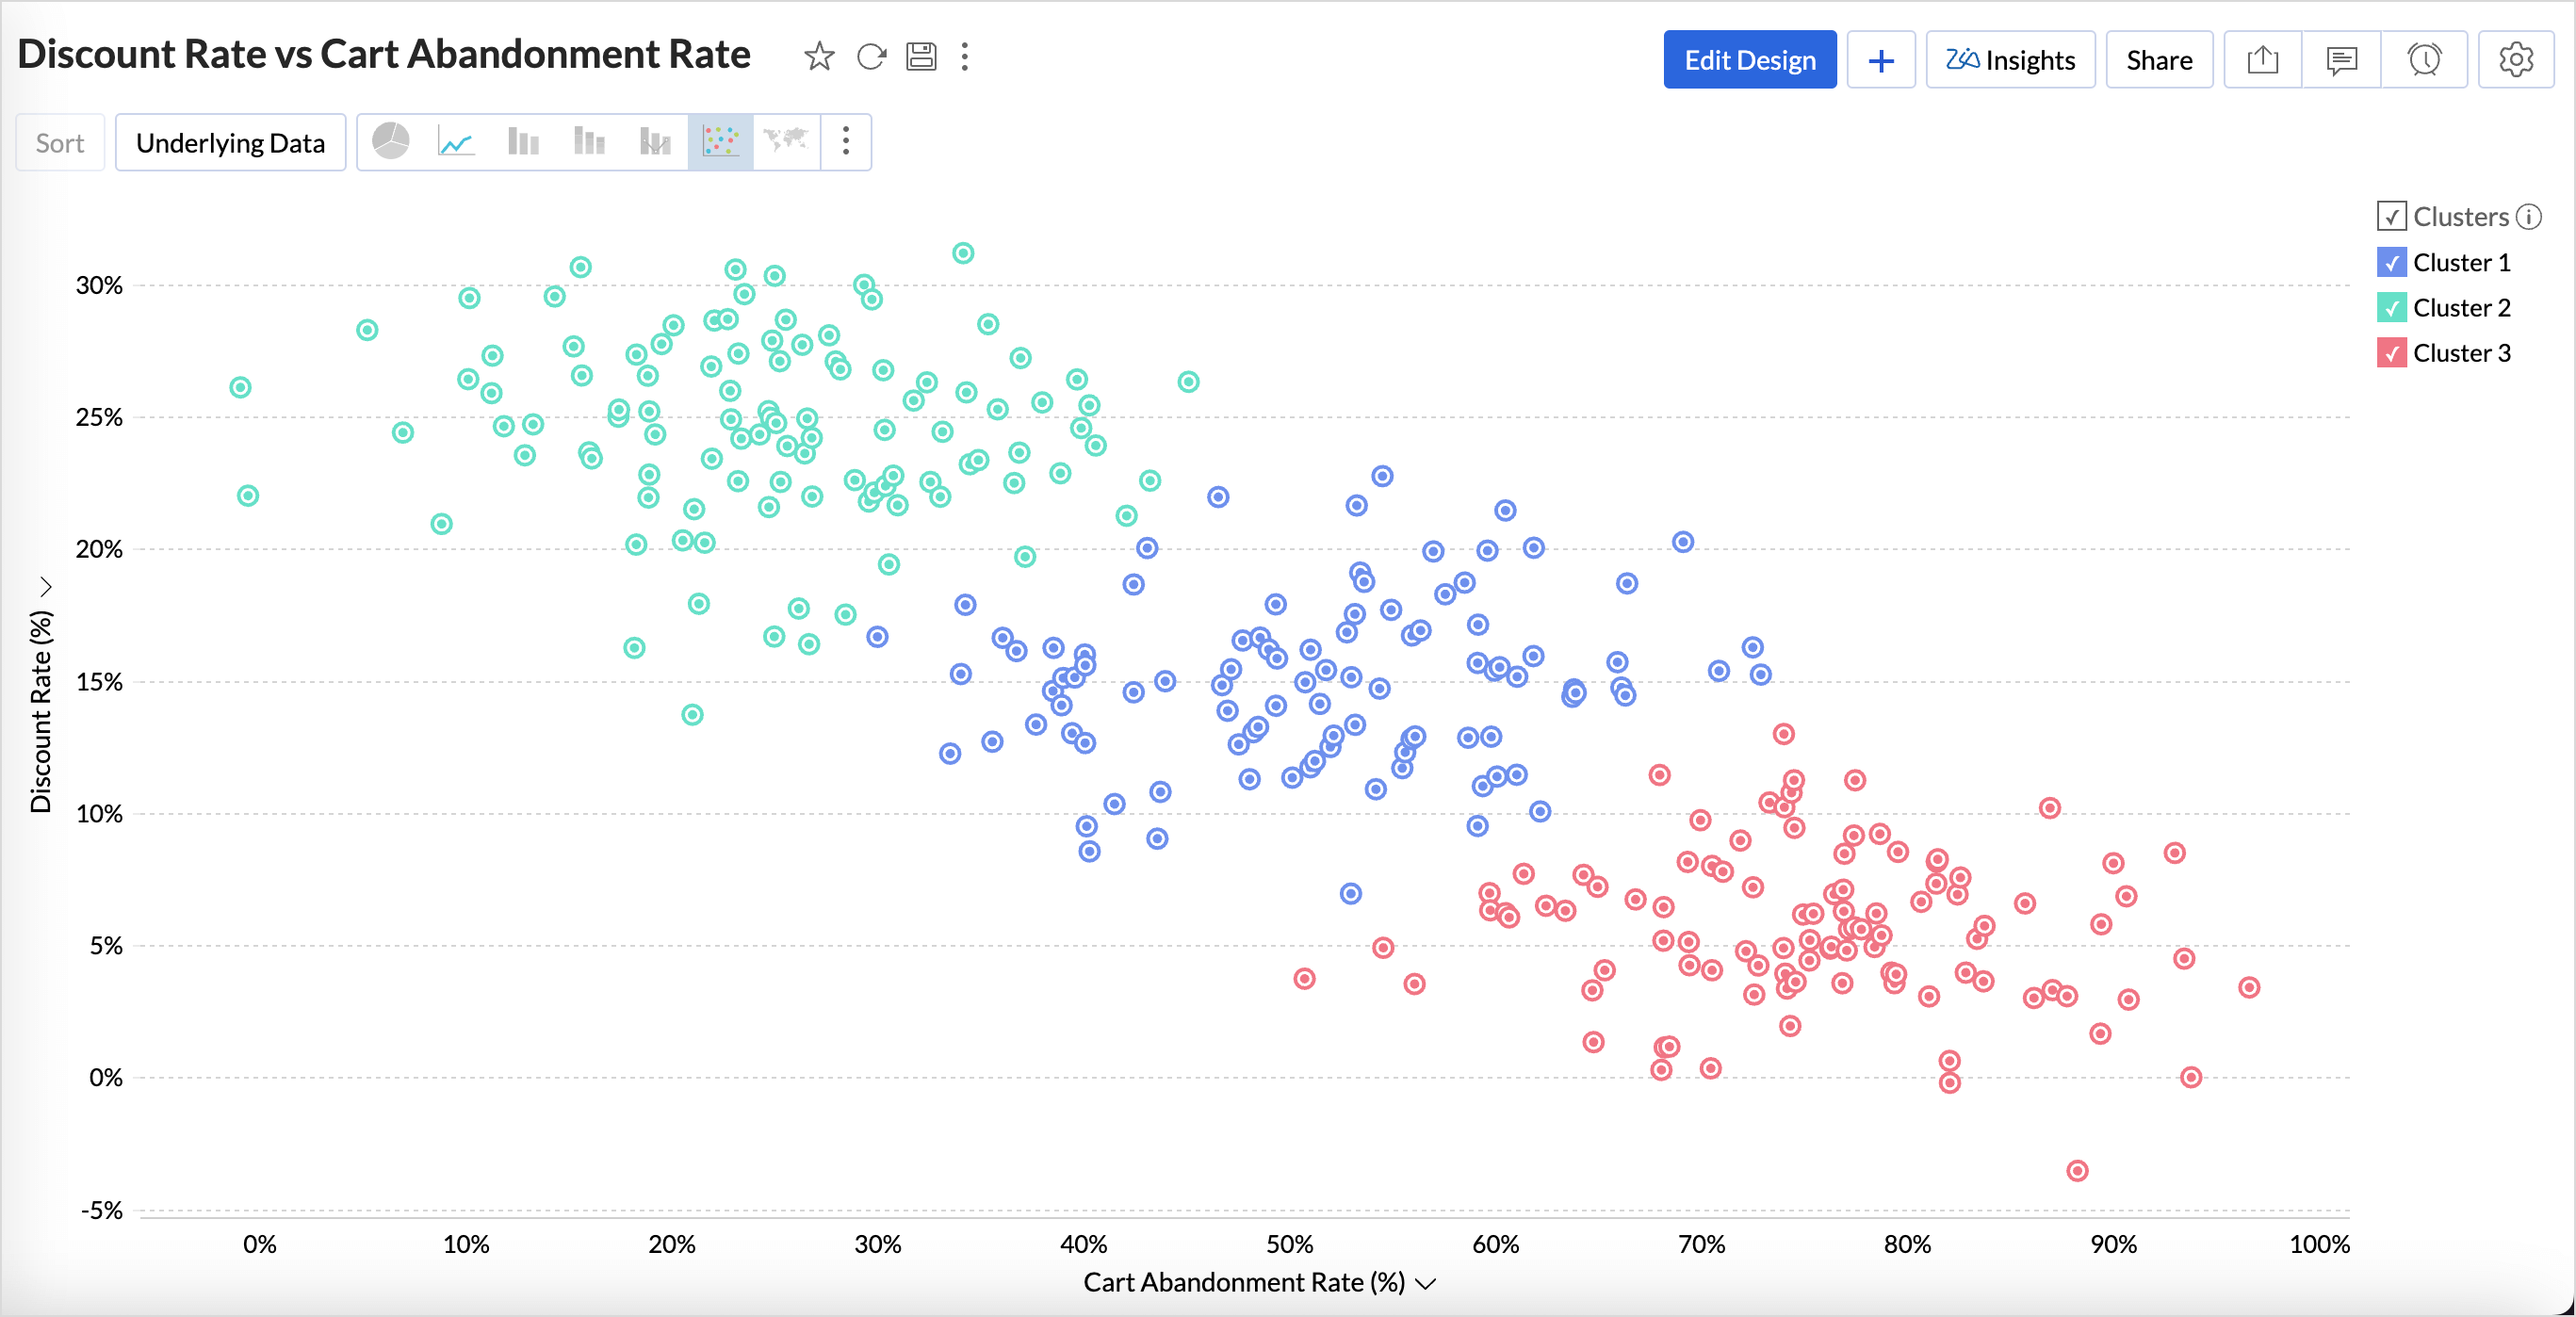
In the below image, the data points are clustered based on the K-means algorithm.
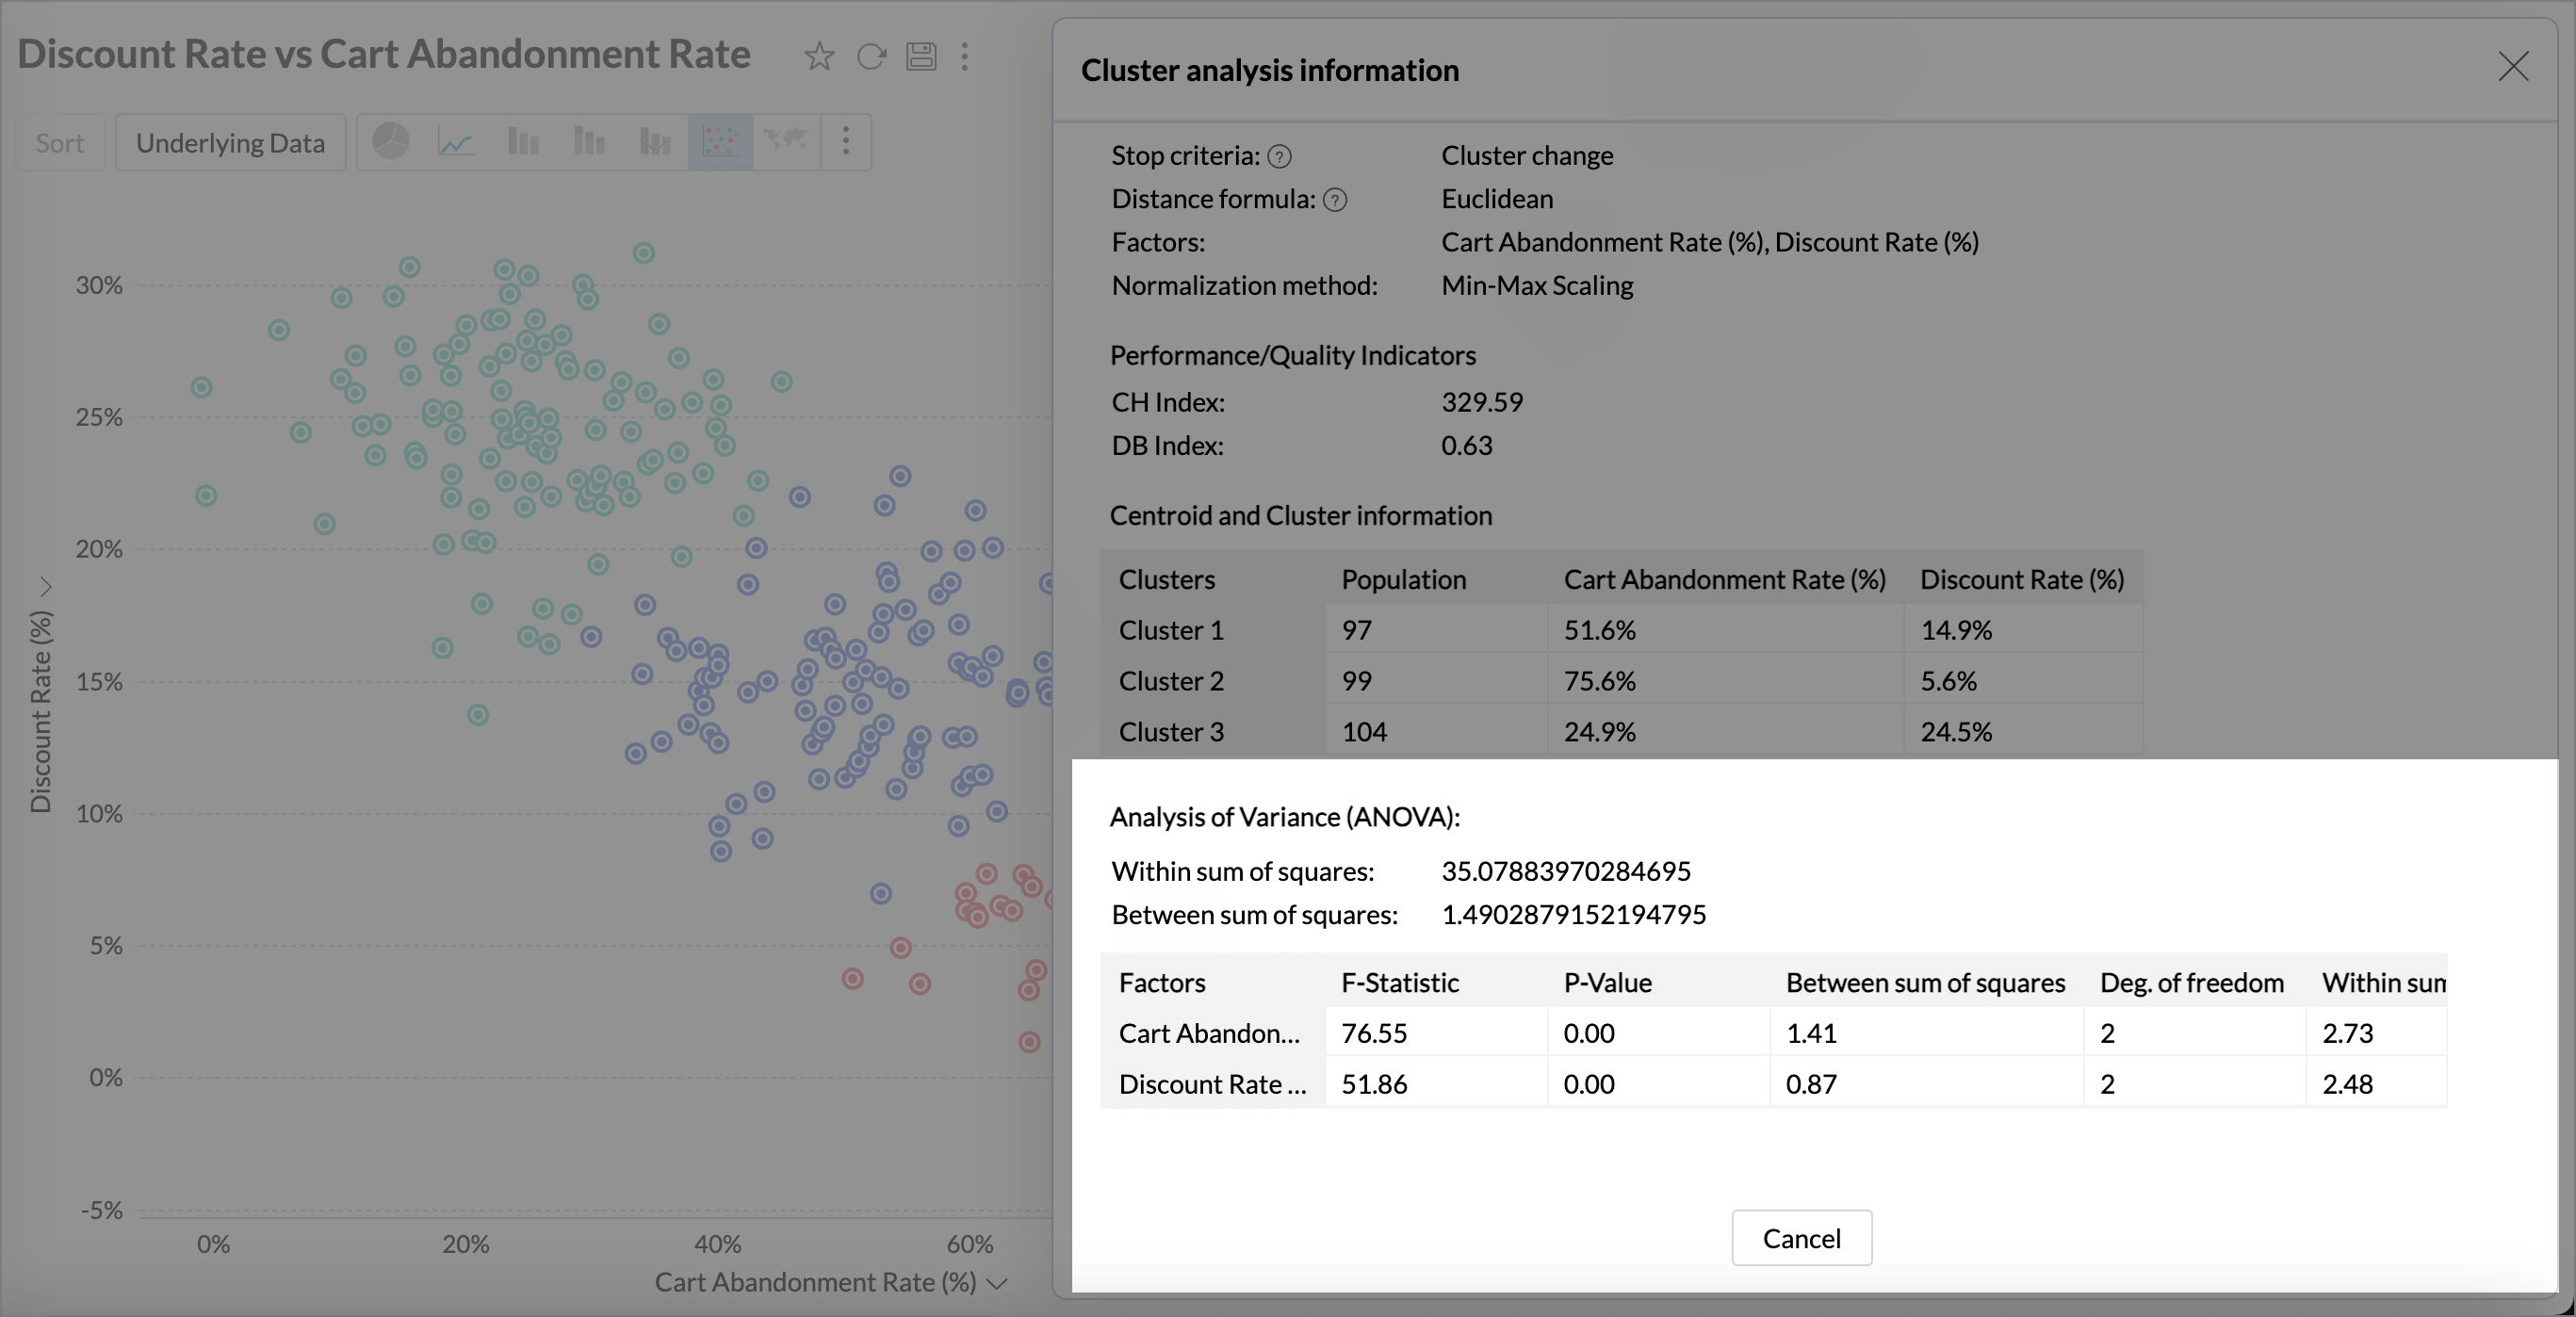
Cluster Analysis Information
This section provides the model used for cluster analysis and statistical information to evaluate the quality of the clusters. The Clusters Info option is enabled once the cluster analysis is applied to a report.
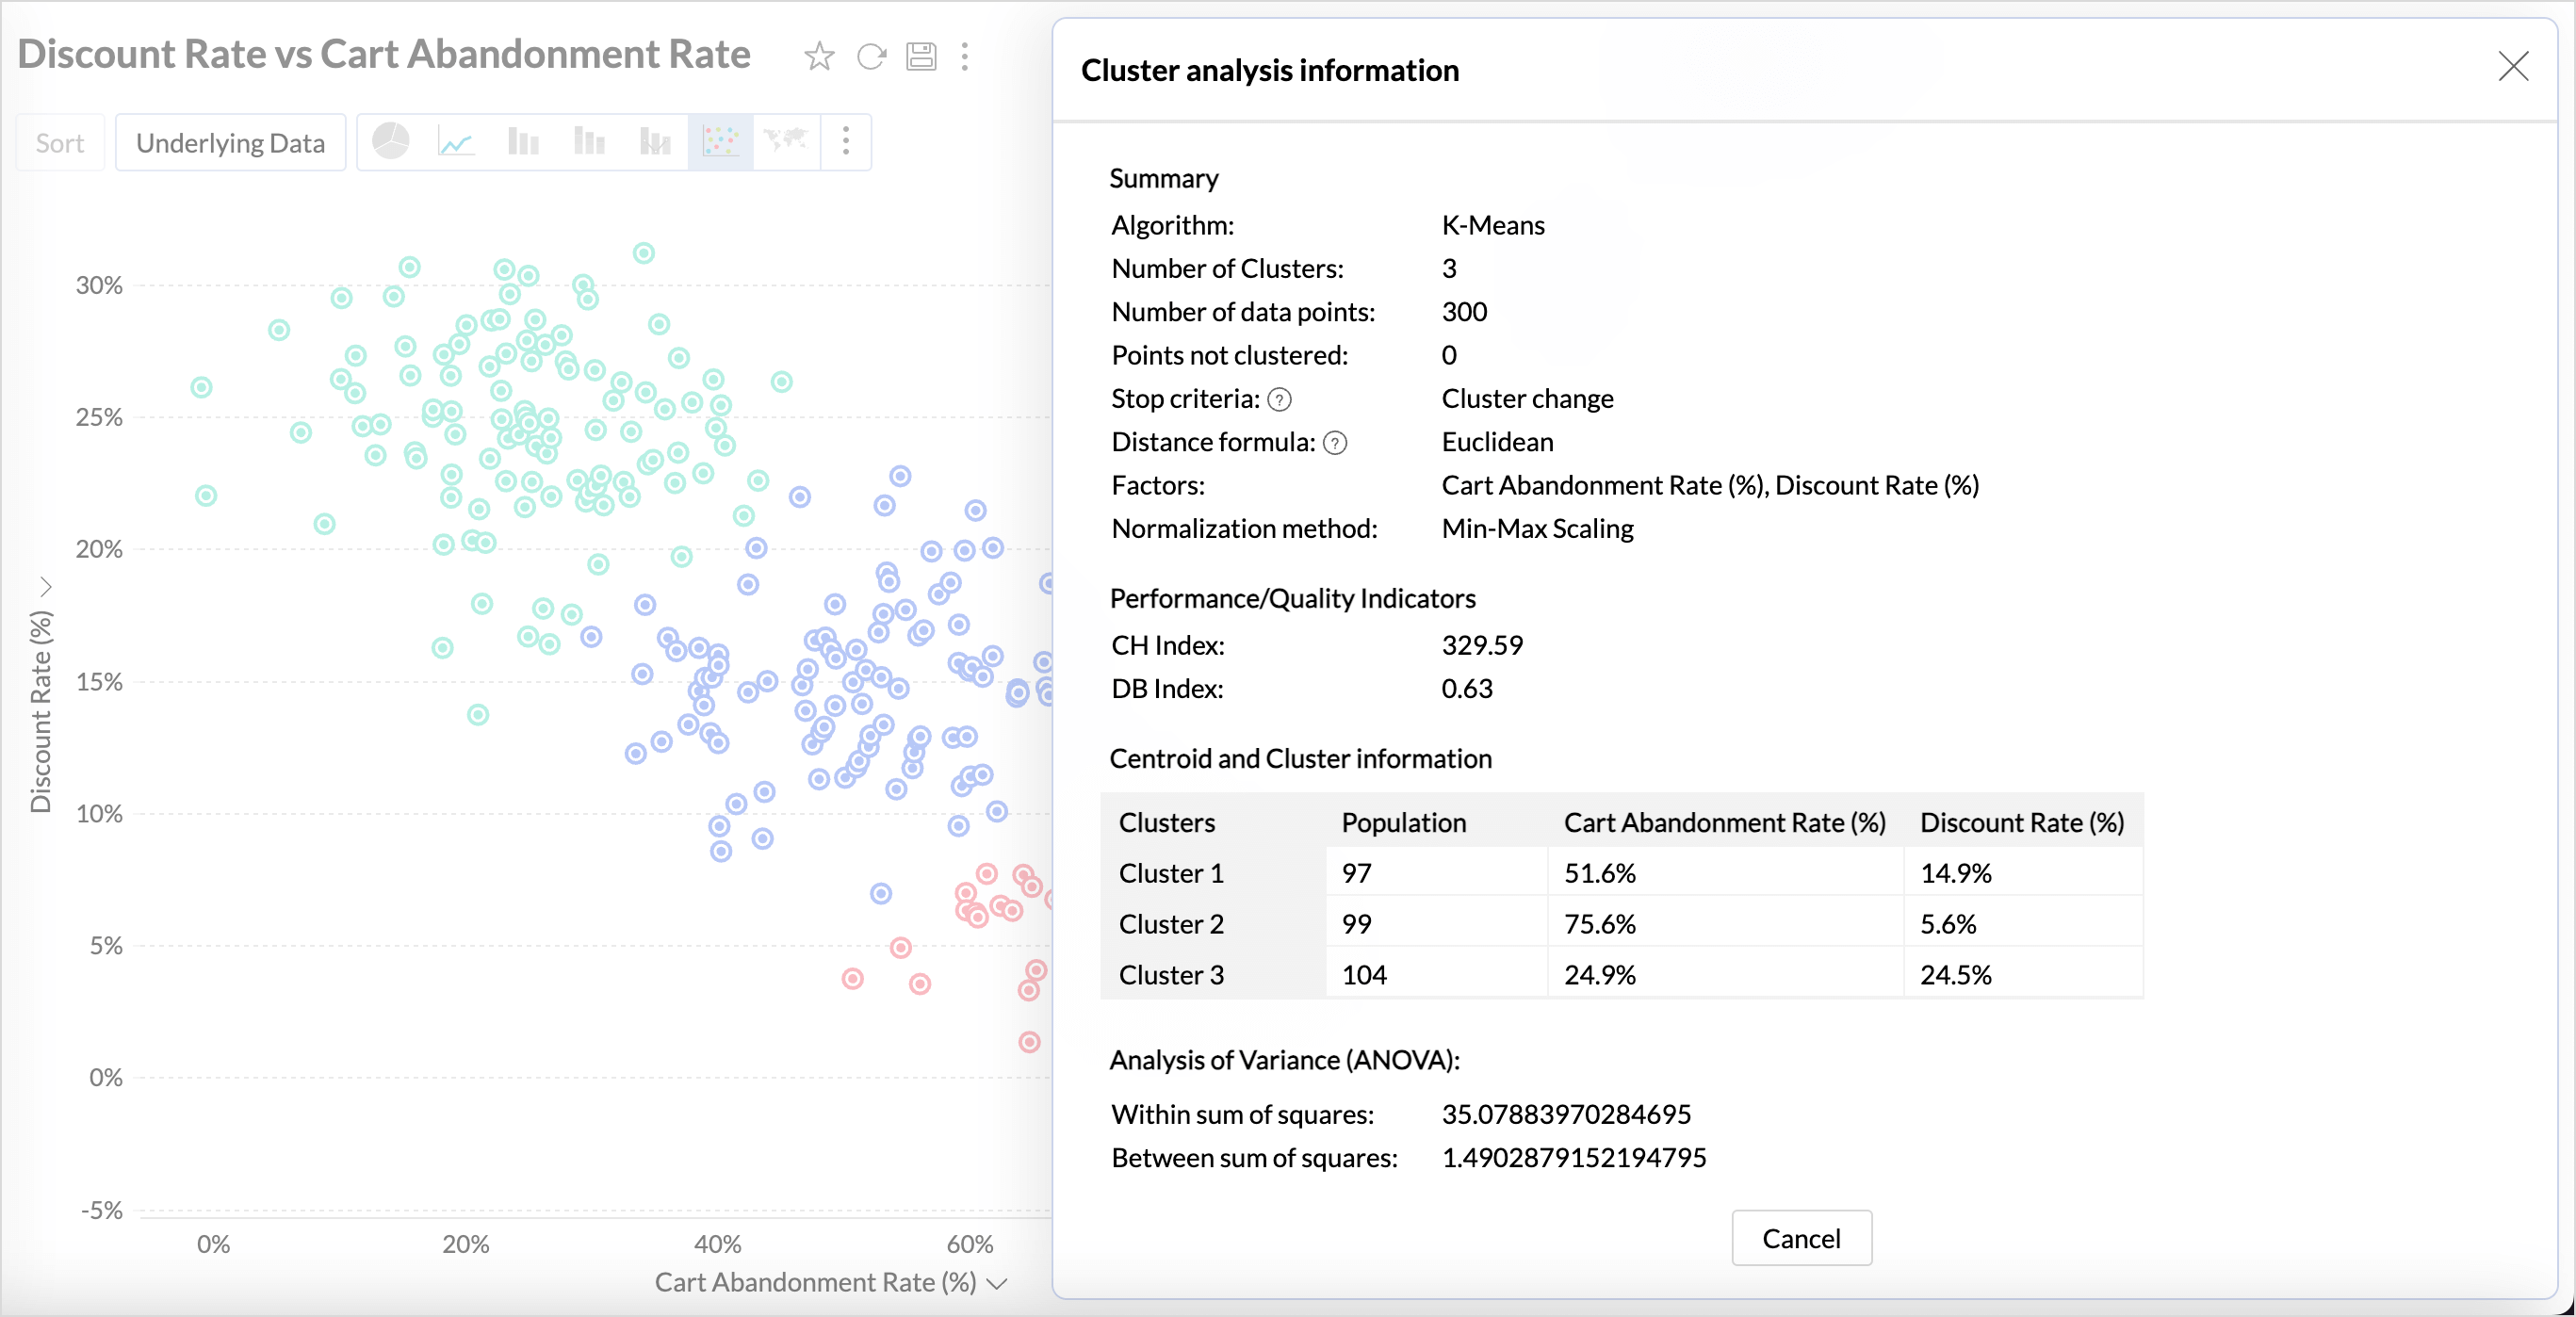
Summary
The Summary section lists the input details that were used to create clusters such as,
- The Model used for clustering,
- The total Number of Clusters created and the Number of data points.
- The Stop Criteria field gives the reason based on which the clustering process was completed. Cluster Change is the default method that is used in this process.
- The Distance formula that was used for clustering.
- Euclidean distance is the method used for the K-means algorithm.
- Binary distance is the method used for the K-modes algorithm.
- Euclidean and Binary distance is the method used for k-prototype.
- The Factors used for cluster analysis.
- The Normalization method applied for scaling the data.
Performance or Quality Indicators
What are the indicators of a high quality cluster analysis?
High Intra-cluster Similarity: Data points within each cluster are very similar to each other based on the chosen distance metric, resulting in tight, well-defined clusters.
Low Inter-cluster Similarity: Clusters are well-separated, with significant differences between data points in different clusters, indicating clear boundaries.
Zoho Analytics uses various statistical methods to evaluate the quality of clusters.
CH Index - The Calinski-Harabasz index (CHI) is a metric used to evaluate the quality of a cluster. The CHI calculates the ratio of between-cluster variance to within-cluster variance. A higher CHI value denotes that the clusters are well grouped.
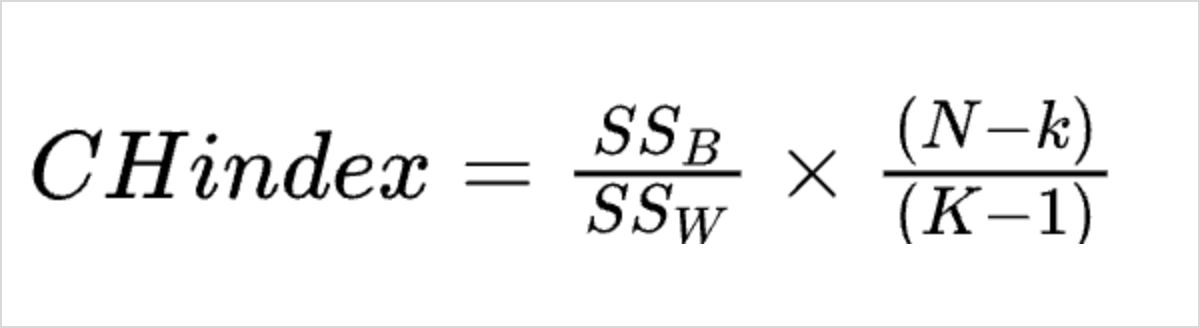
Where:
- SS B is the sum of squares between clusters
- SS W is the sum of squares within clusters
- n is the total number of data points
- k is the number of clusters
DB Index - The Davies-Bouldin index (DBI) is another metric to assess the quality of clustering. The DBI is calculated by considering the ratio of the average similarity between each cluster and its most similar cluster, to the average dissimilarity between the clusters.
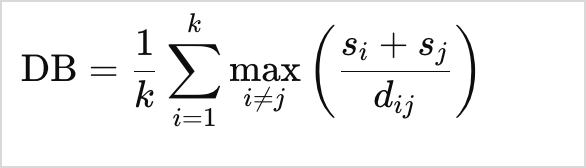
CHI Index and DB Index are calculated for the K-means and K-prototype clustering models.
Purity - In K-mode clustering, purity is a measure used to evaluate the quality of the clustering results. It assesses how well-defined and internally consistent the clusters are by comparing the dominant class labels within each cluster to the actual class labels in the dataset.
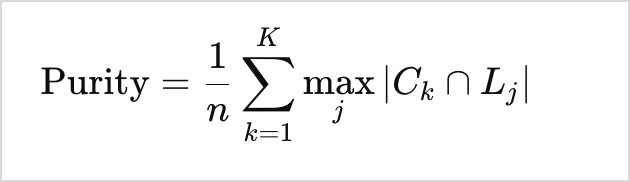
The purity score is given in percentage. A higher purity percentage strongly indicates that the clusters are well-defined.
The Purity indicator is calculated for K-modes and K-prototype clustering models.
Analysis of Variance (ANOVA)
Analysis of variance is calculated only for the K-means algorithm. ANOVA is used to evaluate whether the centroids (or means) of the clusters are significantly different from each other in terms of the values of the factors used for clustering. It is also a statistical significance test that is used to check whether the null hypothesis can be rejected or not during hypothesis testing.
- Within the Sum of Squares - It calculates how much the individual data points within each group differ from the mean of that group. This can be called the Mean Square between the Clusters (MSB).
- Between the Sum of Squares - It calculates how much the mean values of different groups differ from the overall mean value. This can be called the Mean Square within the Clusters (MSW).
- F- Statistic Value -The F-Statistic calculates the ratio of the Mean Square Between (MSB) the clusters to the Mean Square Within (MSW) the clusters. If the F-Statistic is greater than the critical value, we can conclude that the data points are well clustered.
- P- Value - It helps to decide whether the differences between groups are likely to have occurred by chance or if they are statistically significant.
Factors | F-Statistic | Between the Sum of Squares | Degrees of Freedom (between) | Within the Sum of Squares | Degrees of Freedom (within) |
Columns used for clustering | MSB/MSW | Calculates the difference between the means across different clusters A large value indicates that the data points are well clustered and there is no overlapping. | k-1 The between-group degrees of freedom is calculated based on the number of clusters (groups) being compared. | Calculates the difference between the means within each cluster | N-k The within-cluster degrees of freedom is calculated based on the number of observations within each cluster and the number of clusters. |
Clustering Models
Cluster Analysis partitions the data points into clusters or groups using specific models or algorithms. Each cluster contains data points that are more similar to each other than to those in other clusters.
The models used for clustering depends on the factors or the conditions used for the analysis. K-means, K-modes, and K-prototypes are the models used for clustering in Zoho Analytics.
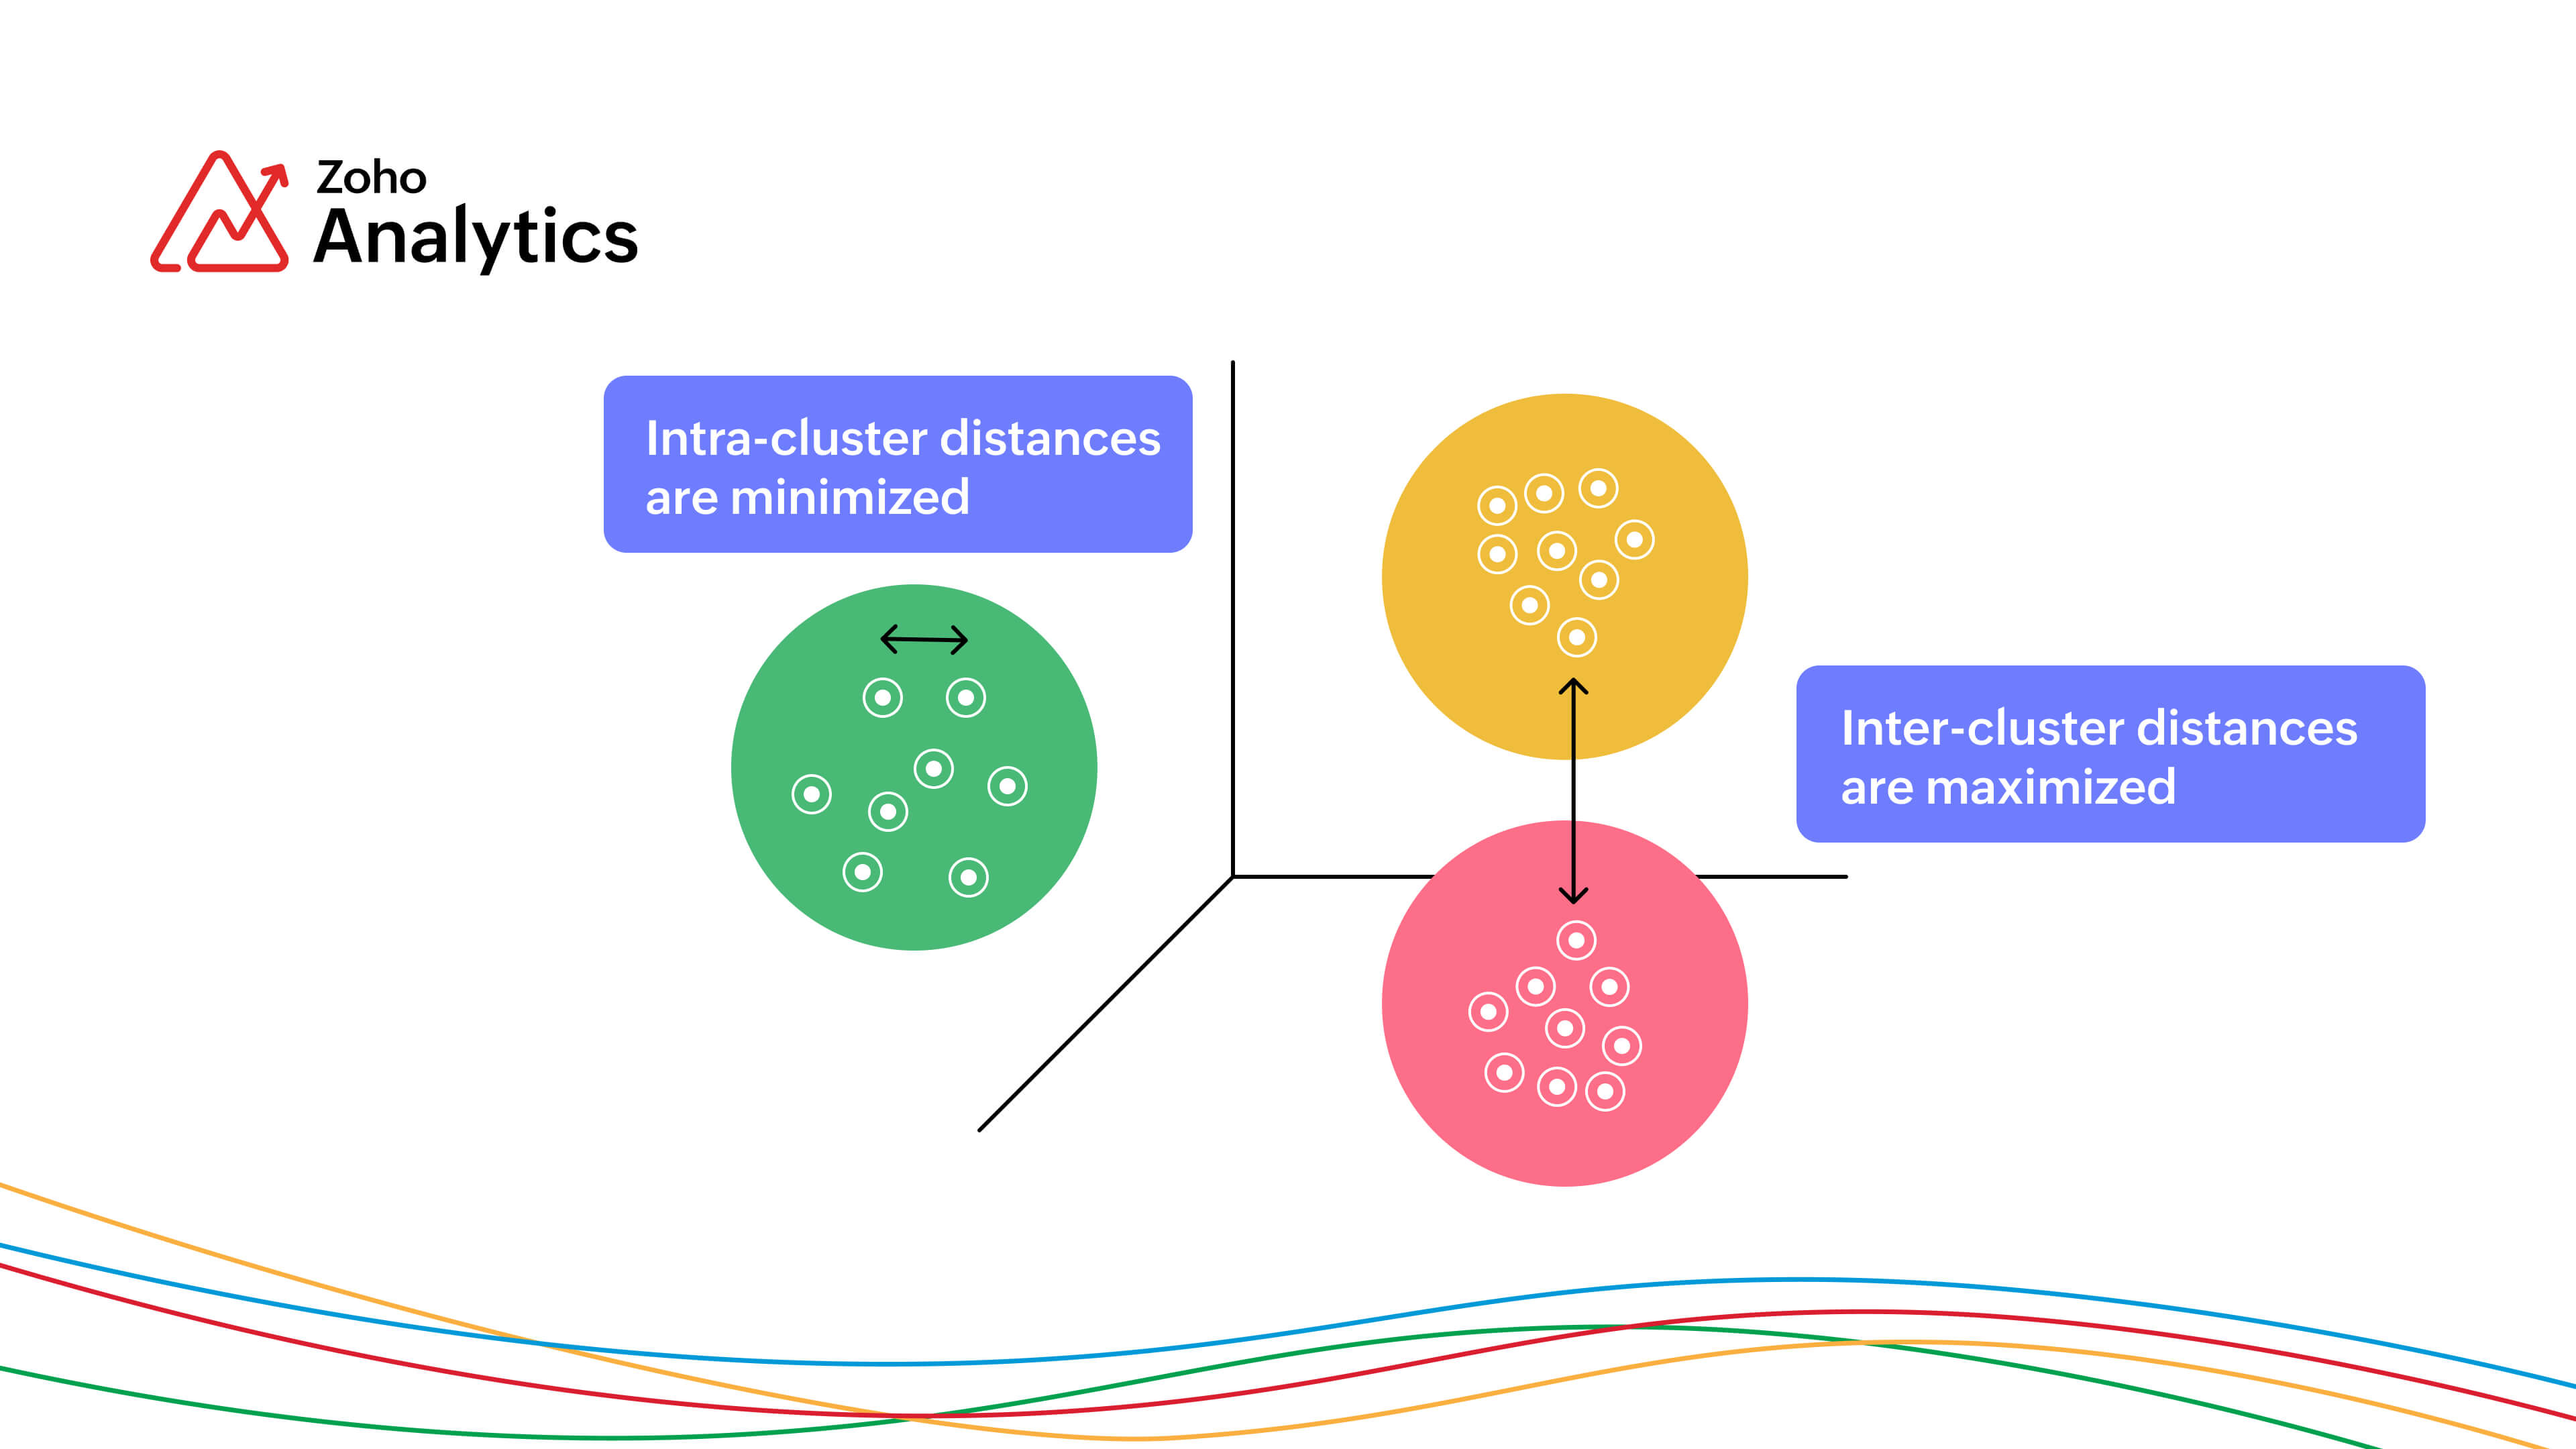
The objective of the centroid based models are,
- To group data points that have the same characteristics.
- To minimize the intra-cluster distances, that is to reduce the distance between the individual points in a cluster and its centroid.
- To maximize the inter-cluster distances so that the data points from different clusters are far apart, making the clusters distinct from each other.
The below table lists all the models, the method used for clustering, and when it can be used.
| K-means | K-modes | K-prototype |
Clustering Methodology | Centroid based clustering | Centroid based clustering | Centroid based clustering |
Distance method used | Euclidean distance | Binary distance | Combination of both Euclidean distance and binary distance |
Applicable for | Measure or Metrics column | Dimension or categorical columns | Both measure and dimension columns |
What is a Centroid?
In cluster analysis, a centroid is the central point of a cluster, representing the average position of all the data points within that cluster.
- K-means - The centroid is the arithmetic mean of all data points in the cluster, calculated by averaging the coordinates of the points.
- K-modes - The centroid is the mode (most frequent value) for each dimensional attribute within the cluster.
- K-prototypes: The centroid combines both measure and dimensional factors, using the mean for measure factors and the mode for dimensional factors.
Understanding the K-means Model
Zoho Analytics uses the K-means model for clustering measures or metric factors. The K-means model clusters data points into the pre-defined number of clusters based on the centroid. It locates centers through an iterative procedure.
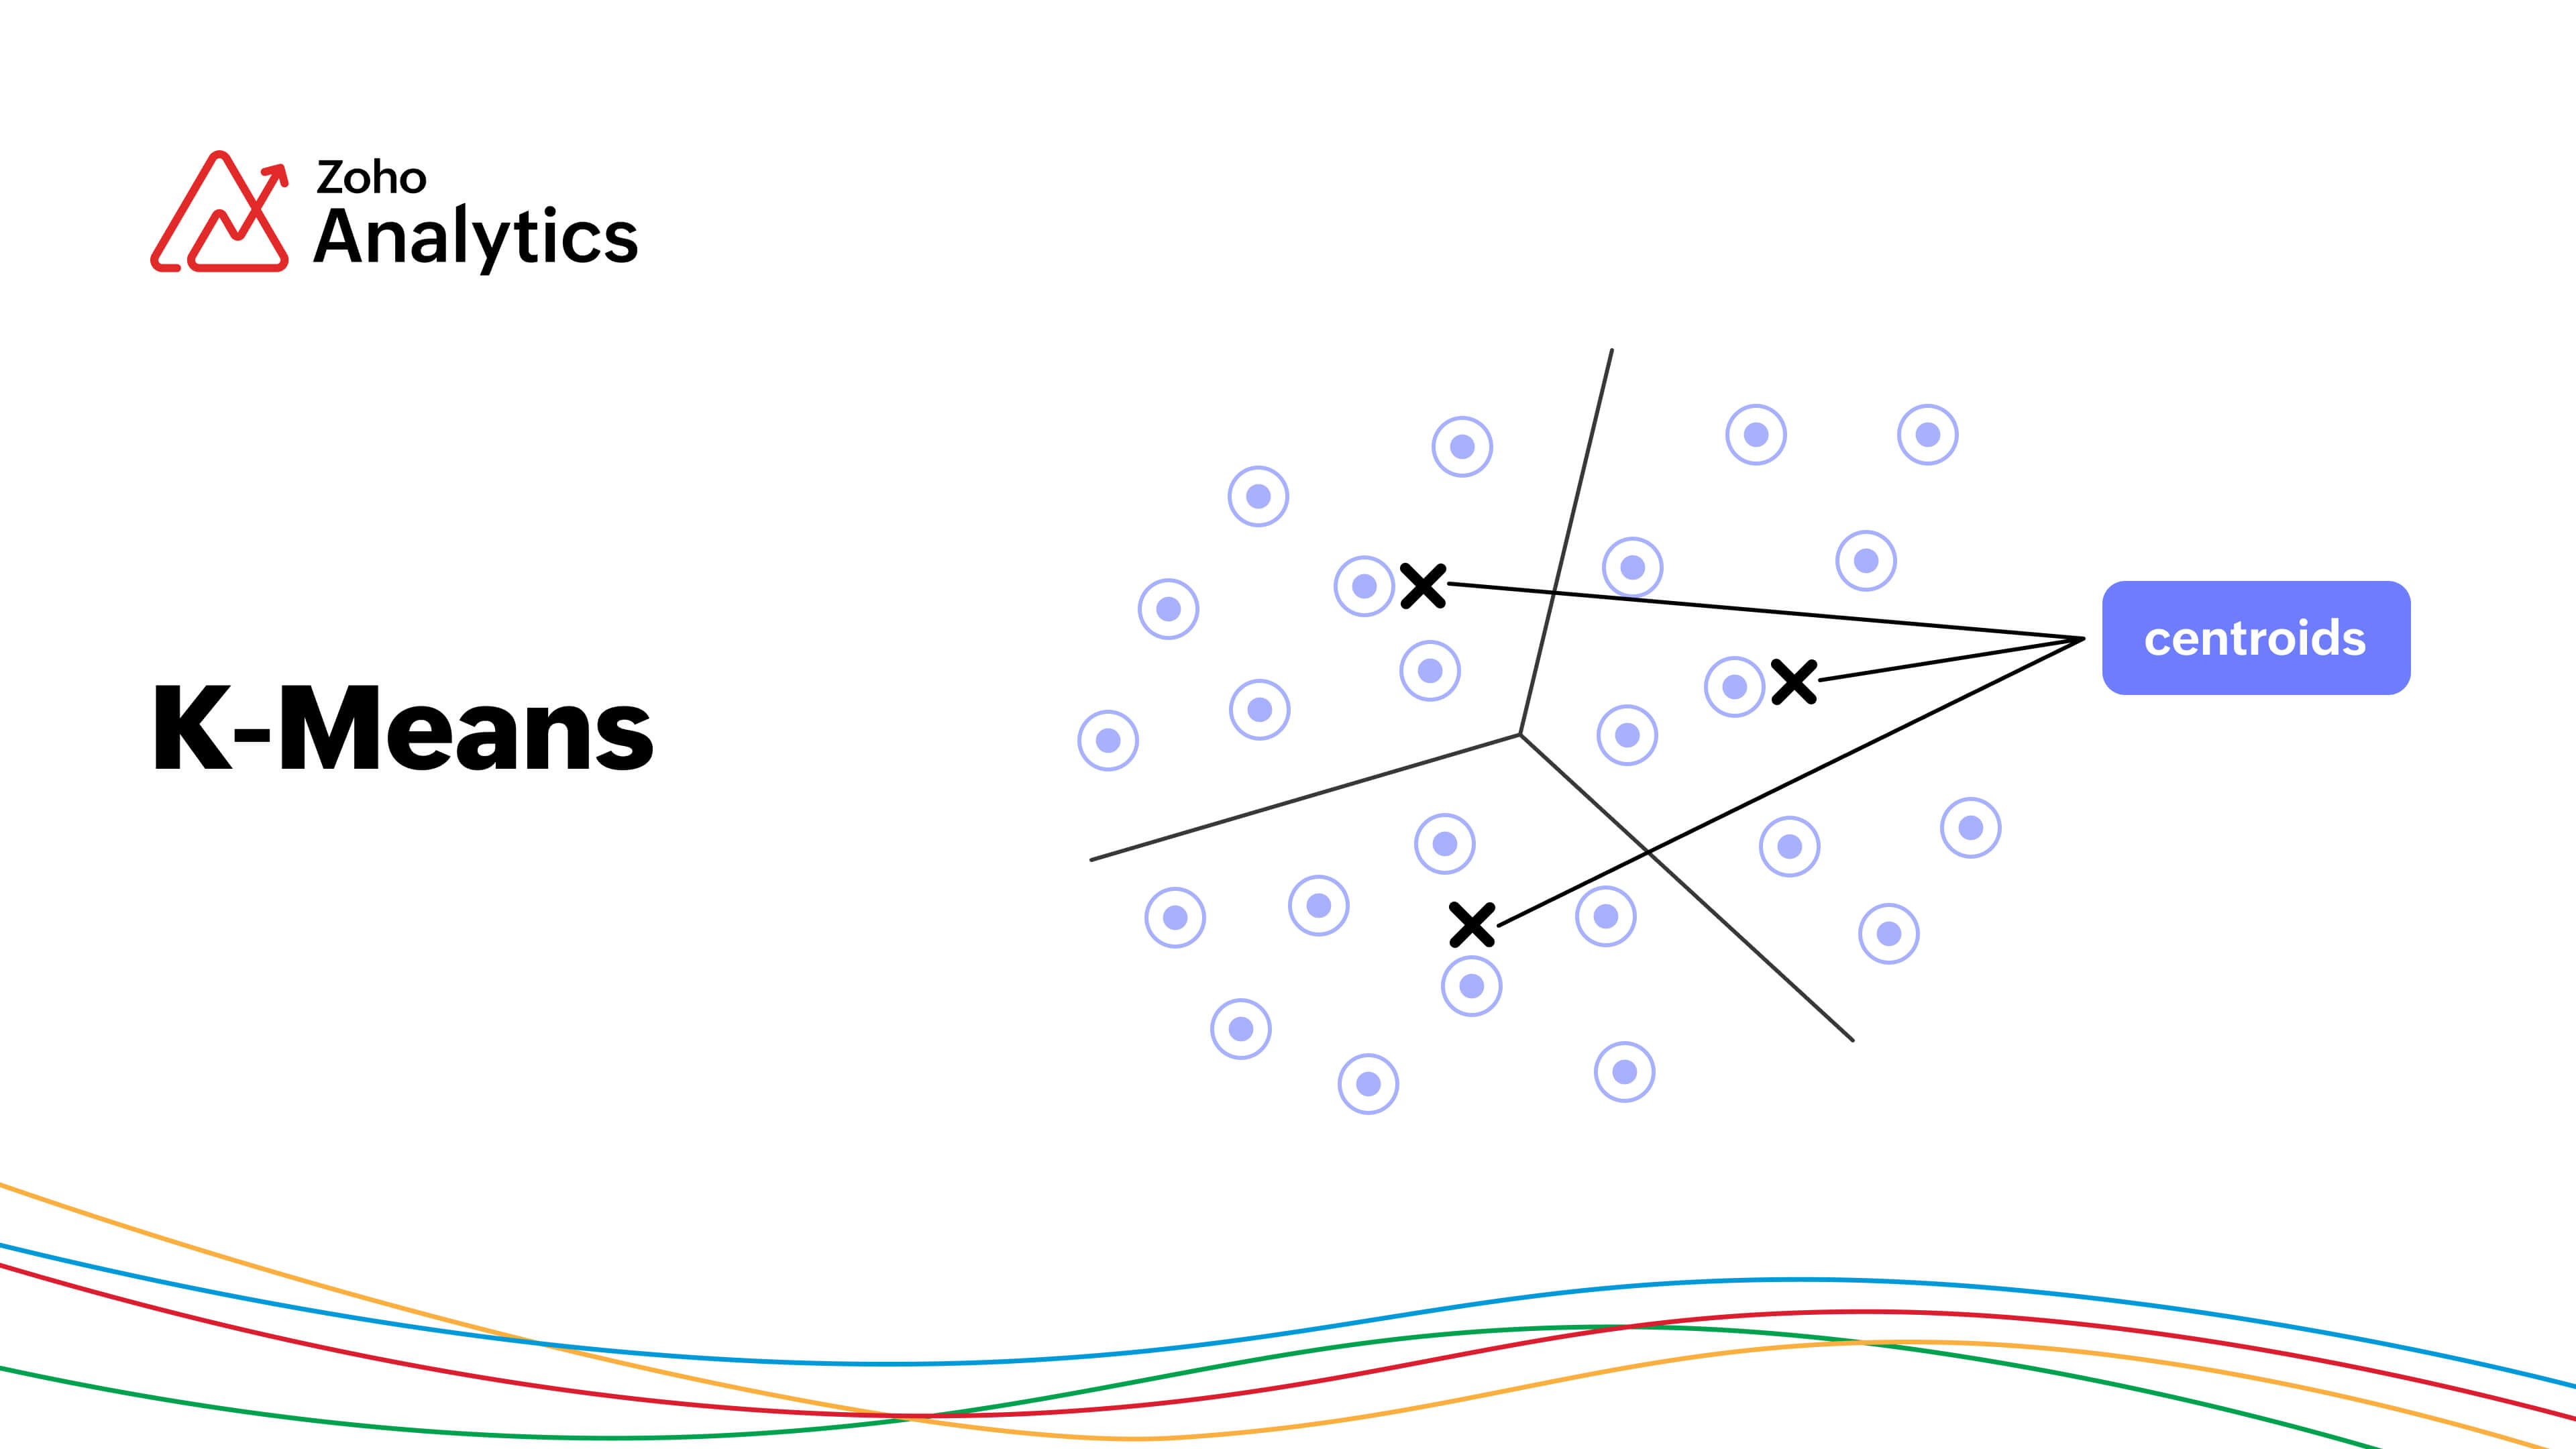
How does the K-means model work?
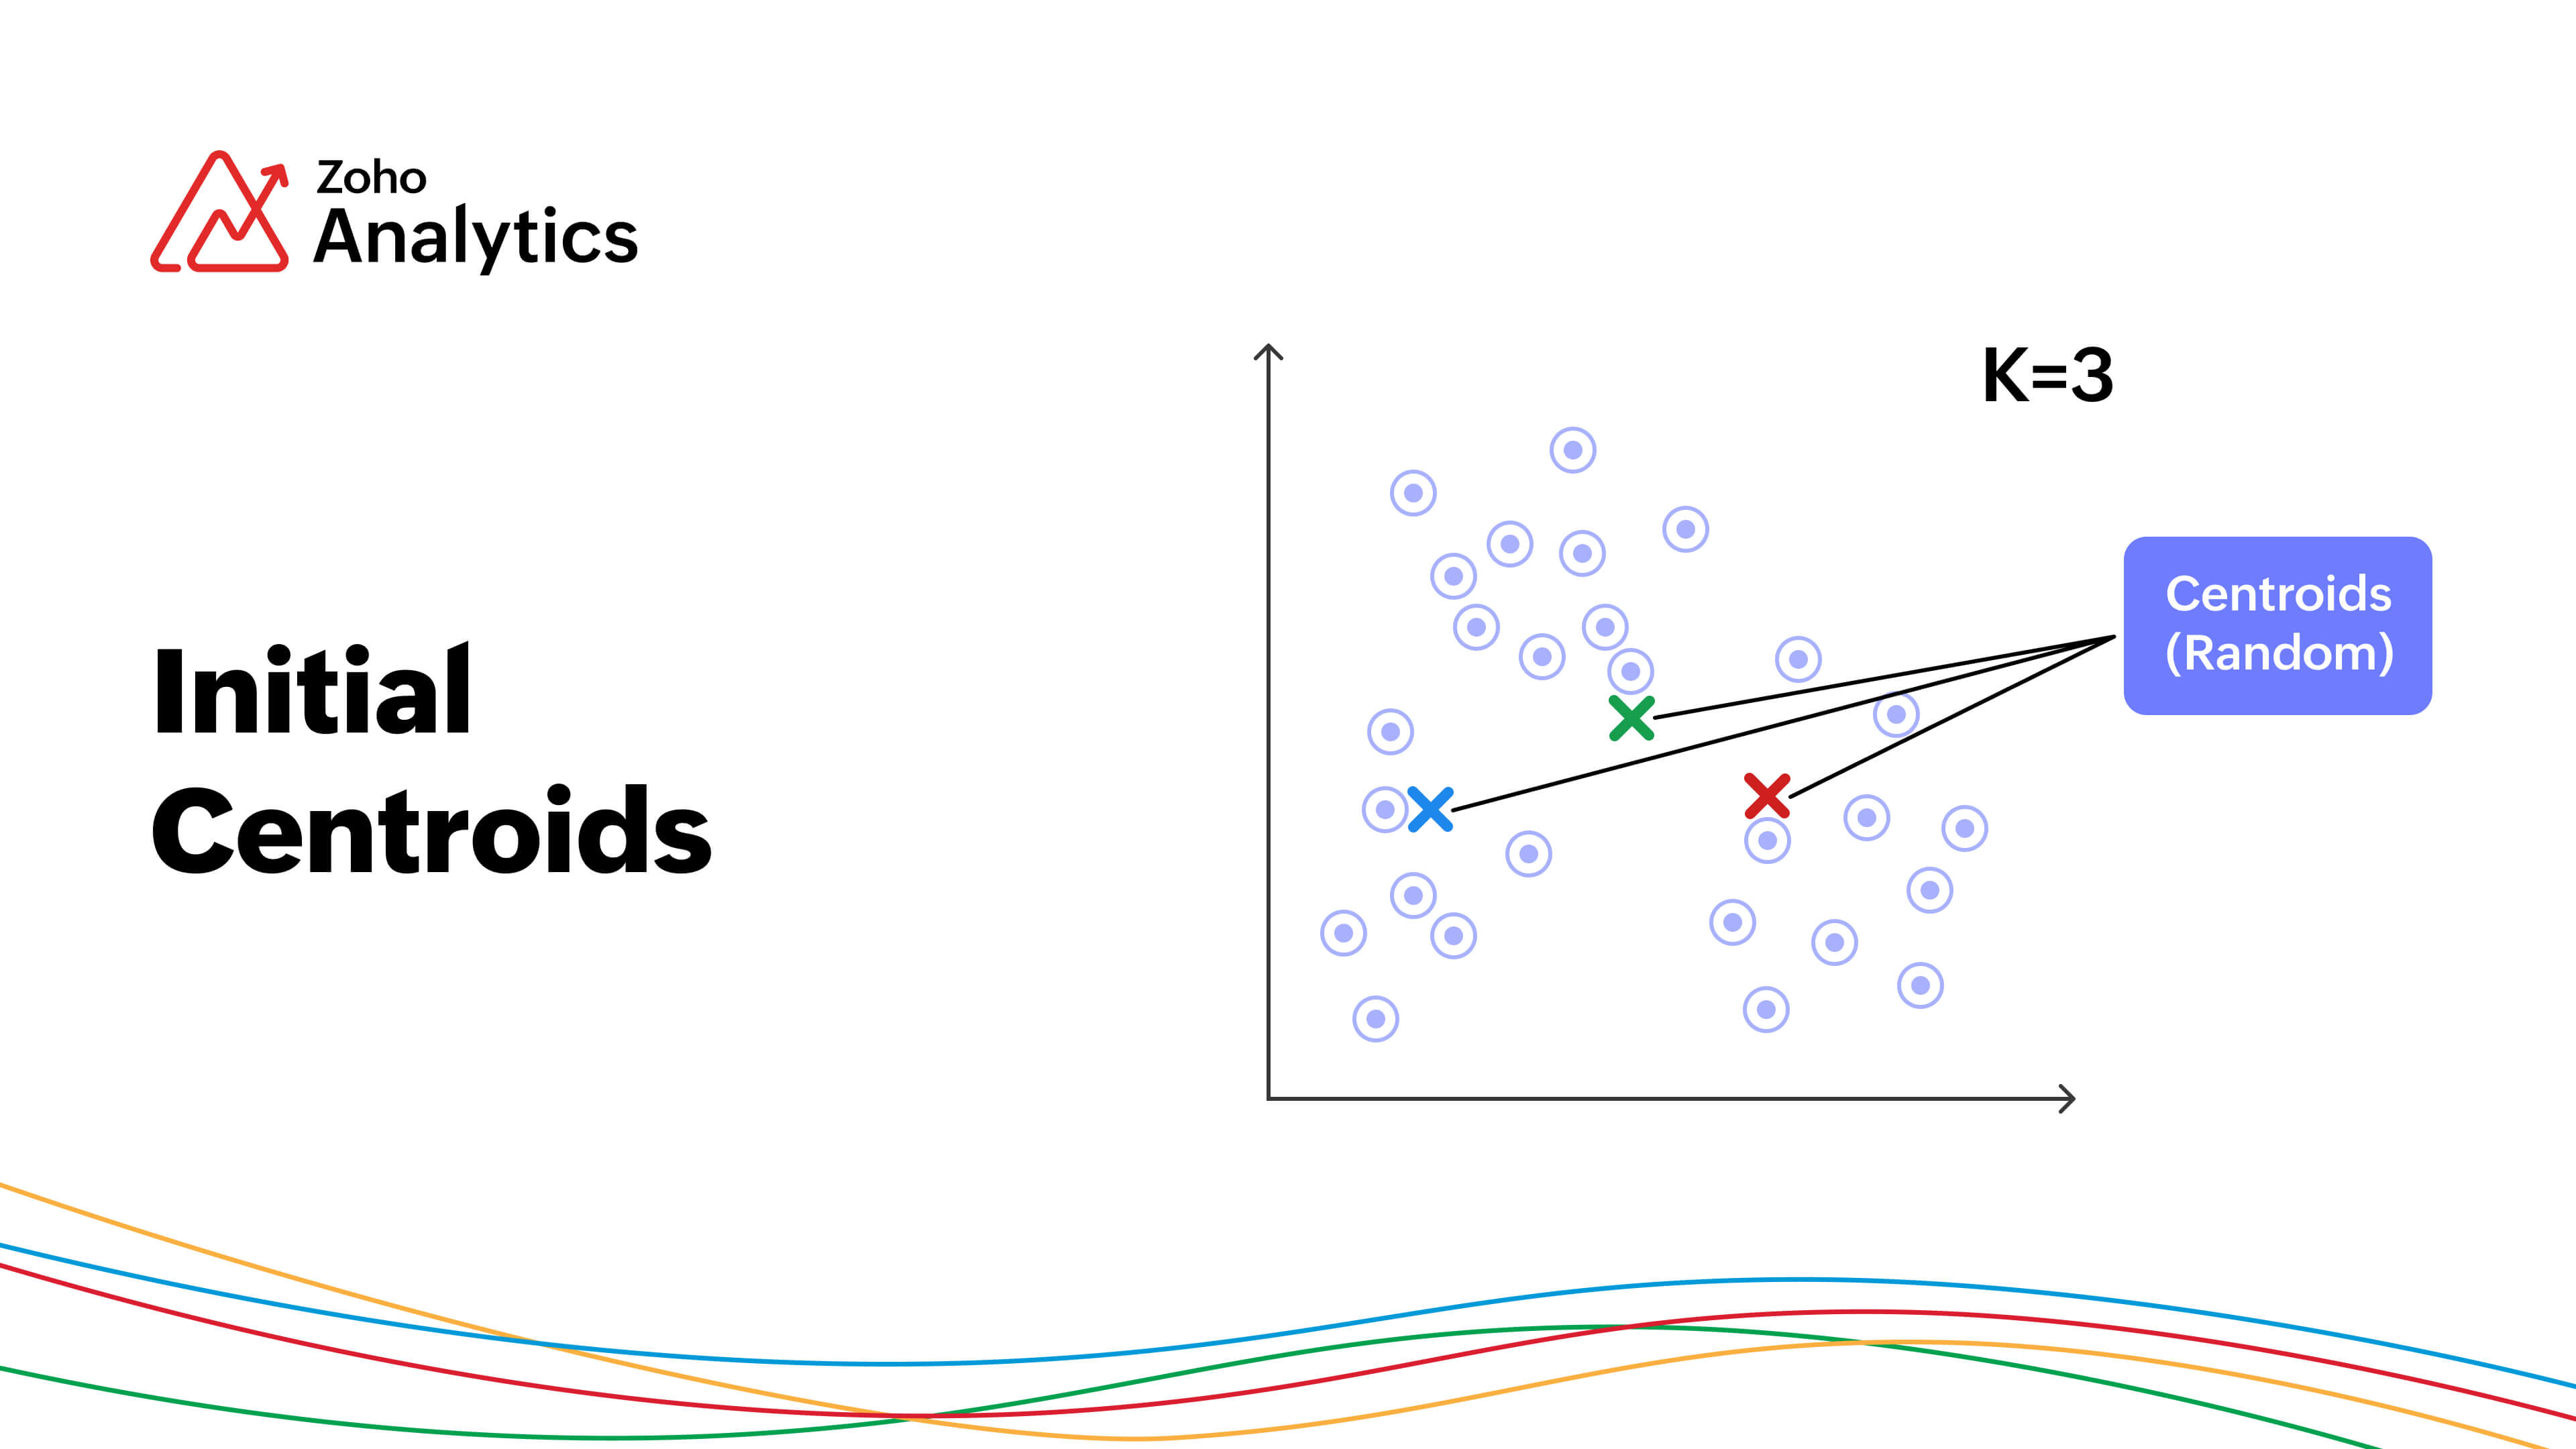
Initialization
The model starts by picking k random data points and define them as the centroid for each cluster.
Calculate the distance and assign data points to the nearest cluster
The Euclidean distance between each data point and the centroids are calculated.
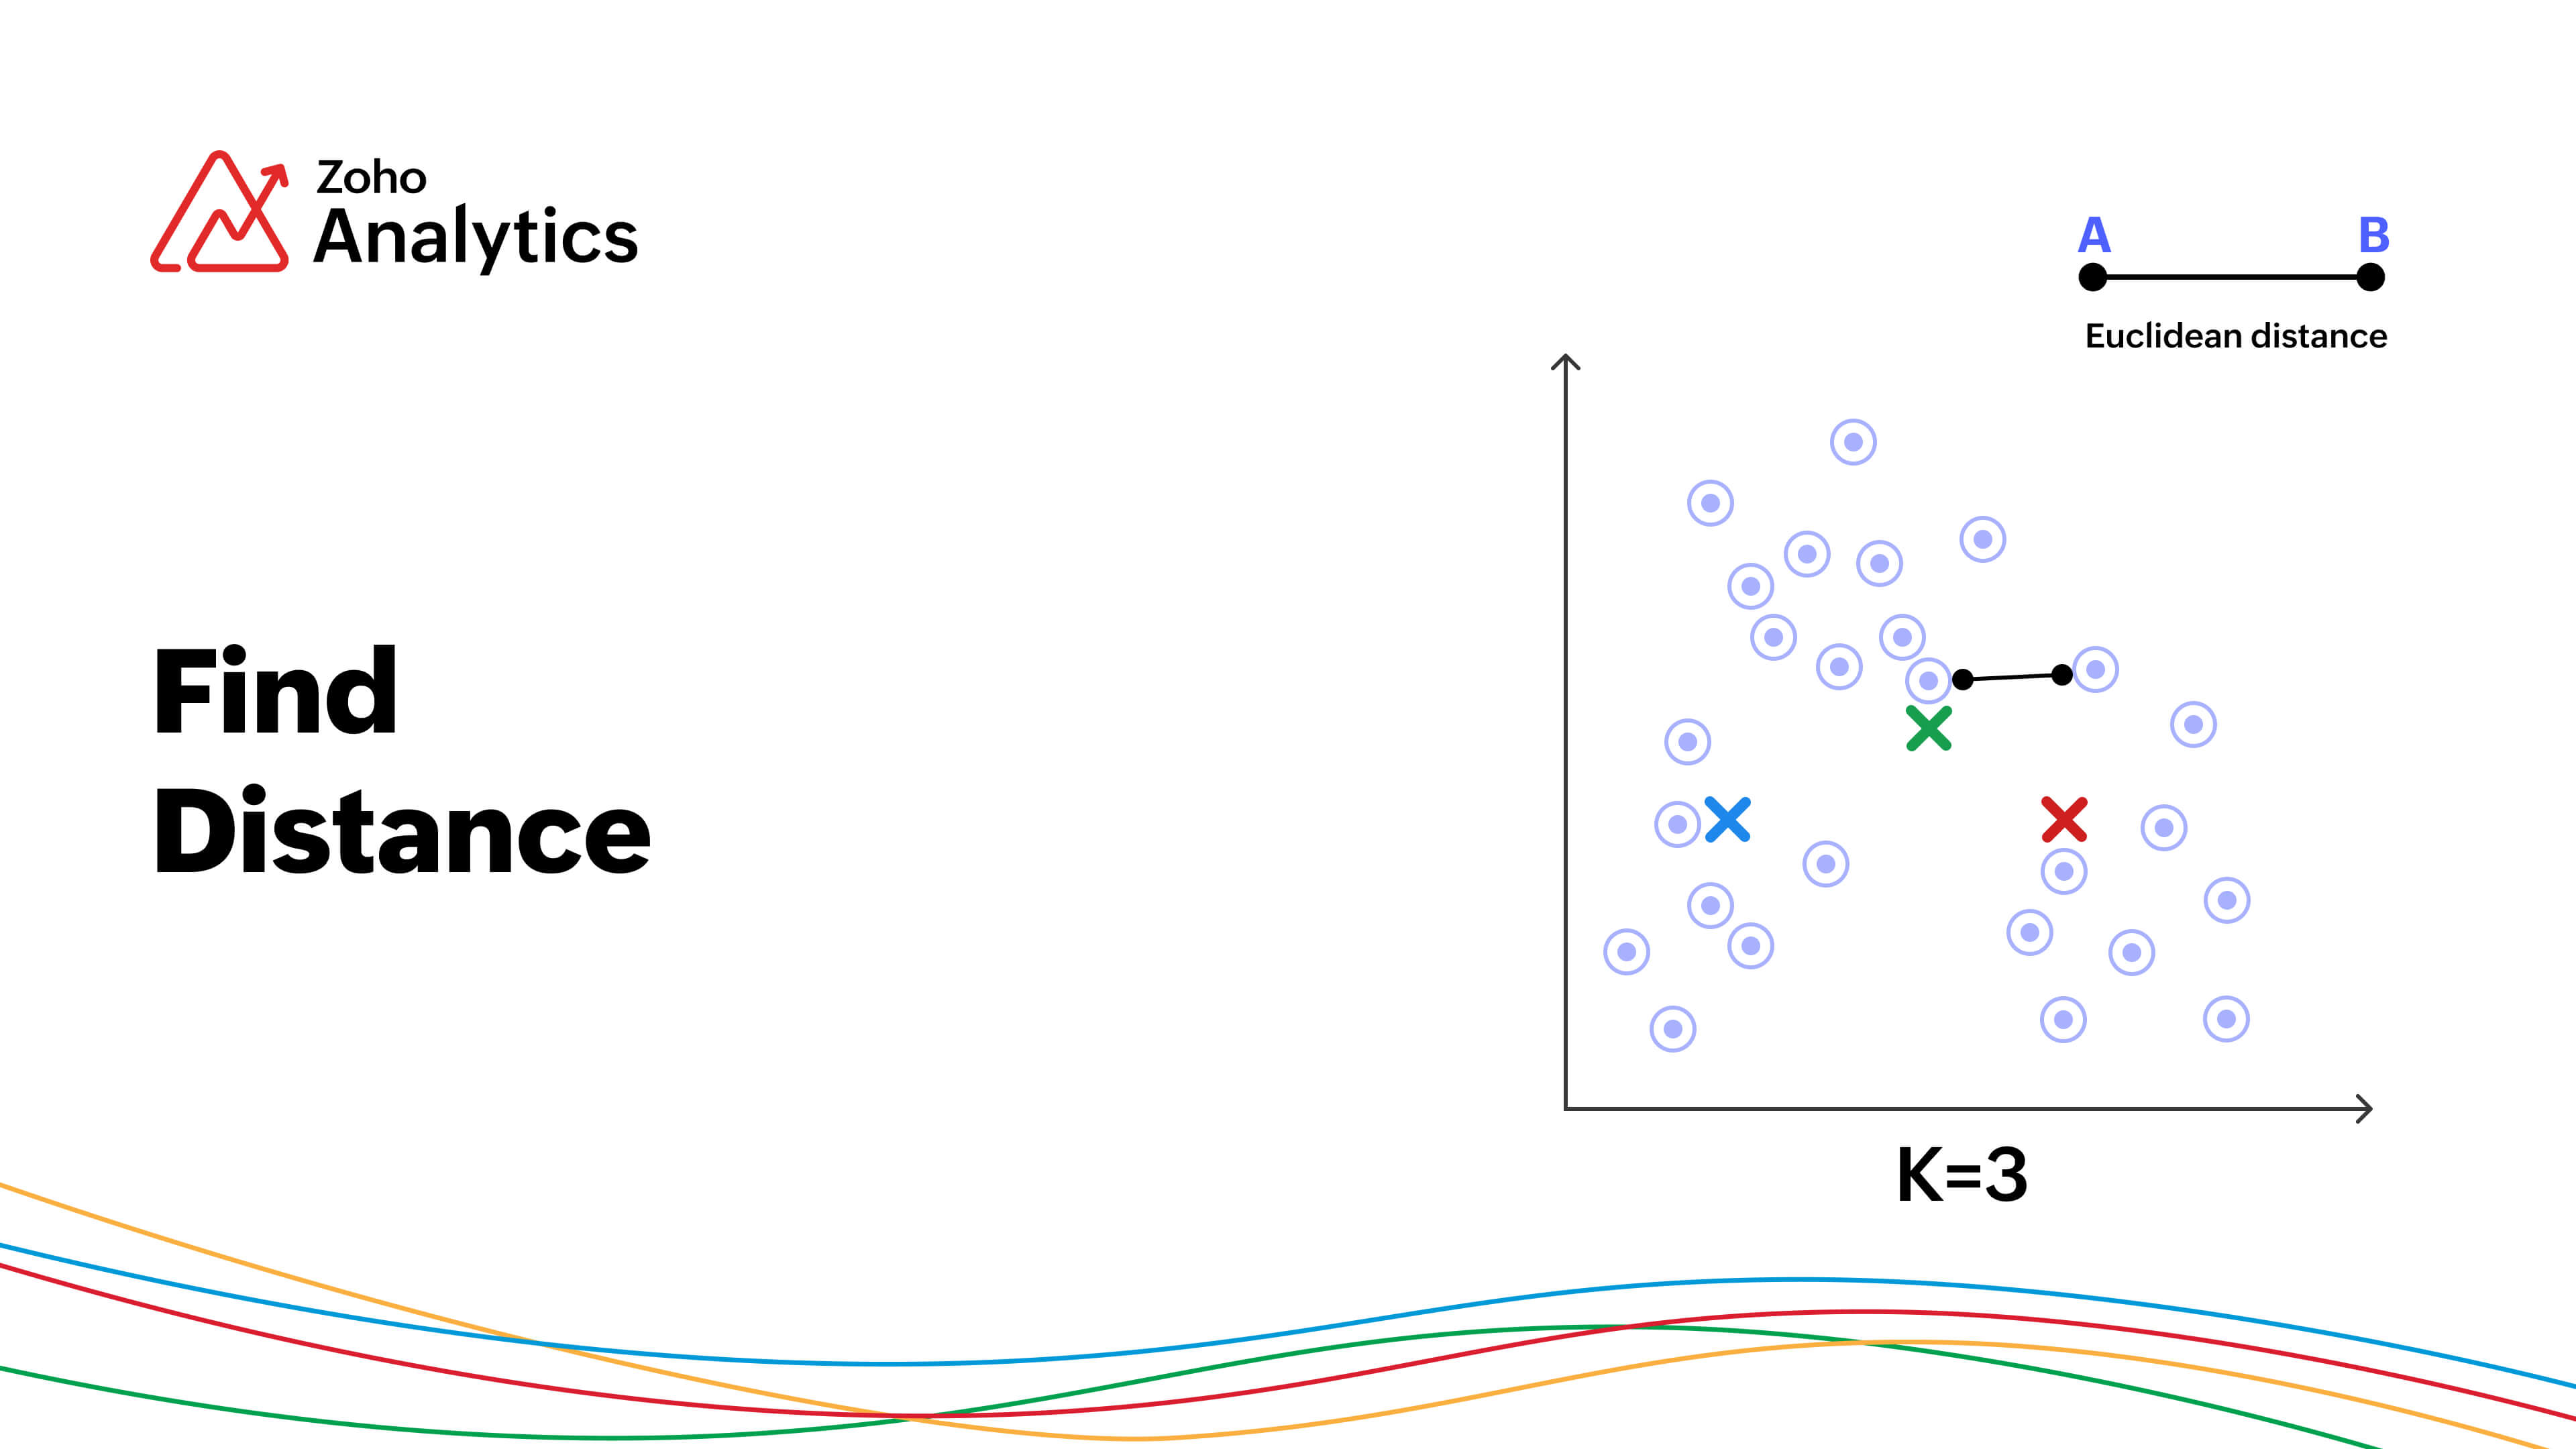
Given below is the Euclidean distance,
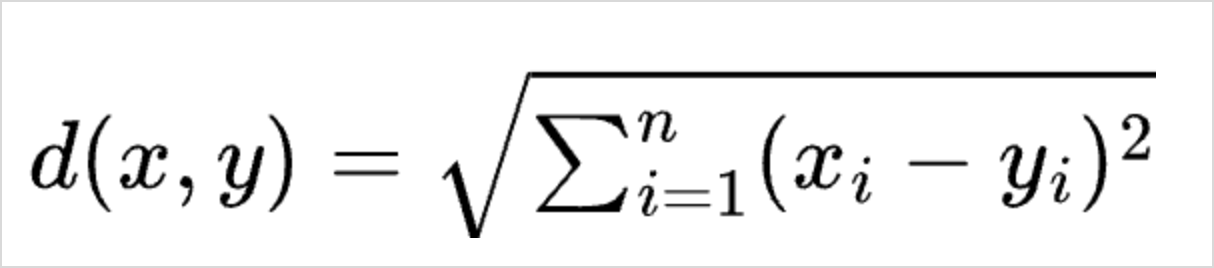
The data points are then assigned to nearest cluster centroid where the distance between the data point and the centroid is minimum.
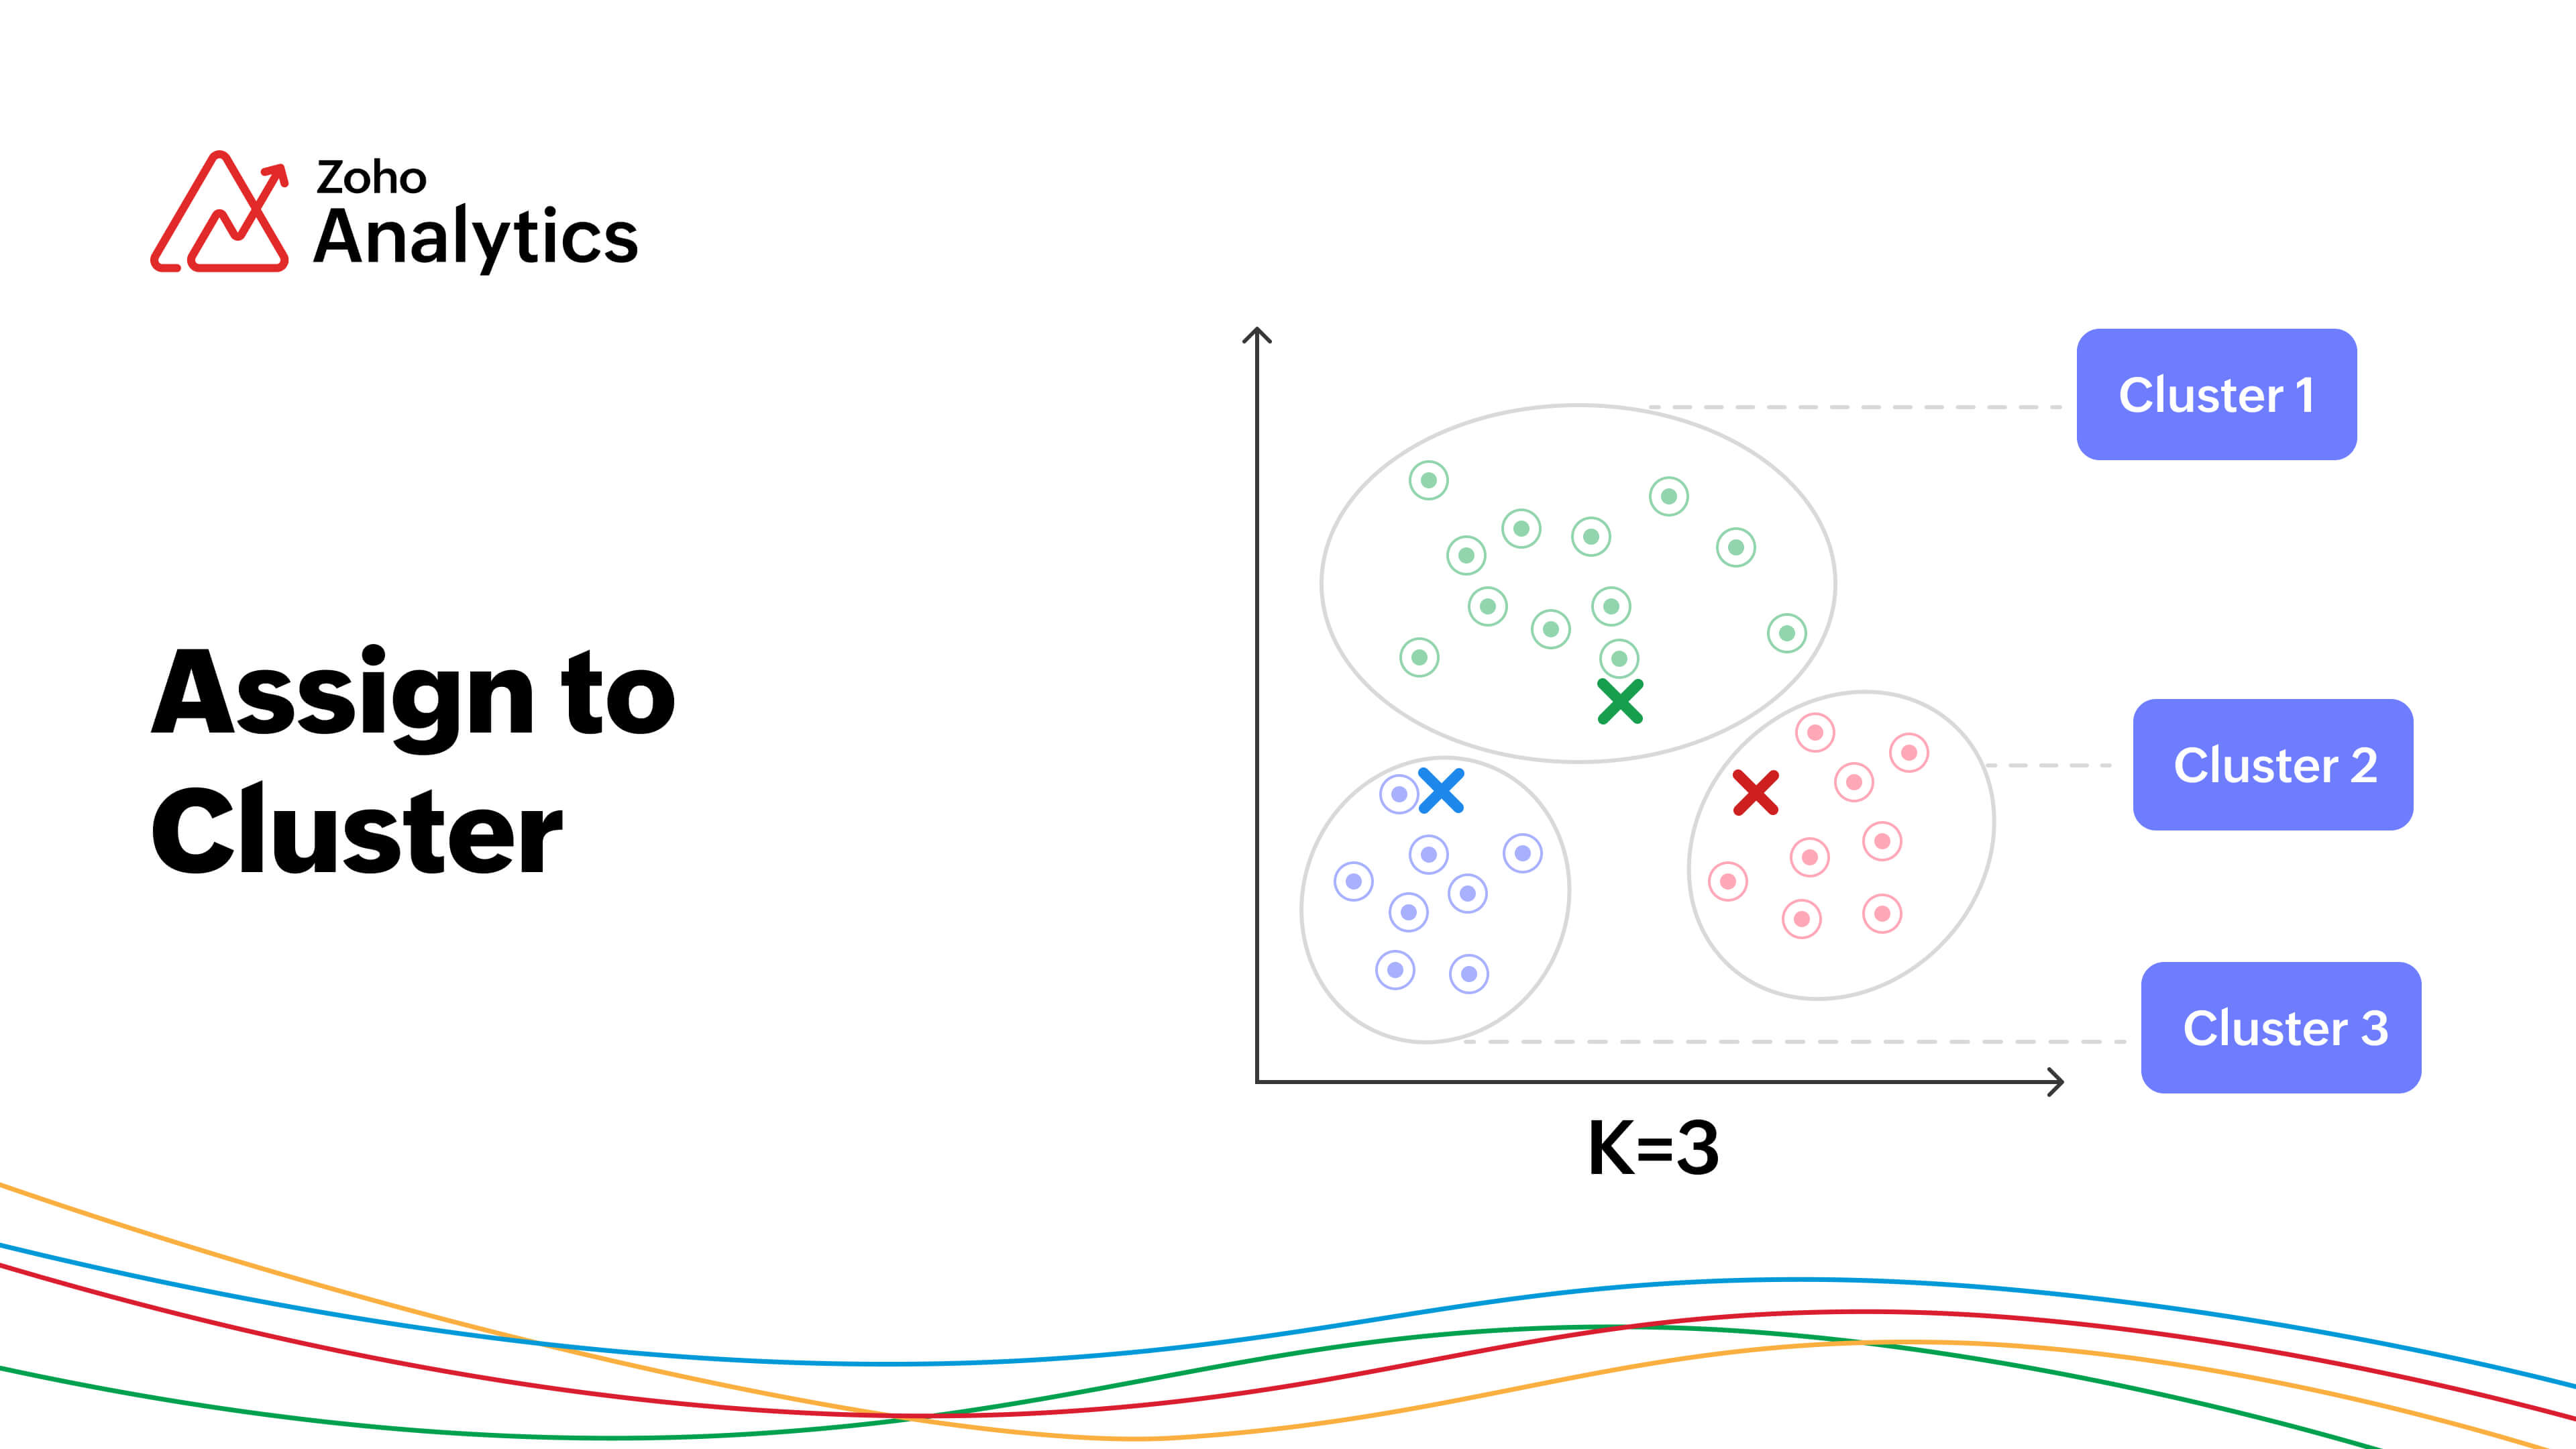
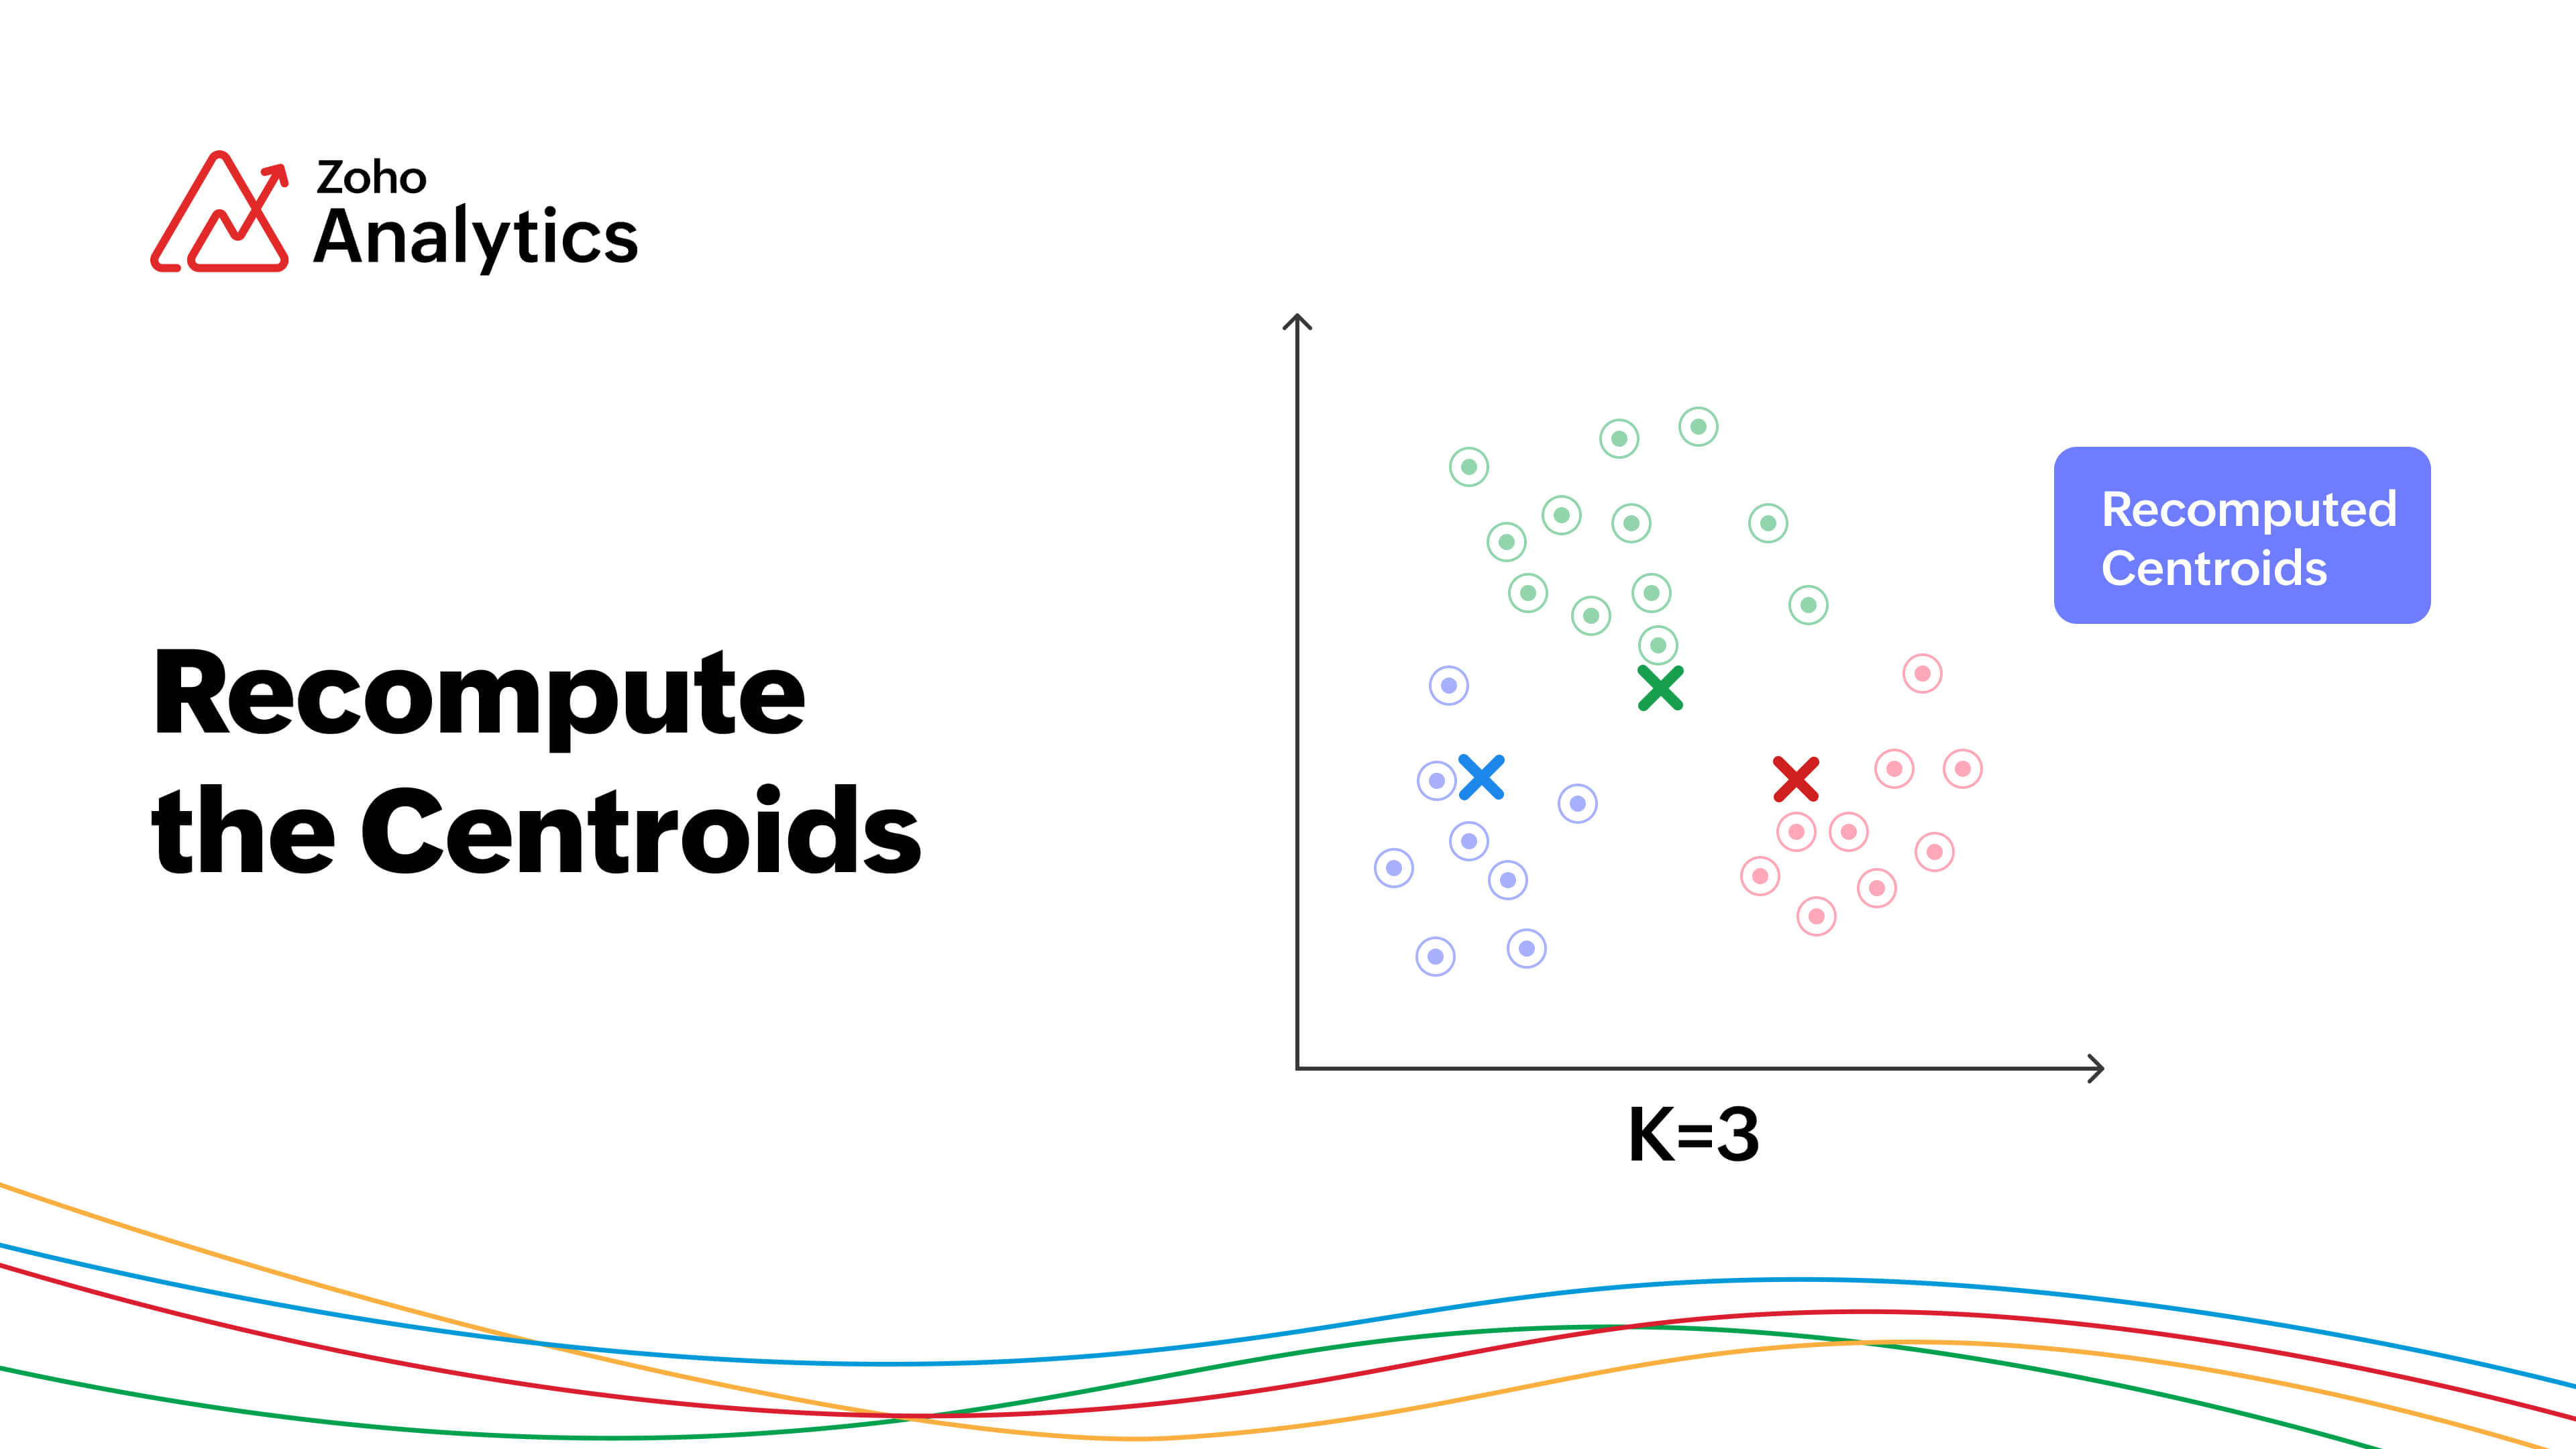
Re-defining the Centroids
Once all the data points have been assigned to a cluster, the centroid of the cluster is recomputed by taking the average mean of all the points in the clusters. The Euclidean distance is again calculated for all the data points with the centroids. The data points are then re-assigned to its closest centroid.
Cluster Stabilization
The above process is repeated until the clusters stabilize, that is the centroids no longer change and data points cannot be re-assigned.
Understanding the K-modes model
Zoho Analytics uses the K-modes model for clustering measures or metric factors. The K-modes model clusters data points into the pre-defined number of clusters based on the centroid. Unlike the K-means algorithm that calculates distance based on the Euclidean distance, K-modes uses the binary distance method for assigning data points to the clusters. K-modes model uses the mode, the most frequently occurring value as centroids.
The binary distance formula is given by
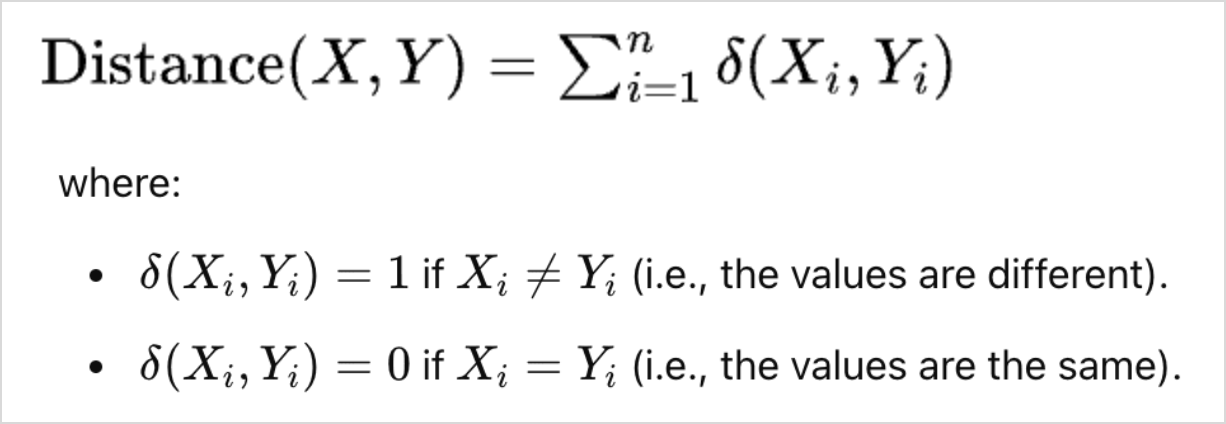
How does the K-modes model work?
Initialization
The model starts by picking k random data points and define them as the centroid for each cluster.
Calculate the Dissimilarities and Assign the Values to the Nearest Cluster
Binary distance for the values in each factor and the selected centroids (mode) is calculated. The values are then assigned to the nearest cluster that has the least dissimilarity.
Re-defining Modes
Once all the values are assigned, new modes are defined for the clusters. The modes are updated based on the most frequent value. Re-compute the dissimilarity (binary distance) of each value to the modes and assign values to the nearest cluster.
Cluster Stabilization
The above process is repeated until the clusters stabilize, that is the centroids no longer change and data points cannot be re-assigned.
Understanding the K-prototype model
The K-prototype model is used for clustering factors containing both measure and dimensional columns. K-prototype combines both K-means and K-modes models for computing the centroids. Weightage parameters are used to define and control the dominance of the measure and dimensional columns.
The combined distance formula is given by
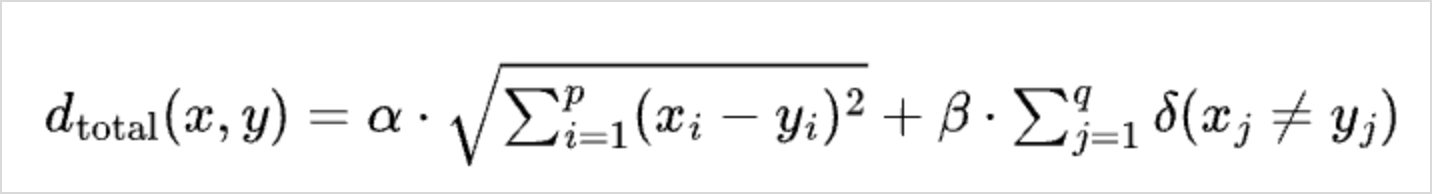
How does the K-prototype model work?
Initialization
The model starts by picking k random data points and define them as the centroid for each cluster.
Calculate the combined distance and assign values to the nearest cluster
Combined distance formula is calculated, and each data point is assigned to a nearest cluster.
Re-defining the centroids
Once all the data points have been assigned to the cluster, the combined distance formula is again calculated for all the data points with the centroids. The data points are then re-assigned to its closest centroid.
Cluster Stabilization
The above process is repeated until the clusters stabilize, that is the centroids no longer change and data points cannot be re-assigned.
Export Cluster Analysis Reports
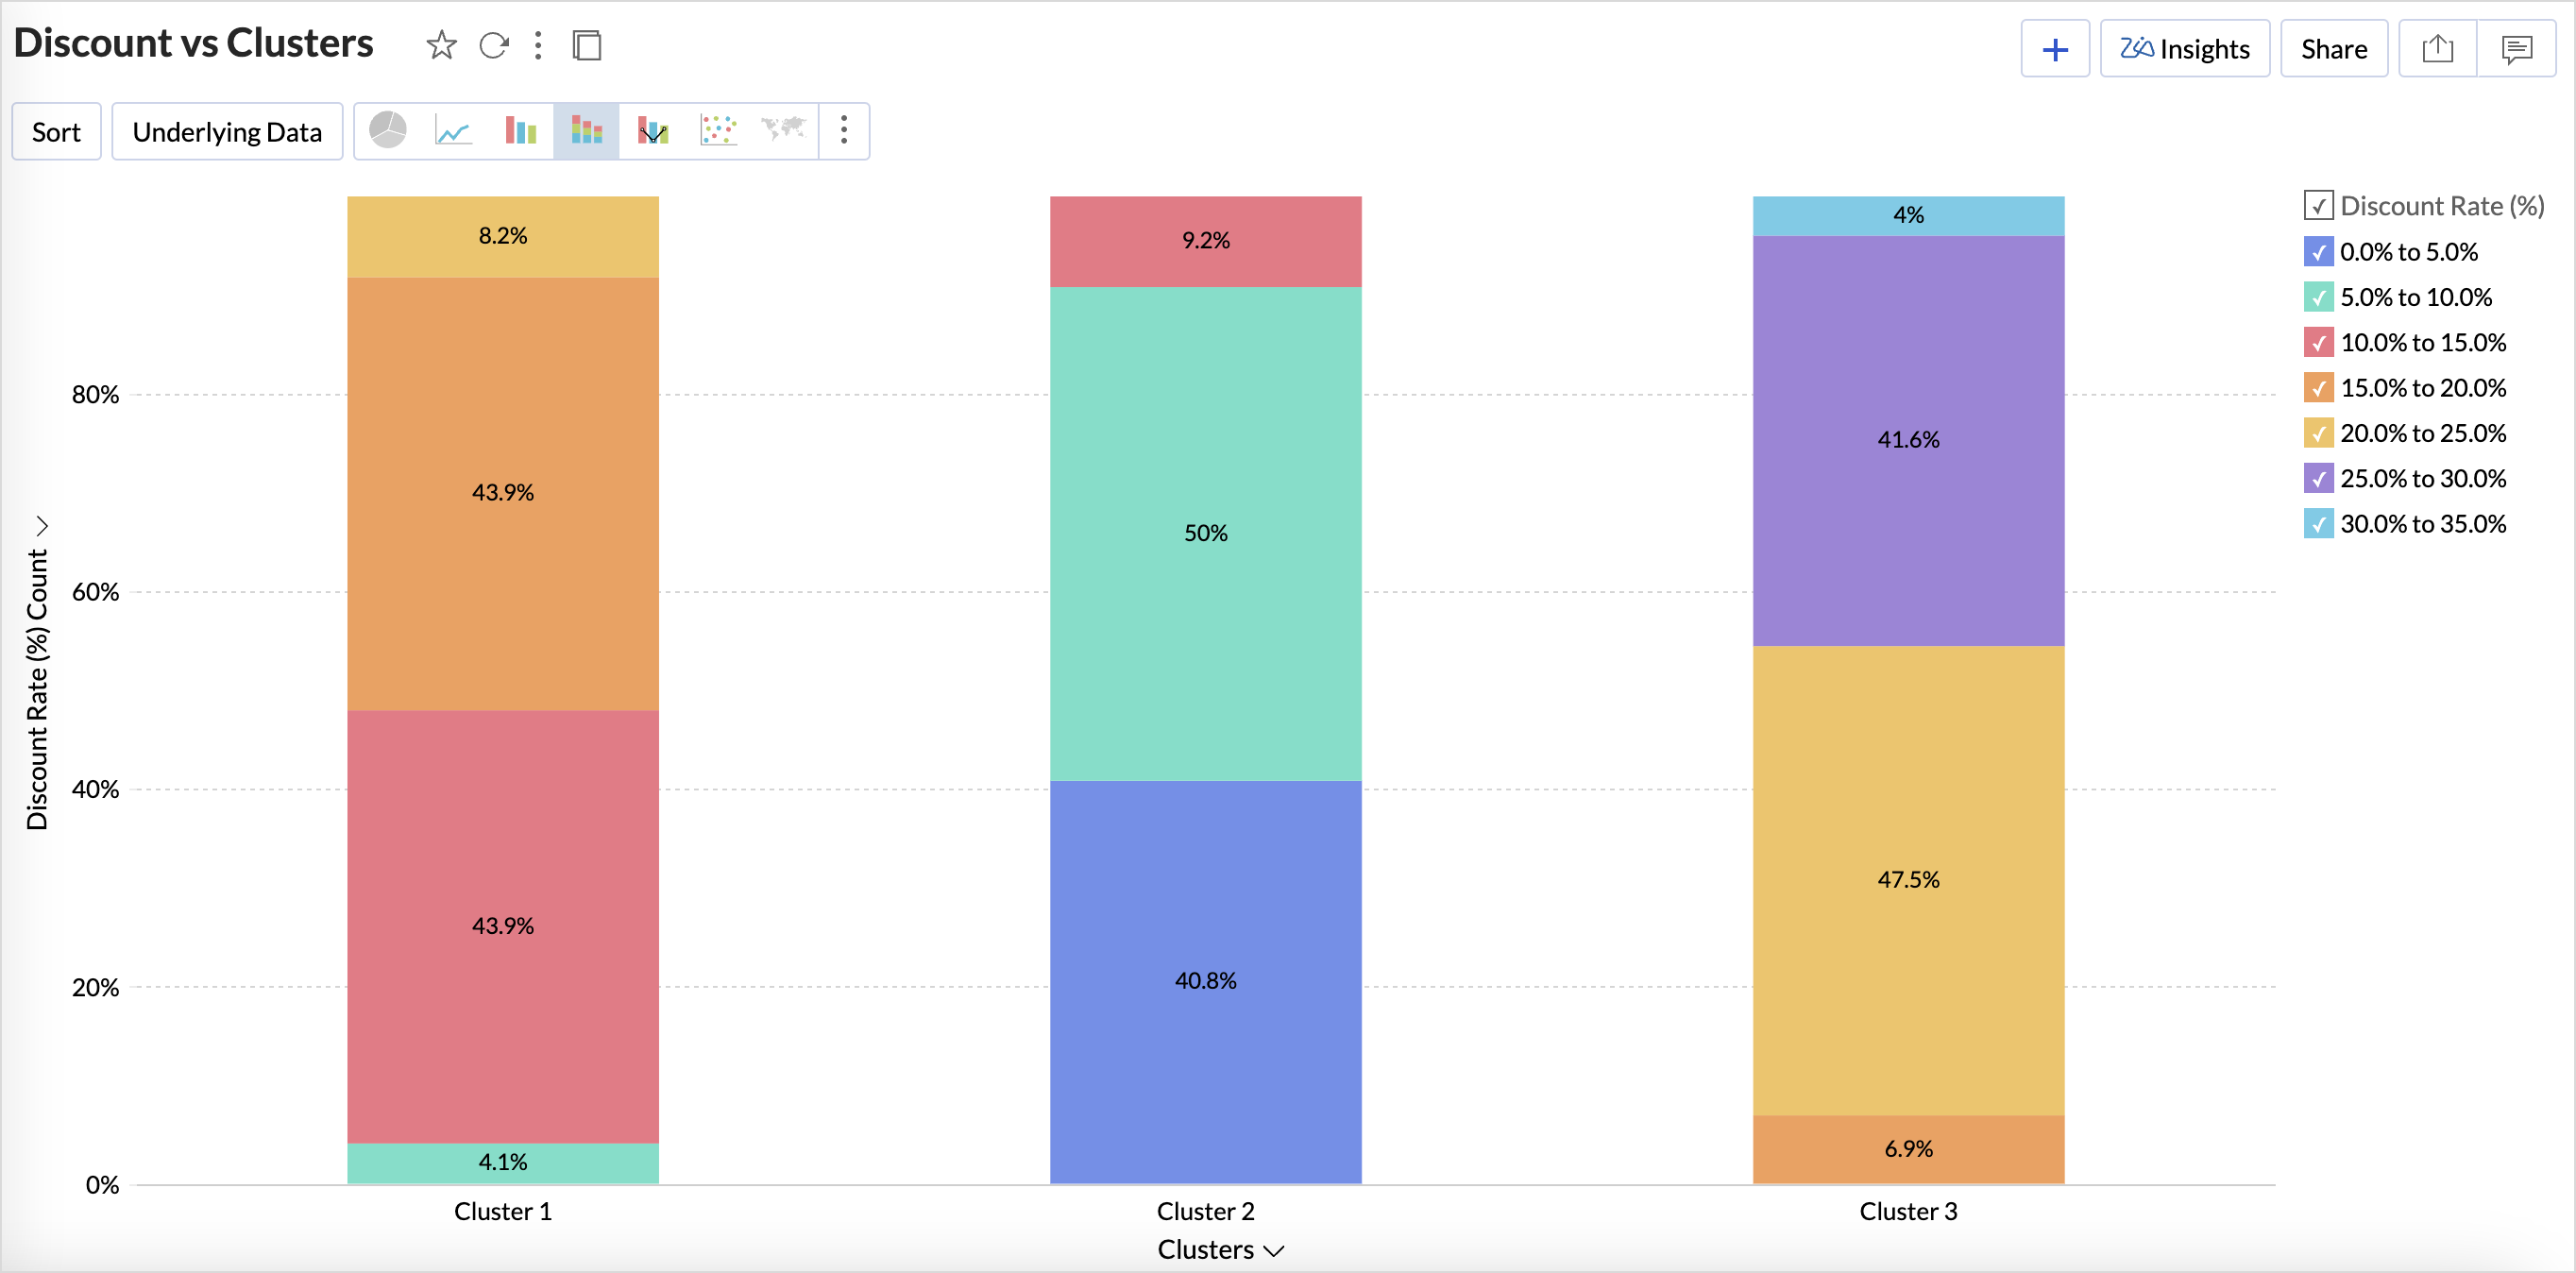
Once the data points are clustered, you can export the clustered data and use it to perform ad hoc analysis and compare with different dimensions and metrics. This helps to understand the distribution of data points in each cluster.
Zoho Analytics supports various file formats for exporting data. Each data point in a cluster analysis report receives a cluster assignment during export. You can export it to any text file format to conduct further analysis on the clustered data.