Data Alerts
Business data changes constantly, and the changes that matter most rarely announce themselves. A sales figure slips below target, a support queue spikes, a region stops converting. Watching for these manually across a growing set of reports is not practical.
Data Alerts let you define the conditions that matter and hand the watching over to Zoho Analytics. Each alert monitors a report on a schedule you set, evaluates your conditions against the latest data, and notifies the right people through the channels they already use the moment those conditions are met. Alerts can also trigger a complete automation pipeline, so a change in your data does not just reach someone, it acts.
- Availability
- How Data Alerts Work
- Creating a Data Alert
- Defining Alert Conditions
- Setting the Verification Schedule
- Suppressing Repeat Alerts
- Configuring Alert Actions
- Triggering Workflows
- Managing Data Alerts
- Frequently Asked Questions
Availability
Data Alerts are available on the Standard plan and above. The number of alerts you can create is governed by your plan. Refer to the Pricing Page for details.
Alerts can be created by:
- Account Administrator
- Organization Administrators
- Workspace Administrators of the workspace
How Data Alerts Work
An alert is a standing instruction attached to a report. Once created, it runs on its own until you edit or delete it.
- Define the conditions: Specify what change in the data should be treated as significant.
- Set the verification schedule: Decide how often Zoho Analytics should check whether those conditions hold.
- Choose the actions: Select the notification channels, the recipients, and any workflow to run.
- Receive the alert: When a scheduled check finds the conditions met, the configured actions execute automatically.
Supported Report Types
Data Alerts can be created over the following views:
- Charts
- Pivot Tables
- Summary Views
Data Groups
Conditions are not evaluated against the report as a whole. They are evaluated against each data group in the report independently, and the alert triggers when any group satisfies the conditions.
What counts as a data group depends on the report type:
- Charts: Each data series is a data group.
- Pivot Tables: Each data cell and each summary is a data group.
- Summary Views: The data cell is a data group.
This is why an alert on a chart of sales by product category across years can fire for a single category in a single year, without every other combination having to meet the condition.
Note:
- Alert conditions cannot be defined over columns that use an advanced summary function.
- Alert conditions cannot be defined over a View Formula.
- In a Pivot Table, alert conditions cannot be defined over a subtotal whose primary aggregate function has been changed using the Show Total As option.
- Conditions are evaluated only at the scheduled verification time, not continuously. A condition that is met and then reverses between two checks will not raise an alert.
Creating a Data Alert
The steps below apply to every alert, regardless of report type or notification channel. Later sections describe the individual fields in detail.
- Open the Chart, Pivot Table, or Summary View you want to monitor.
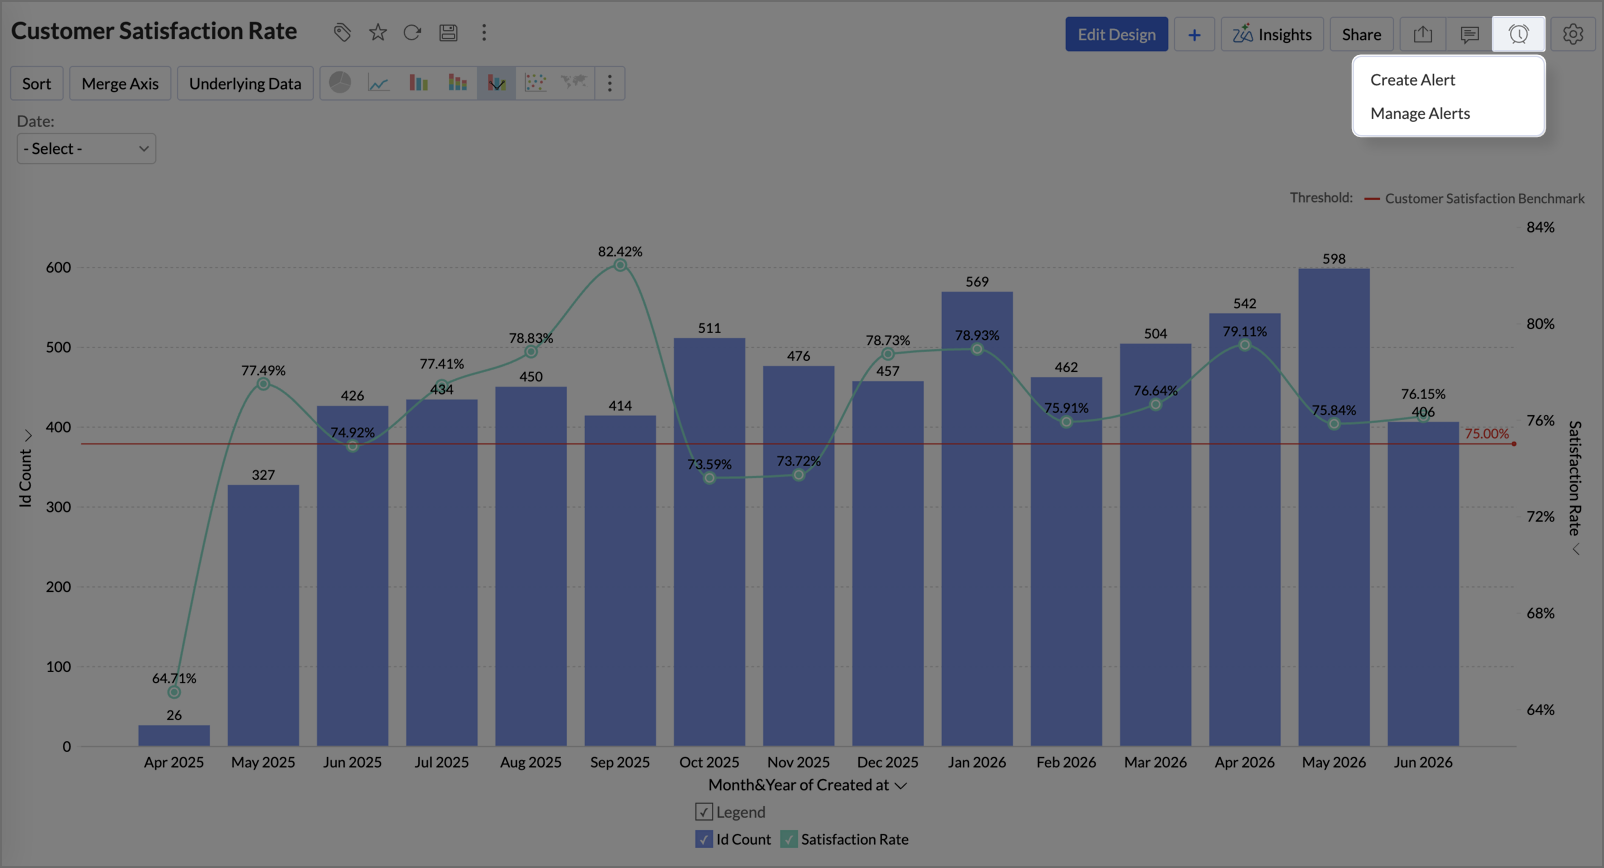
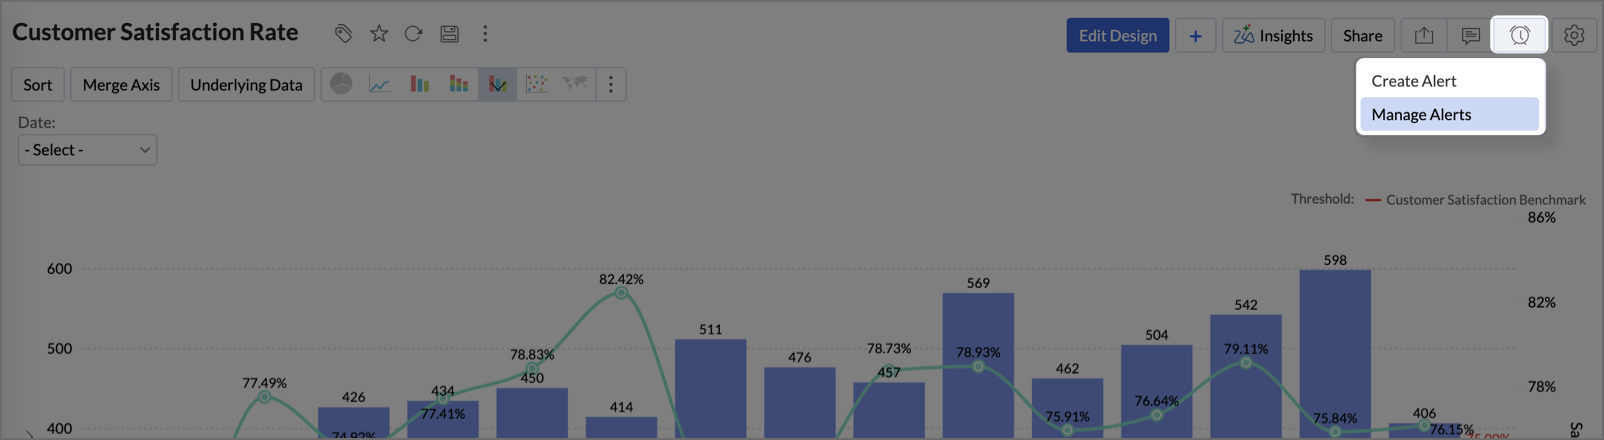
- Click the Alerts icon in the top-right corner and select Create Alert.
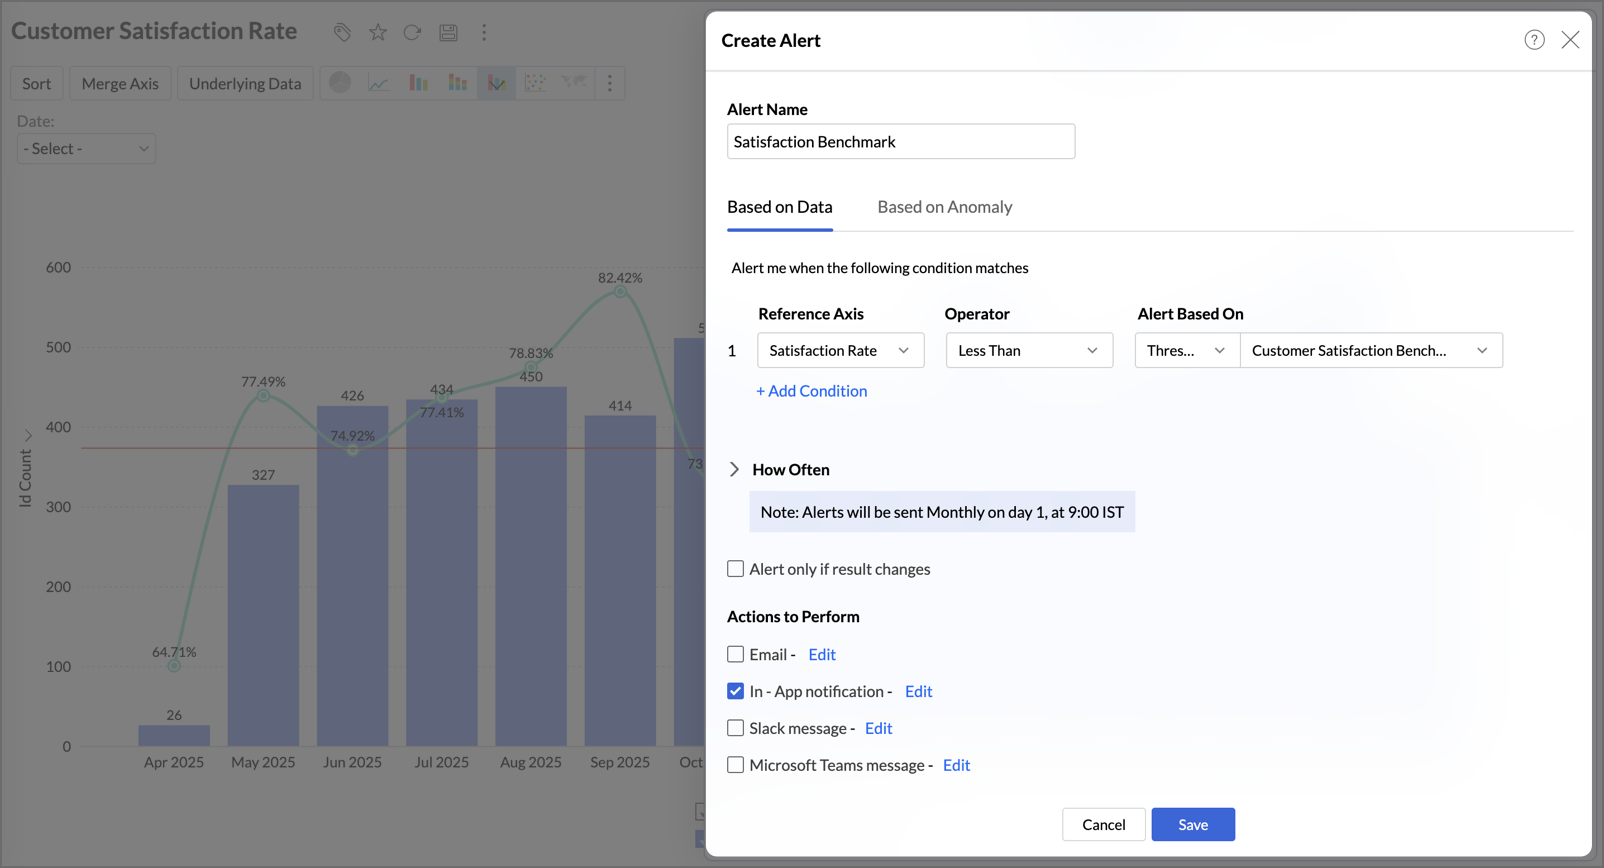
- In the Create Alert dialog, enter an Alert Name.
- Under Alert me when the following condition matches, define your conditions using the Reference Axis, Operator, and Alert Based On fields. Click + Add Condition to add more.
- Expand How Often and set the verification schedule.
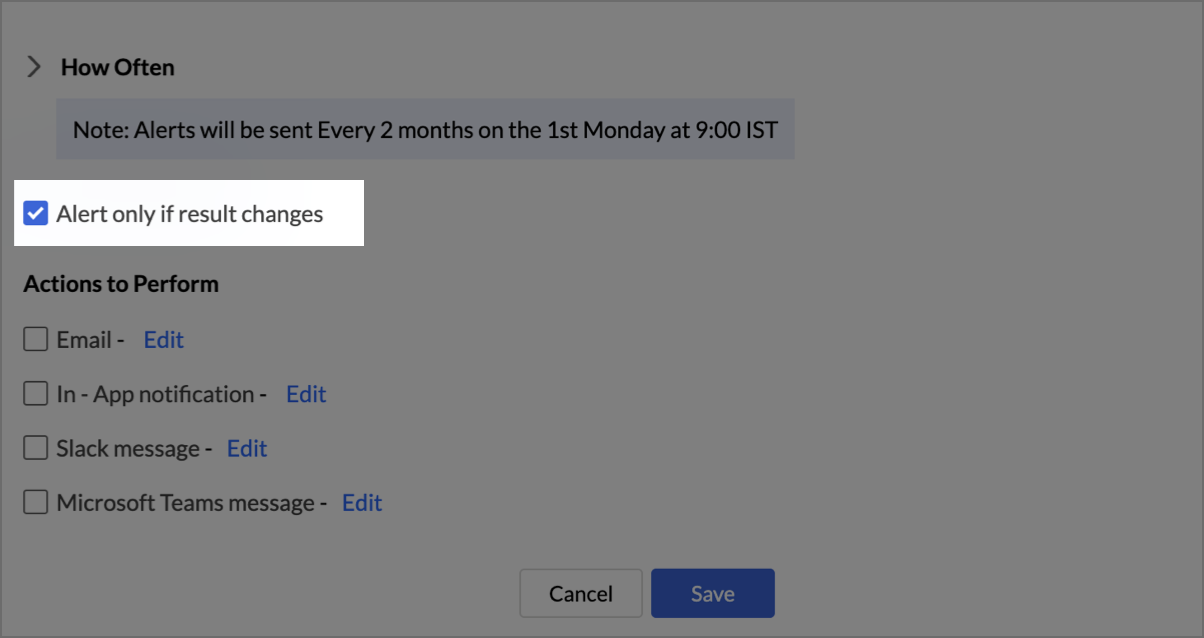
- Select Alert only if result changes if you want to be notified only when the outcome differs from the previous check.
- Under Actions to Perform, select the notification channels you want and click Edit beside each to configure it.
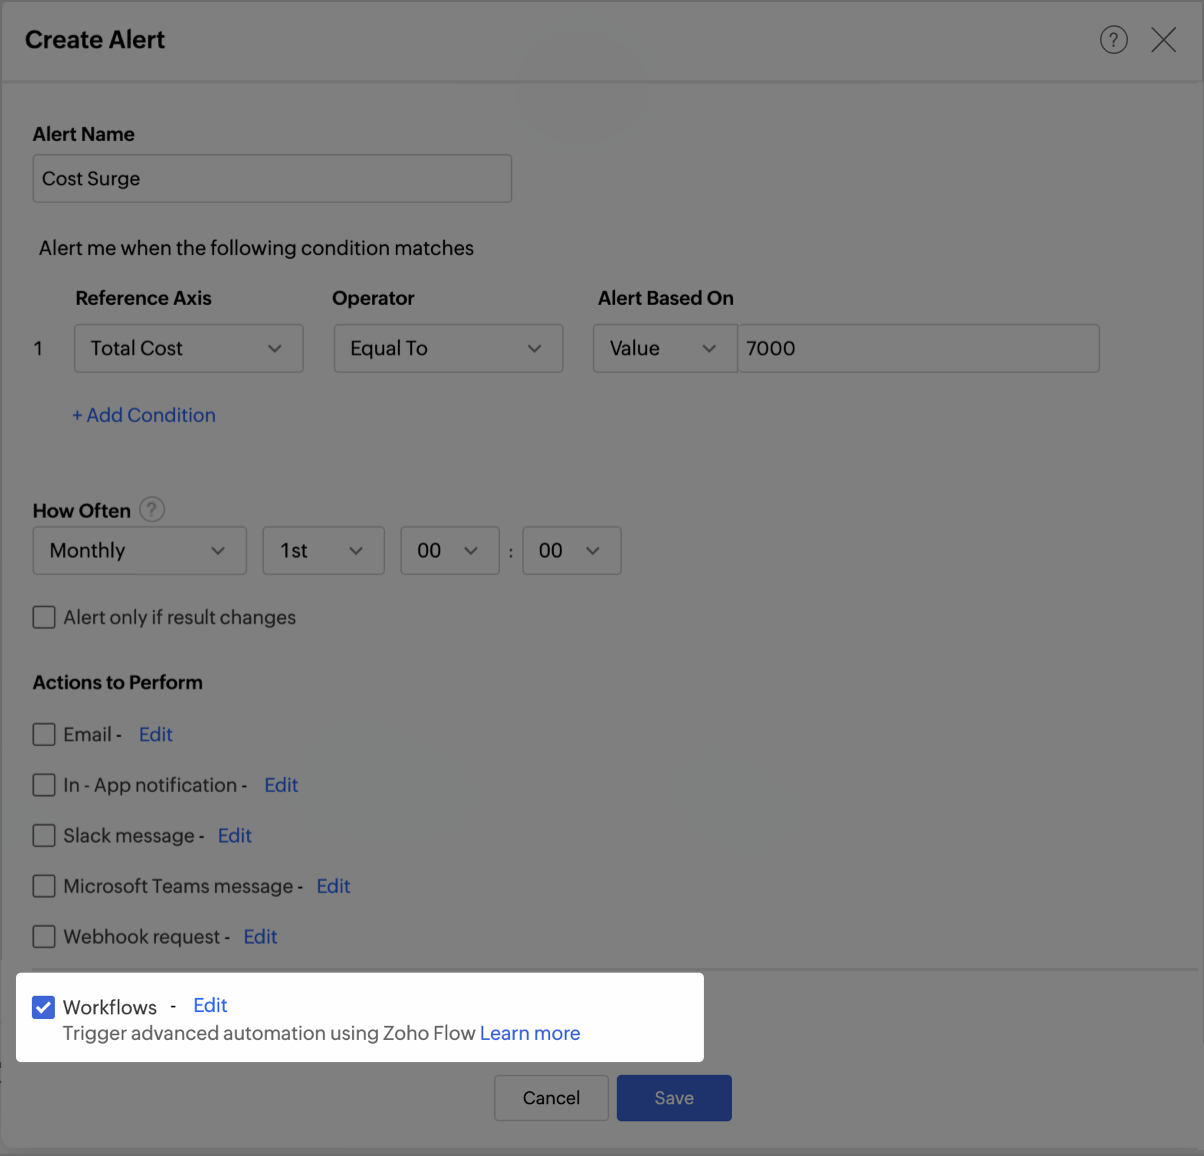
- To run an automation pipeline when the alert fires, select Workflows and click Configure.
- Click Save.
Defining Alert Conditions
Anatomy of a Condition
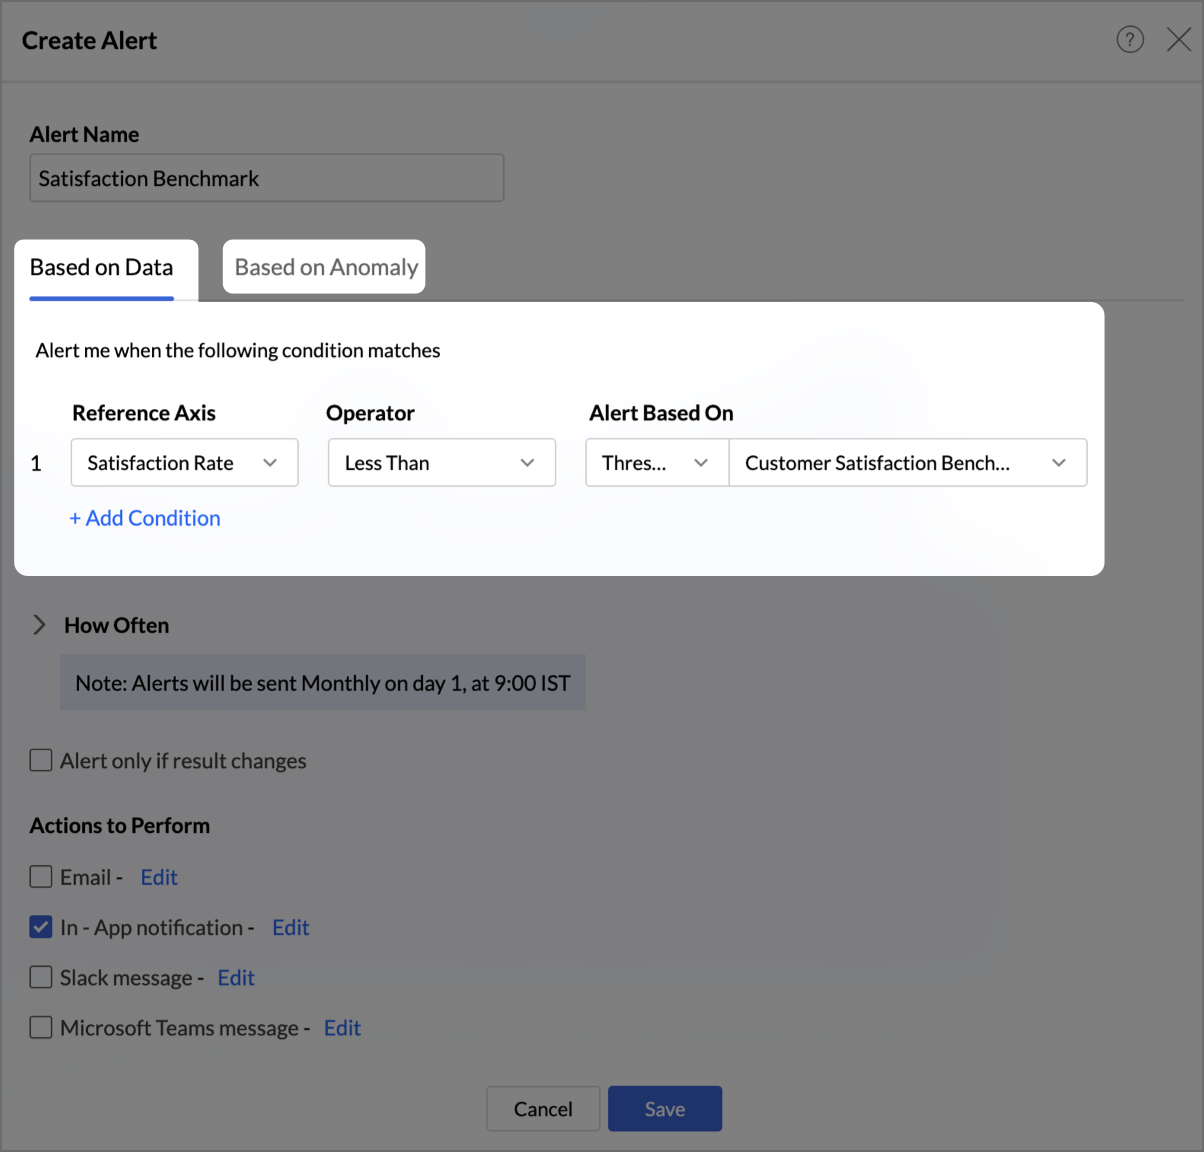
Each condition is a single row made up of three fields:
- Reference Axis: The column to evaluate. The dropdown lists the columns used in the report along with the function applied to each.
- Operator: The comparison to apply. The available operators change with the data type of the selected column.
- Alert Based On: What the column is compared against. This is a mode selector, described below.
- Click + Add Condition to add further rows. Every condition in the list must be satisfied for the alert to trigger.
Alert Based On
Alert Based On determines what the selected column is measured against. It offers two modes - Data (Value, Column, Threshold), and Anomaly.
Based on Data
Value
Compare the column against a value you supply. Select or enter the value in the Choose Values field. This is the default mode and covers most alerts, such as notifying you when total sales fall below a fixed figure.
Threshold
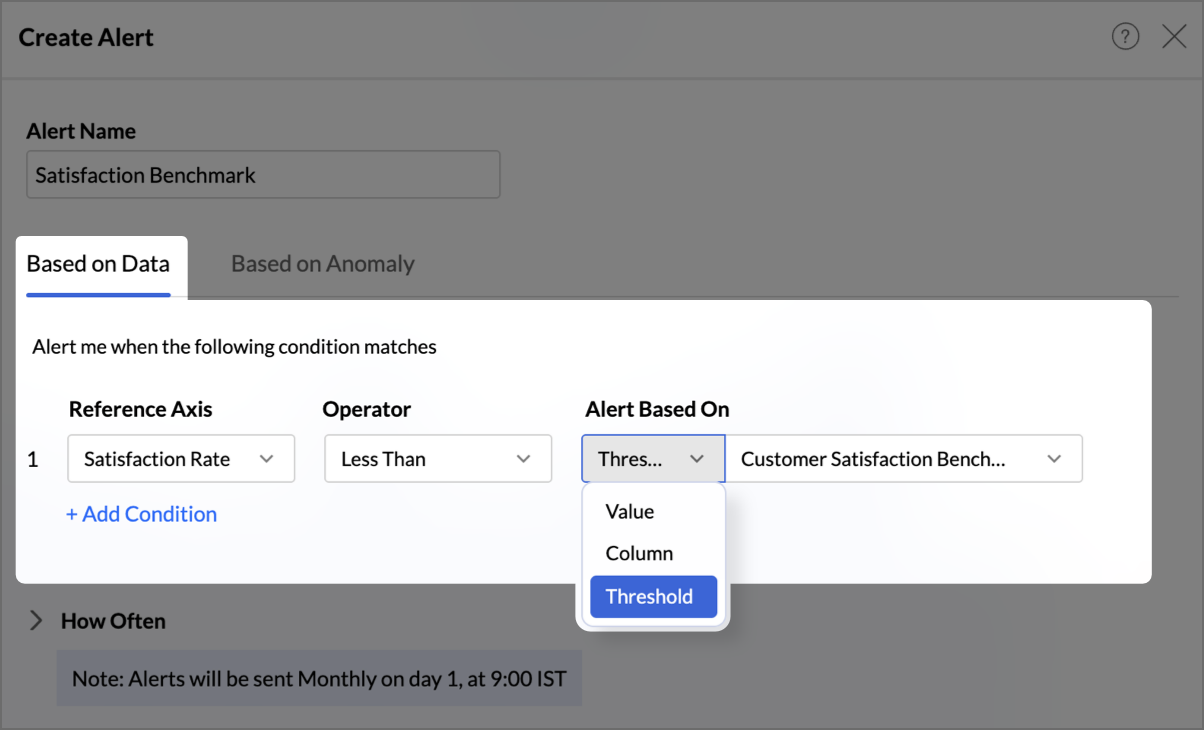
Compare the column against a threshold already defined on the view. A threshold is a predefined benchmark or limit, and this mode lets an alert reuse it instead of restating the number.
- The view must already have a threshold configured. Refer to Customizing a Chart to add one.
- When you select Threshold, a second dropdown appears listing the thresholds available on the view. Select the one to compare against.
Based on Anomaly
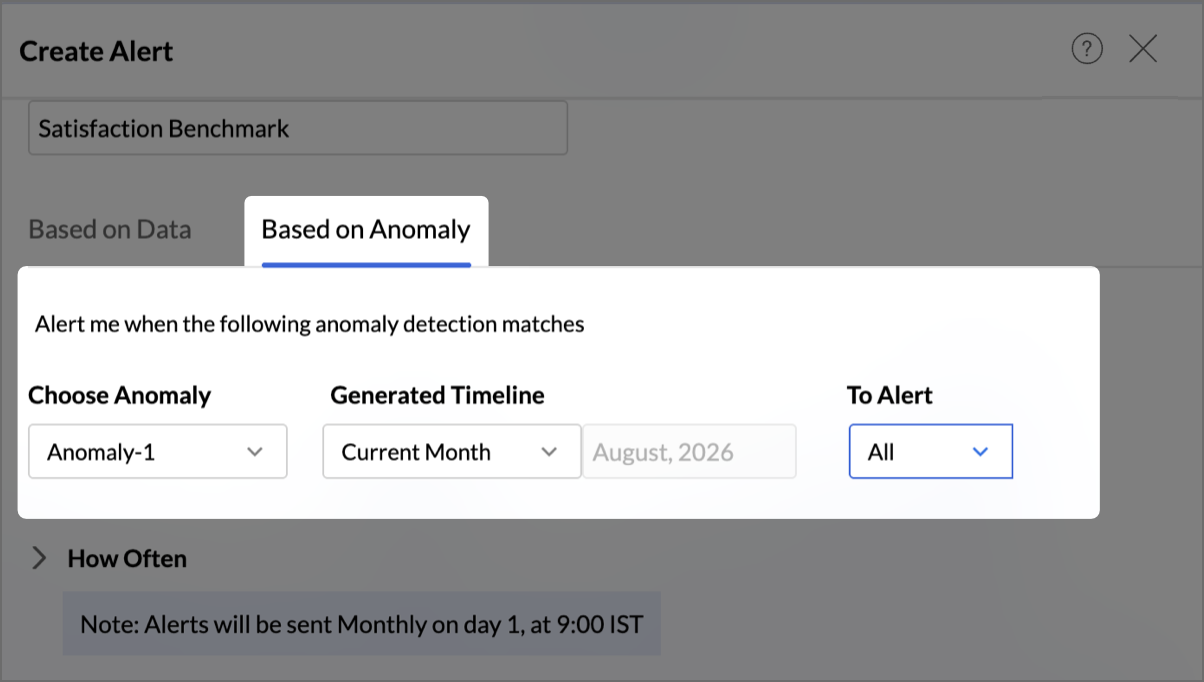
Trigger the alert when anomaly detection on the view flags an outlier. An anomaly is a data point that deviates significantly from the expected pattern, and is often the earliest signal of an issue worth investigating.
- The view must already have anomaly detection configured. Refer to Anomaly Detection to set it up.
- Select the anomaly to monitor, then set the Generated Timeline and To Alert options.
The options available depend on the data on the X-axis:
- X-axis with date values: Choose the Generated Timeline based on the date values present. To Alert offers All or Top, and selecting Top lets you alert on the top 1, 2, or 3 anomalies only.
- X-axis without date values:Generated Timeline and To Alert are both fixed to All and cannot be changed.
Conditions in Charts
In a chart, each data series is a data group, and the alert fires when any series satisfies every condition. Adding conditions narrows the set of series that qualify.
Consider a chart of sales across years by product category:
- One condition on the measure alone. Setting Total Sales to Greater Than Equal 200,000 triggers the alert when any product category in any year reaches that figure.
- Adding a time condition. Adding Year of Date Contains 2018 restricts it to any product category, in 2018 only.
- Adding a category condition. Adding Product Category Contains Furniture restricts it further to Furniture in 2018.
Conditions can also span multiple measures. On a chart plotting sales against cost, setting Total Sales to Less Than 150,000 and Total Cost to Greater Than 50,000 identifies periods where cost ran high while sales fell short. Adding a Year of Date condition narrows that to a specific year.
On map charts, each bubble is a data group. Setting Total Sales to Greater Than Equal 100,000 triggers the alert when any product in any country reaches that figure. Selecting multiple text values within a single condition evaluates them as an OR, so choosing three products alerts on whichever of them qualifies.
Conditions in Pivot Tables
A Pivot Table contains several levels of aggregation, so the Alert Based On field first asks which level to evaluate: the grand summary, a subtotal, or the data cells.
Grand Summary
Conditions are matched against the grand summary of the Pivot Table and can use only the columns dropped in the Data shelf. Use this to monitor an overall figure, such as alerting when grand total sales fall below 500,000.
Subtotal
Conditions are matched against row summaries, column summaries, or a combination of both. Set the Row and Column dropdowns to choose which subtotal to evaluate, using None for the axis you do not want to include.
The columns available for conditions depend on the subtotal you select:
- A single row subtotal. Setting Row to Region and Column to None evaluates the Region subtotals, and conditions can use Region and the measure.
- A second-level row subtotal. Setting Row to Product Category and Column to None evaluates the Product Category subtotals. Because Product Category sits beneath Region, conditions can also filter on Region.
- A single column subtotal. Setting Row to None and Column to Year of Date evaluates the Year subtotals, and conditions can use Year of Date and the measure.
- A second-level column subtotal. Setting Row to None and Column to Quarter of Year of Date evaluates the quarterly subtotals, and conditions can also filter on the preceding Year grouping.
- A row and column combination. Setting Row to Region and Column to Year of Date evaluates the Region subtotal within each Year, and conditions can use Region, Year of Date, and the measure.
Note: A combination that resolves to the same granularity as an individual data cell is not permitted. In a pivot grouped by Region and Product Category across Year and Quarter, the combination of Product Category and Quarter of Year of Date is unavailable, because its result is identical to the data cell. Use the Data option instead.
Data
Conditions are matched against the individual data cells of the Pivot Table, and can be defined using every column involved in the report. Use this for the most granular monitoring, such as alerting when any product category in any region records no sales in any quarter.
Conditions in Summary Views
A Summary View has a single data cell as its data group, and conditions are matched directly against it. Configuration is identical to a chart.
Setting the Verification Schedule
The How Often section controls when Zoho Analytics evaluates your conditions. Expand it to configure the schedule.
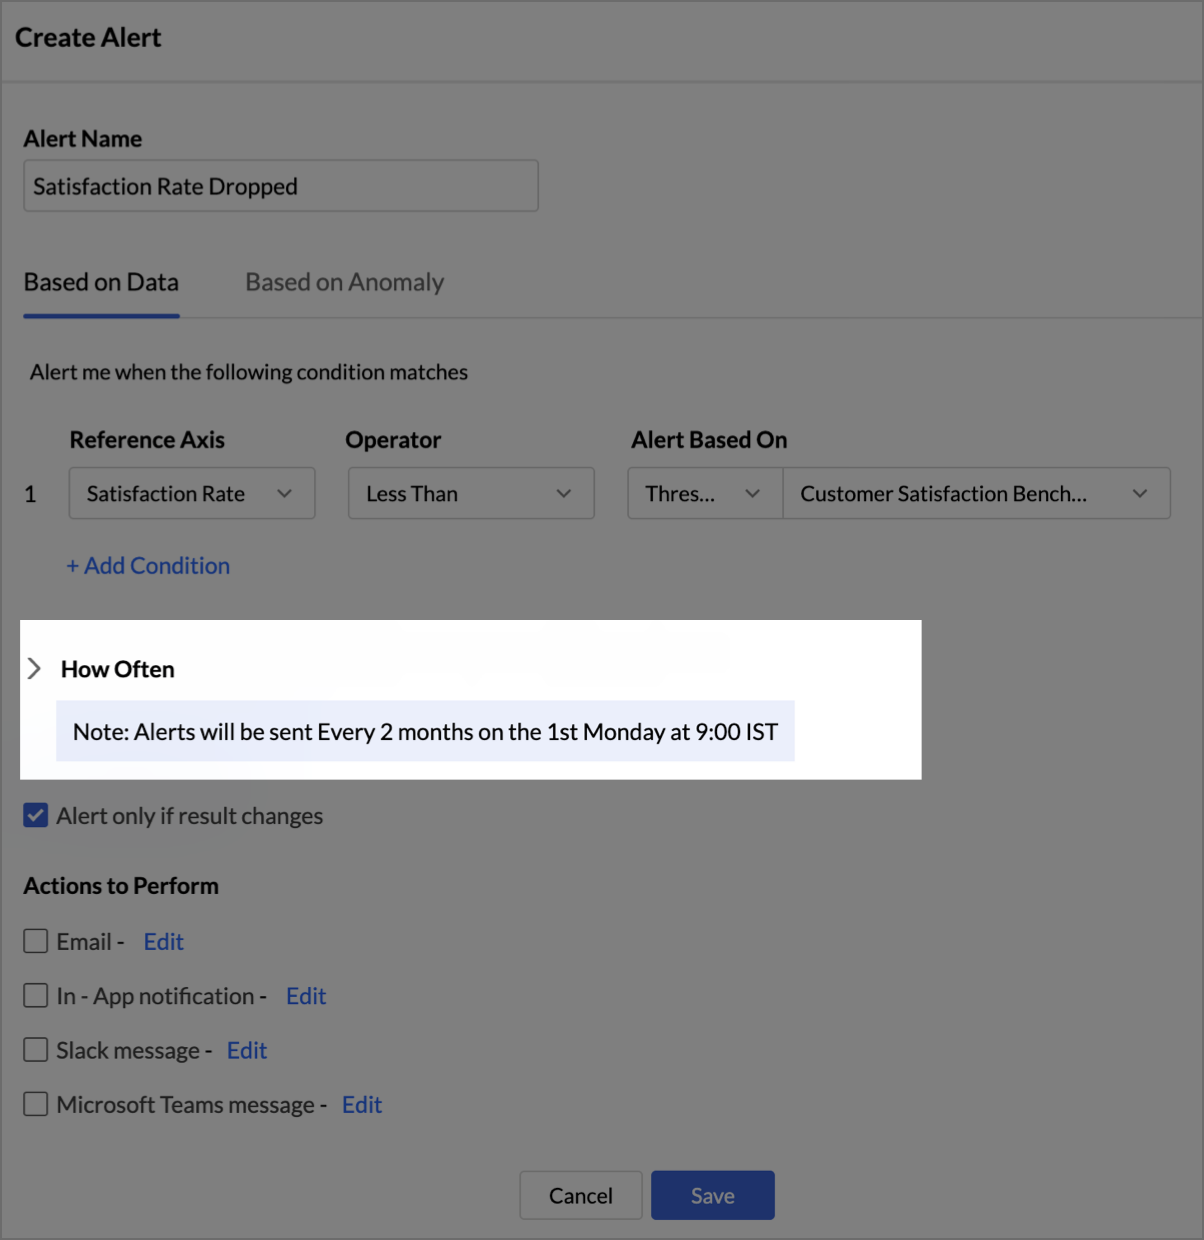
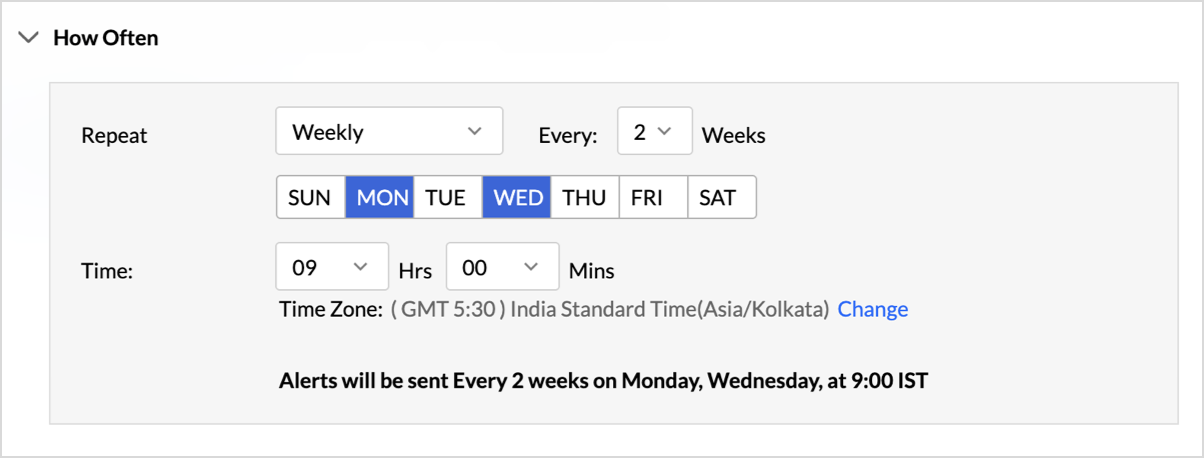
Regardless of the frequency you select, the block ends with a plain-language summary of the resulting schedule, such as Alerts will be sent Every 2 weeks on Tuesday, at 9:00 IST. Use it to confirm your configuration before saving.
All schedules run in the time zone shown beside Time Zone. This defaults to your account time zone. Click Change to set a different one for this alert.
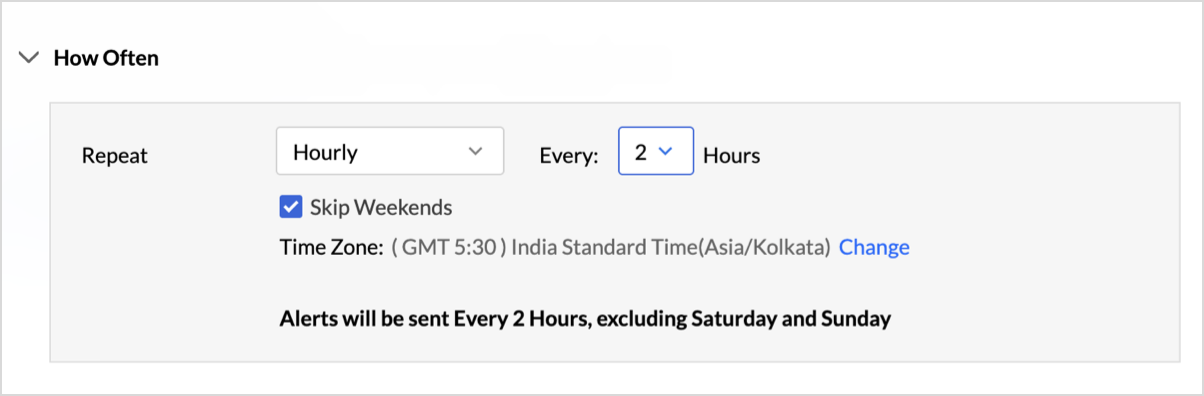
Hourly
- Every: 1, 2, 3, 4, 6, or 12 Hours
- Skip Weekends: Select this to suspend verification on Saturday and Sunday
Daily
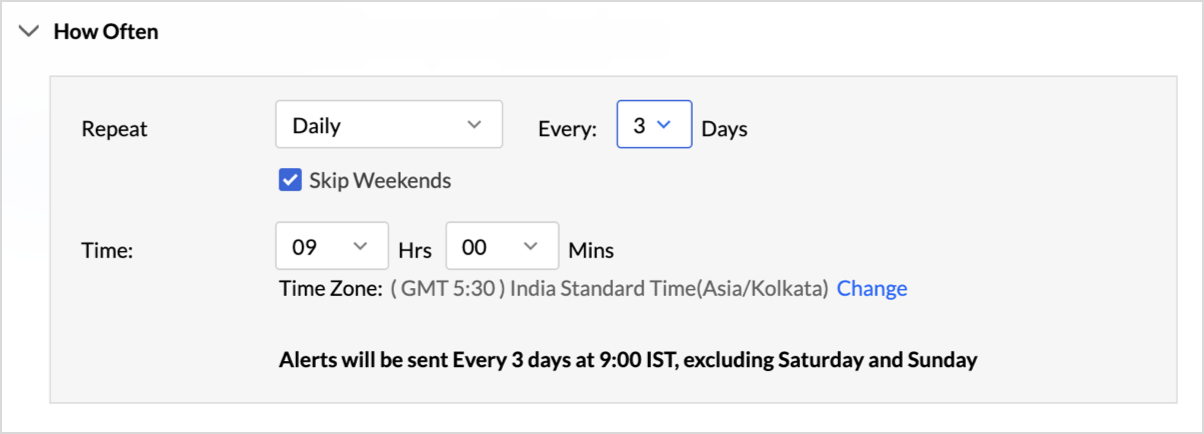
- Every: 1 to 7 Days
- Skip Weekends: Select this to suspend verification on Saturday and Sunday
- Time: The hour and minute at which verification runs
Weekly
- Every: 1 to 4 Weeks
- Day: Select the day of the week from SUN through SAT
- Time: The hour and minute at which verification runs
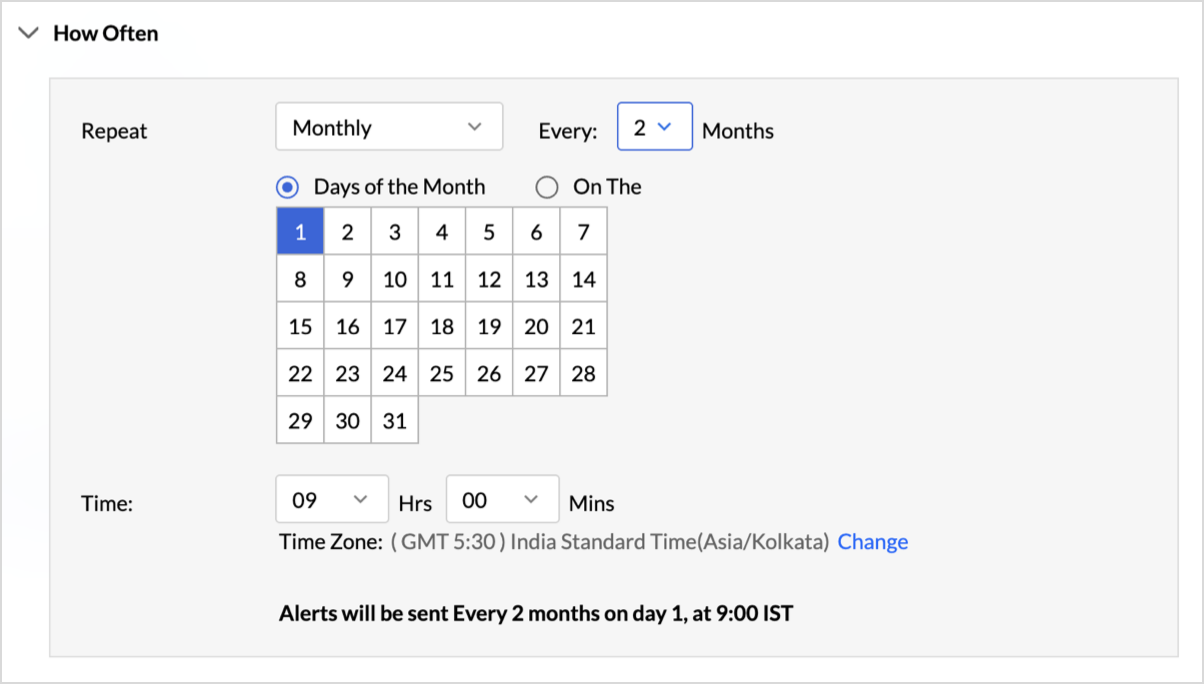
Monthly
- Every: 1 to 12 Months
- Days of the Month: Select a specific date from the calendar grid, from 1 to 31
- On The: Select a relative day instead, by combining an ordinal (1st, 2nd, 3rd, 4th, Last) with a weekday. For example, the 1st Sunday.
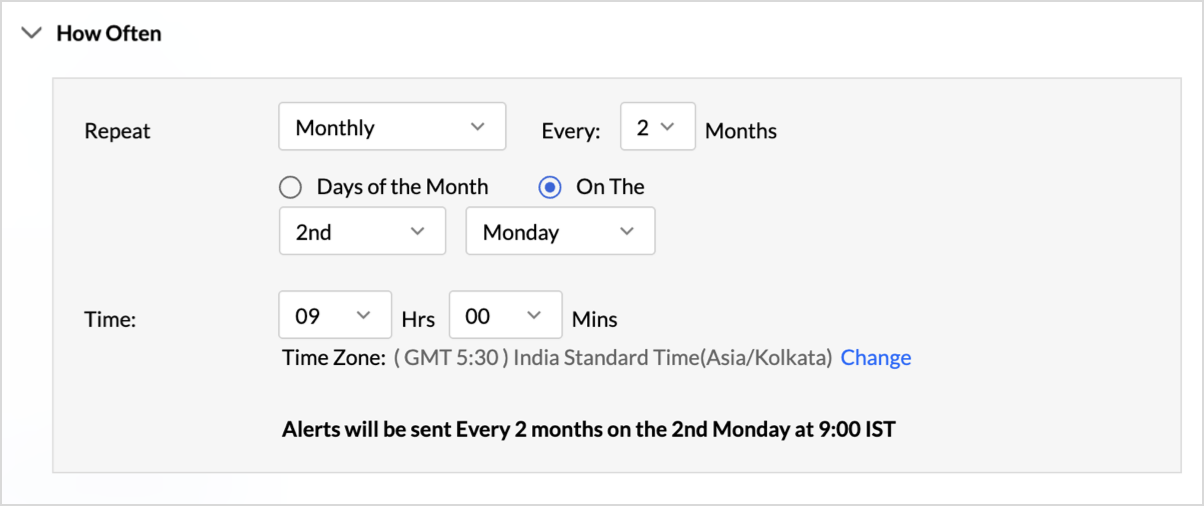
- Time: The hour and minute at which verification runs
Note: Choose either Days of the Month or On The. The two are mutually exclusive.
Yearly
- Every: 1 to 5 Years
- Month: Select the month from the Jan to Dec grid
- On The: Combine an ordinal (1st, 2nd, 3rd, 4th, Last) with either Day or a specific weekday. Selecting Day resolves to a calendar date, so 1st and Day gives the 1st of the selected month. Selecting a weekday gives a relative day, such as the 1st Sunday of the month.
- Time: The hour and minute at which verification runs
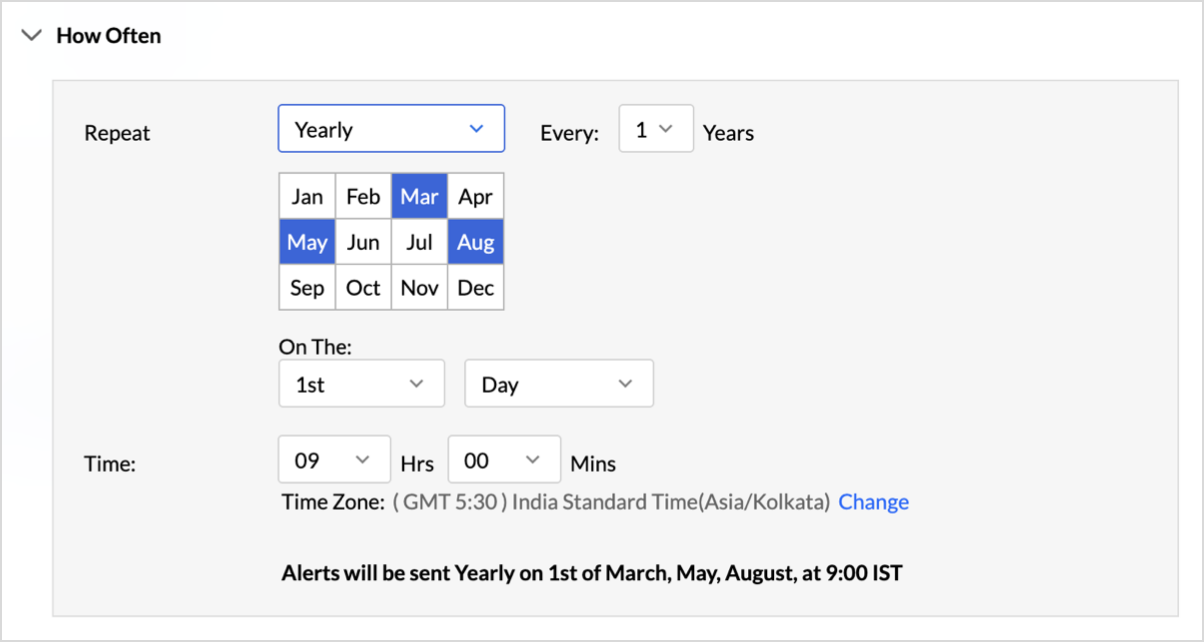
Note:Skip Weekends is available for Hourly and Daily schedules only. Yearly schedules offer On The alone and do not include a Days of the Month option.
Suppressing Repeat Alerts
A condition that stays true will be met at every scheduled check, and by default each check that finds it met sends a notification. On an hourly schedule this can mean the same message arriving repeatedly for a situation you already know about.
Select Alert only if result changes to send a notification only when the result of a verification differs from the result of the previous one. If the outcome is unchanged, the alert does not notify, even though the conditions are still met.
Use this for alerts that watch a persistent state, and leave it clear for alerts where every occurrence matters.
Configuring Alert Actions
The Actions to Perform section defines what happens when the conditions are met. Select the checkbox for each channel you want, then click Edit beside it to configure the details. You can enable any combination of channels on a single alert.
The supported channels are:
- In-App notification
- Slack message
- Microsoft Teams message
- Webhook request
Alert emails can be sent to administrators, to individual contacts, and to workspace groups.
Recipients
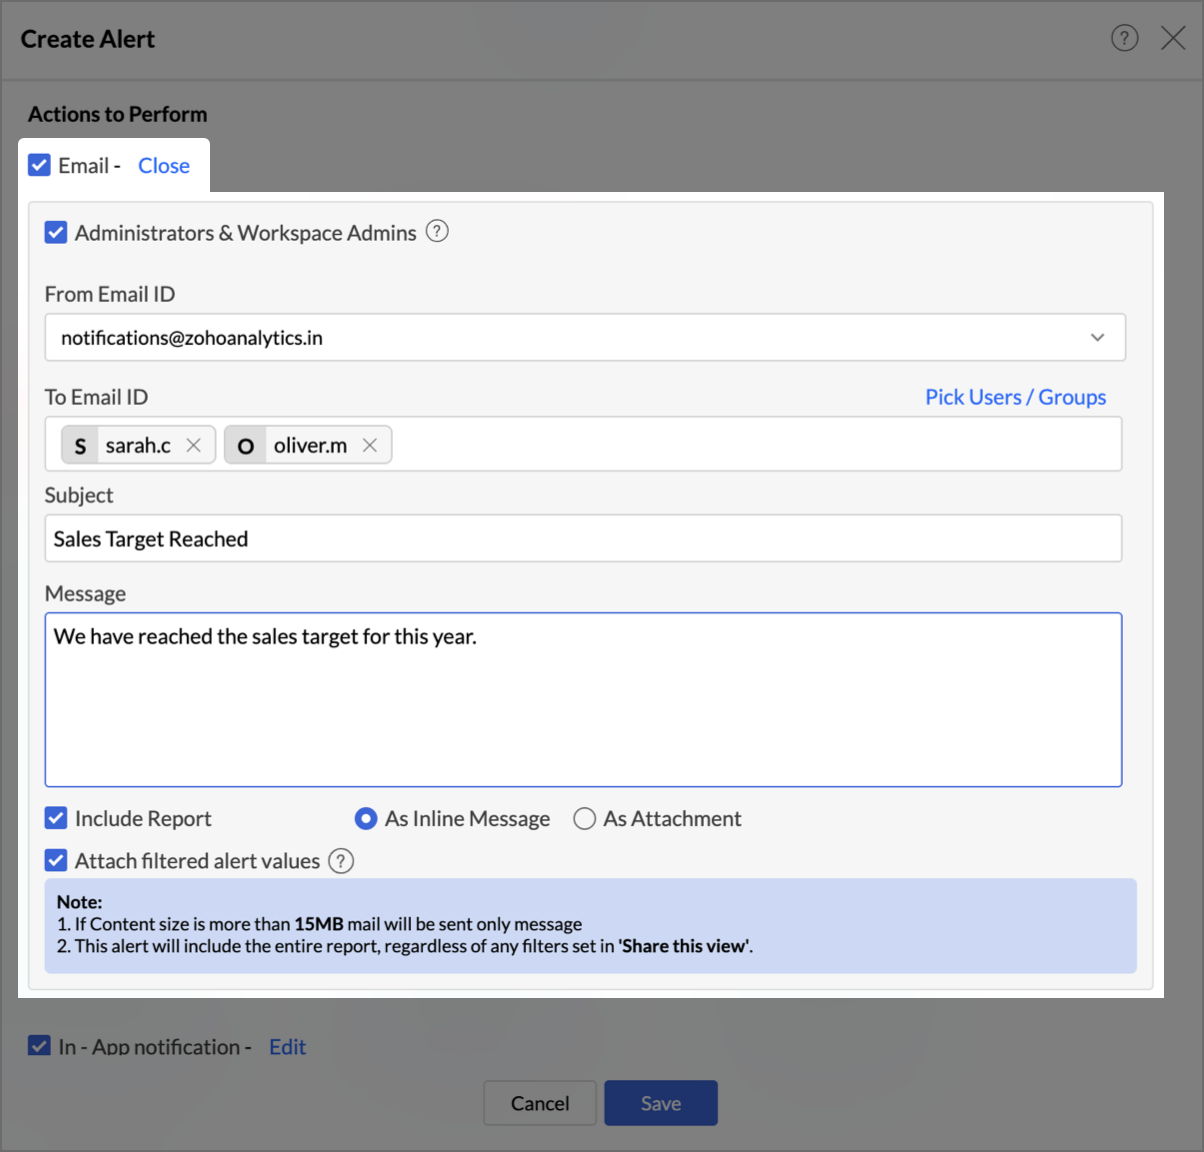
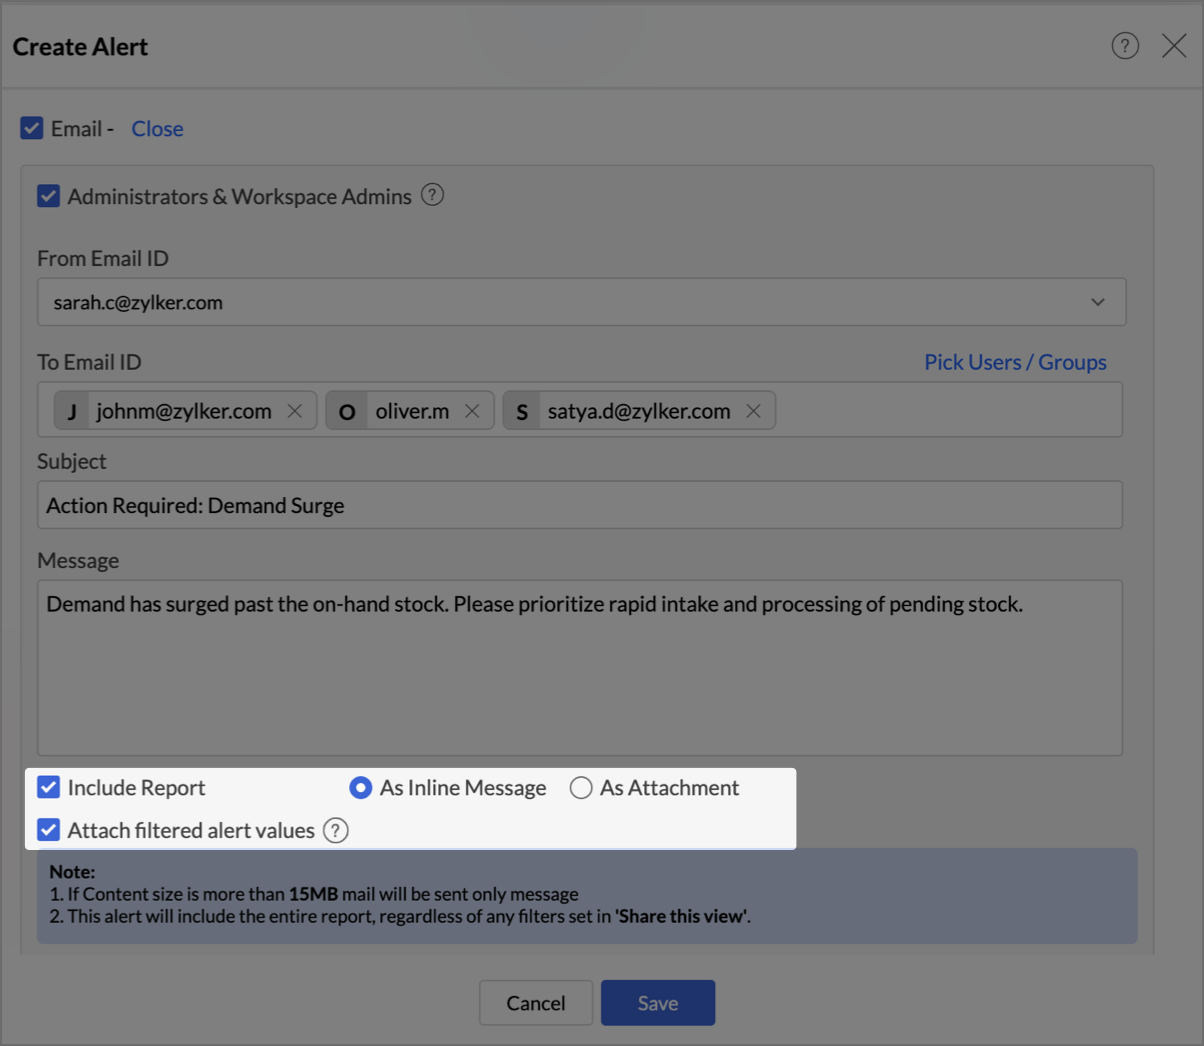
- Administrators & Workspace Admins: Select this to automatically include the Account Administrator, Organization Administrators, and Workspace Administrators, without listing them individually.
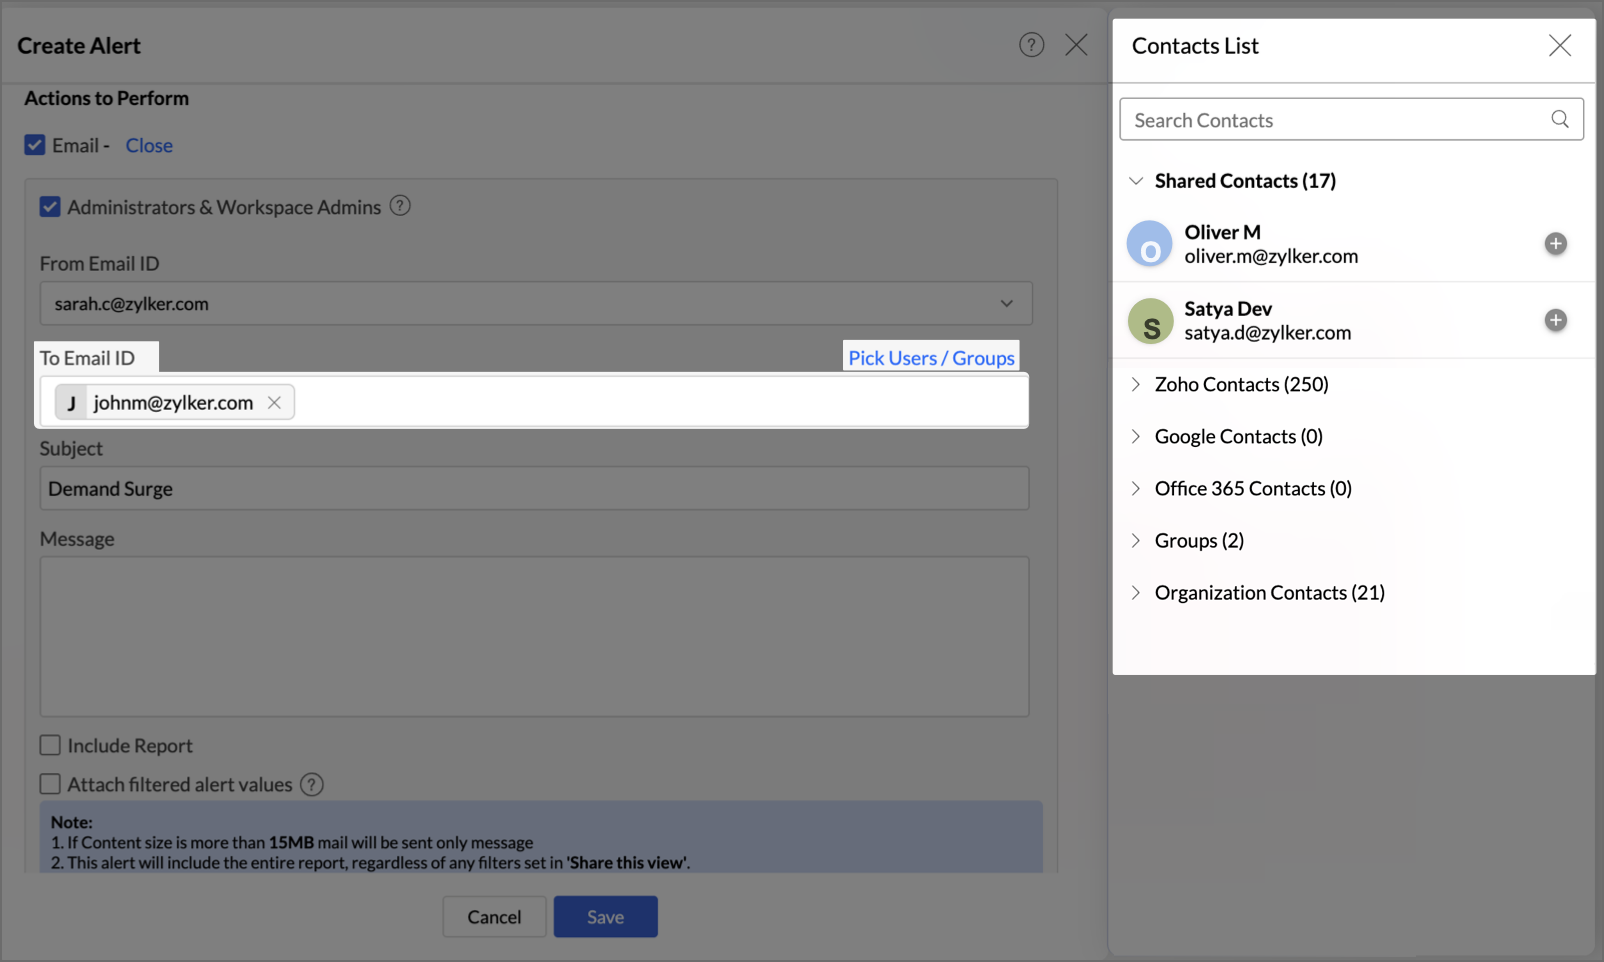
- To Email ID: Add further recipients here. Each one appears as a chip, showing a photo or avatar with the name for individual contacts, and a group icon with the group name for groups. Click the X on a chip to remove it.
There are two ways to add recipients:
- Type directly. Enter an email address, and suggestions appear as you type. Invalid addresses are highlighted in red and must be corrected before the alert can be saved.
- Use the contact picker. Click Pick Users / Groups to open a panel listing contacts in collapsible categories, each showing the count of available items: Shared Contacts, Zoho Contacts, Google Contacts, Office 365 Contacts, Groups, and Organization Contacts. Click a contact, use the + icon, or drag and drop it onto the To Email ID field. Use the search bar at the top to filter by name or email across all categories. Duplicate addresses are blocked at the point of selection, and unauthenticated sources such as Google Contacts or Office 365 prompt you to authenticate.
Note: All members of a selected group receive the alert. Membership is resolved when the alert is sent, so adding or removing members later does not require any change to the alert. If a group is deleted from Workspace Settings, it is removed from the recipient list automatically.
From Email ID
Select the address Zoho Analytics uses to send the alert:
- Your personal email address
- Your organization's admin email address
- notifications@zohoanalytics.com, the shared Zoho Analytics sender address
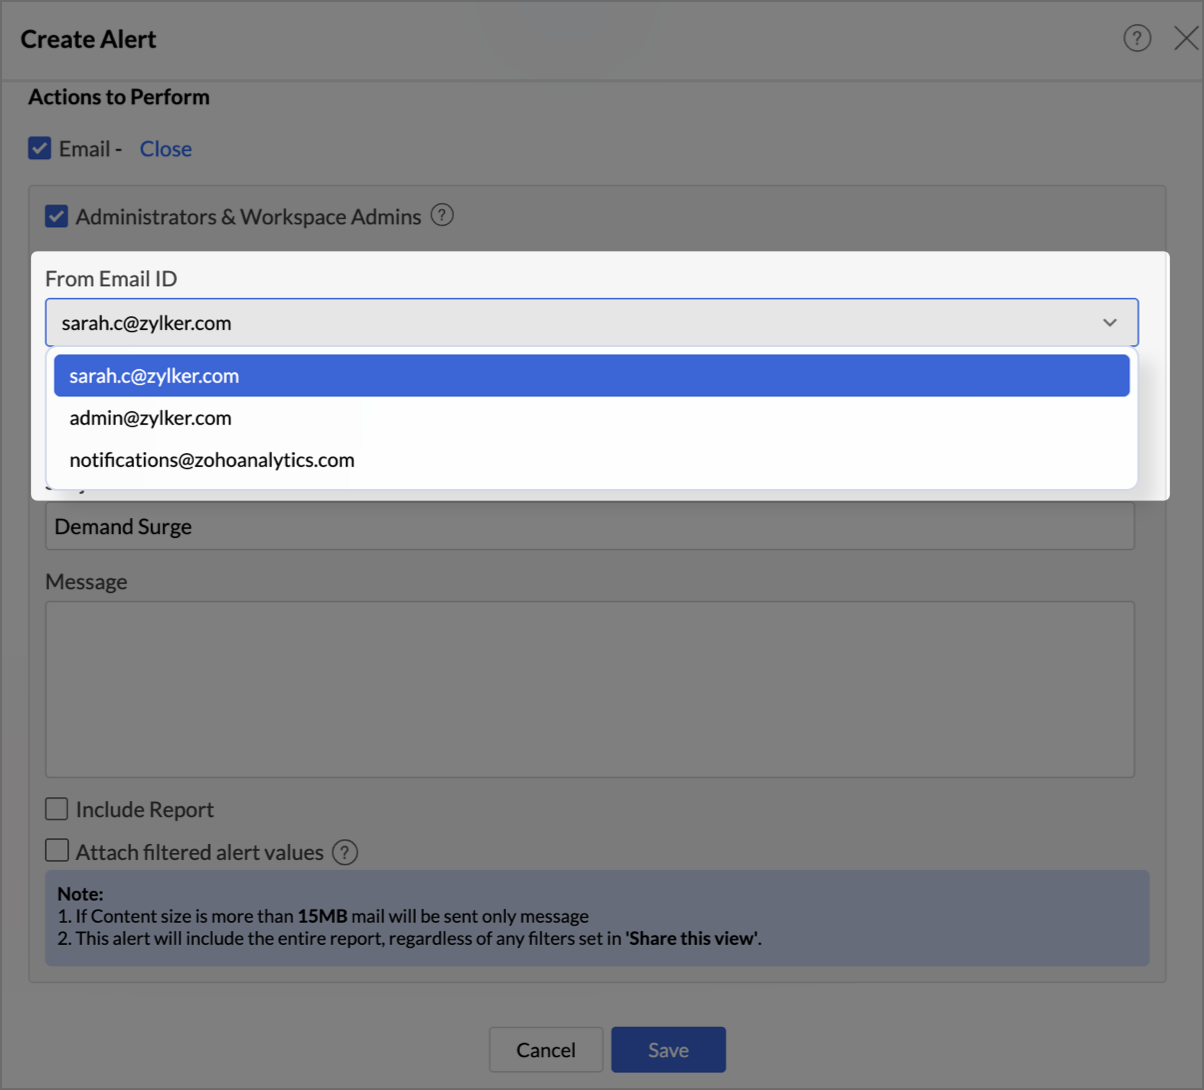
If your recipients have DMARC configured and you want to send from a personal or organization address, that domain must be validated first. An unvalidated domain is flagged with a Domain not validated warning beside the field. Refer to Email Settings to validate Zoho Analytics as an authorized sender for your domain.
Content
- Subject and Message: The text of the notification email.
- Include Report: Adds the report itself to the email, either As Inline Message, which embeds the report view in the body, or As Attachment, which attaches it as a file.
- Attach filtered alert values: Attaches a CSV containing only the rows that matched the alert conditions, using the current view's columns with headers included. This works independently of Include Report, so both can be active and the email will carry the report view and the filtered CSV together. It is supported on Charts, Pivot Tables, and Summary Views.
Note:
- If the total content of an alert email exceeds 15 MB, only the message is sent and the report or attachment is dropped.
- An alert email includes the entire report, regardless of any filters applied under Share this view.
In-App Notification
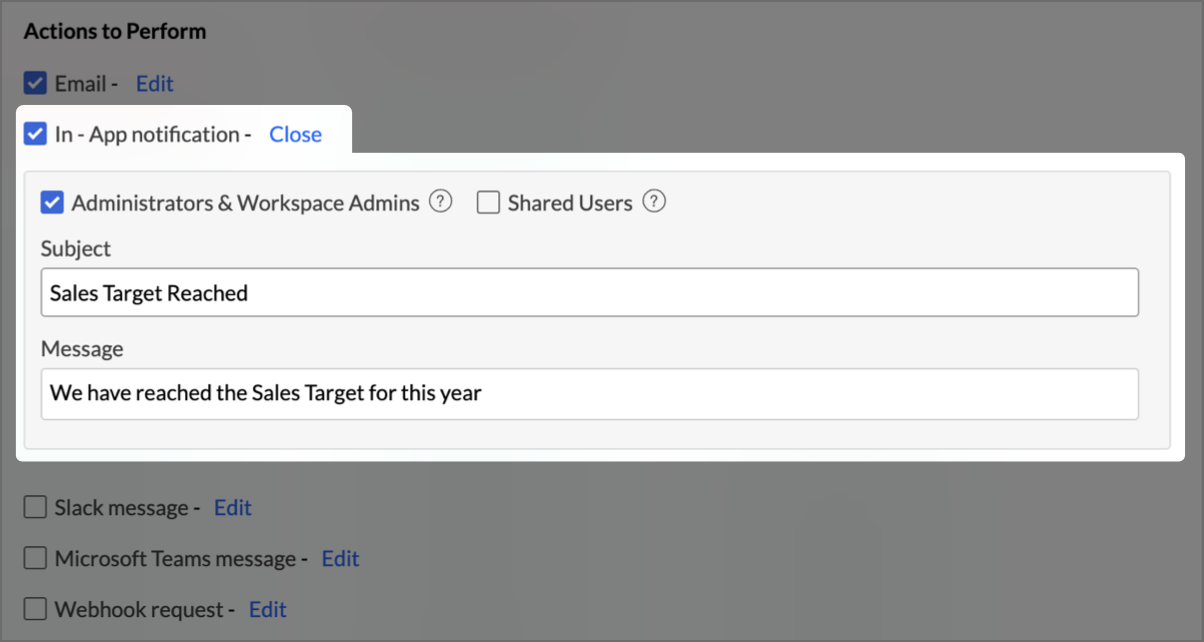
An in-app notification appears within Zoho Analytics itself. Select the recipients and enter the notification text.
- Administrators & Workspace Admins: Notifies the Account Administrator, Organization Administrators, and Workspace Administrators.
- Shared Users: Notifies the users the report has been shared with.
- Subject and Message: The text shown in the notification.
Slack Message
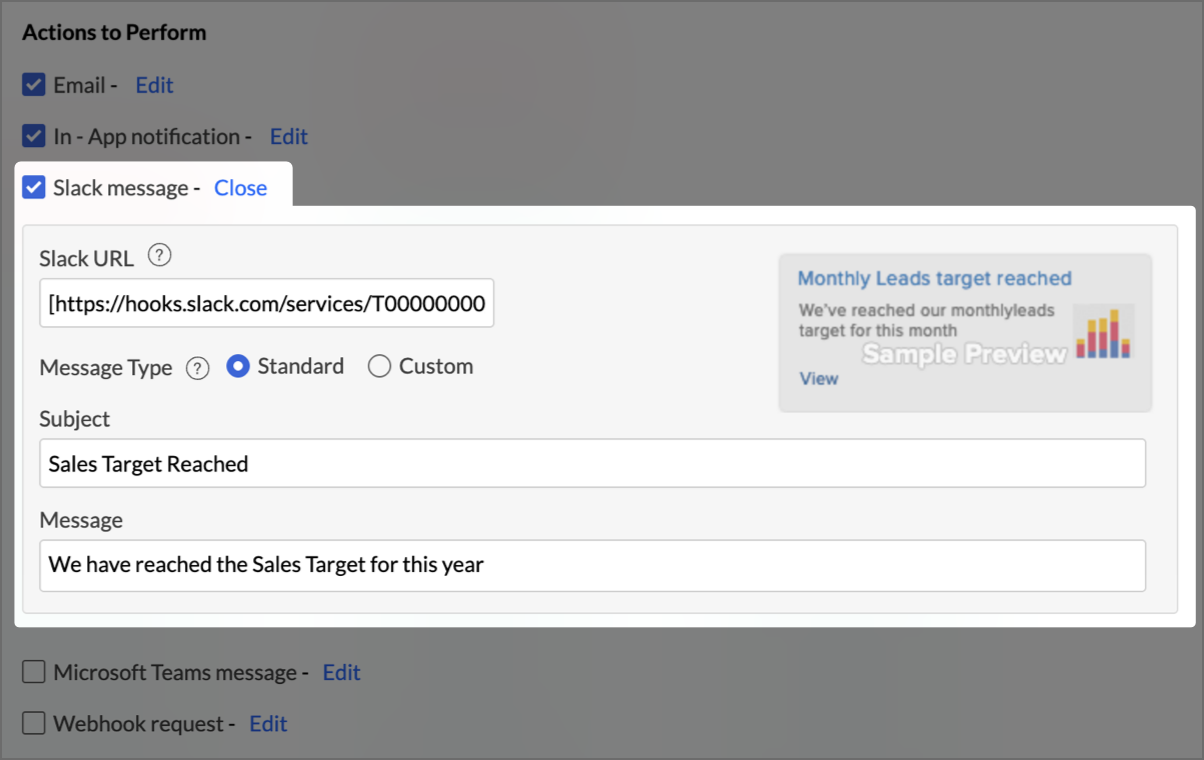
Posting to Slack requires an incoming webhook created on the Slack side.
- In Slack, create an Incoming Webhook for the channel where the alert should be posted, and copy the URL.
- In the Slack message section, paste it into the Slack URL field.
- Select the Message Type:
- Standard: Zoho Analytics formats the message for you. Enter the Subject and Message, and the preview panel shows how the posted card will look.
- Custom: Construct the message yourself in JSON format for full control over the posted content.
Microsoft Teams Message
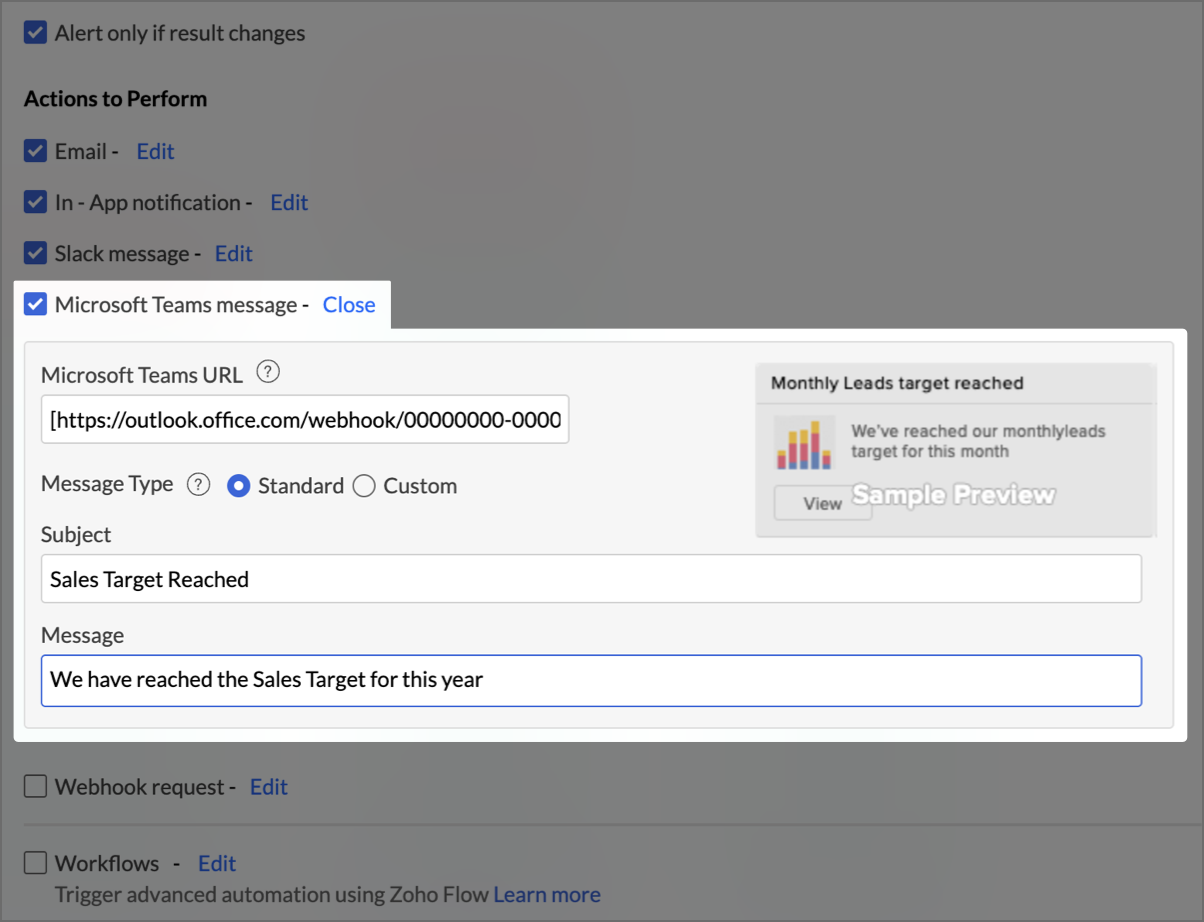
Microsoft Teams is configured the same way as Slack.
- In Microsoft Teams, create an Incoming Webhook for the target channel and copy the URL.
- Paste it into the Microsoft Teams URL field.
- Select the Message Type, Standard or Custom, and enter the Subject and Message. The preview panel shows the resulting card.
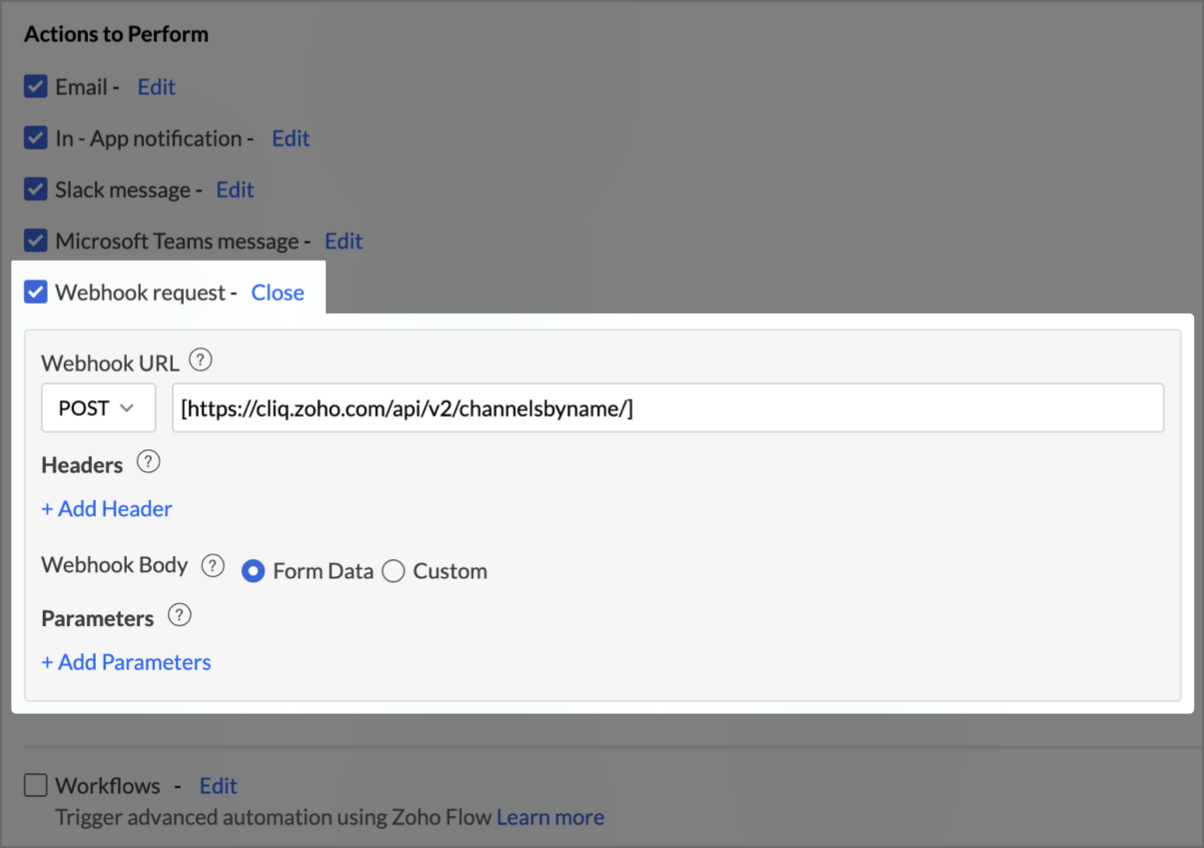
Webhook Request
A webhook posts the alert to any application that accepts an HTTP request. Use it to reach services that are not directly supported as channels.
- Webhook URL: Select the method (POST, PUT, or PATCH) and enter your application's webhook URL or API endpoint.
- Headers: Click + Add Header to specify HTTP headers. This is optional.
- Webhook Body: Choose how the alert content is sent.
- Form Data: Supply the message as name and value pairs.
- Custom: Supply the message as a request body payload.
- Parameters: Click + Add Parameters to define the name and value pairs that carry the alert message when Form Data is selected.
Triggering Workflows
A notification tells someone that something changed. A workflow does something about it.
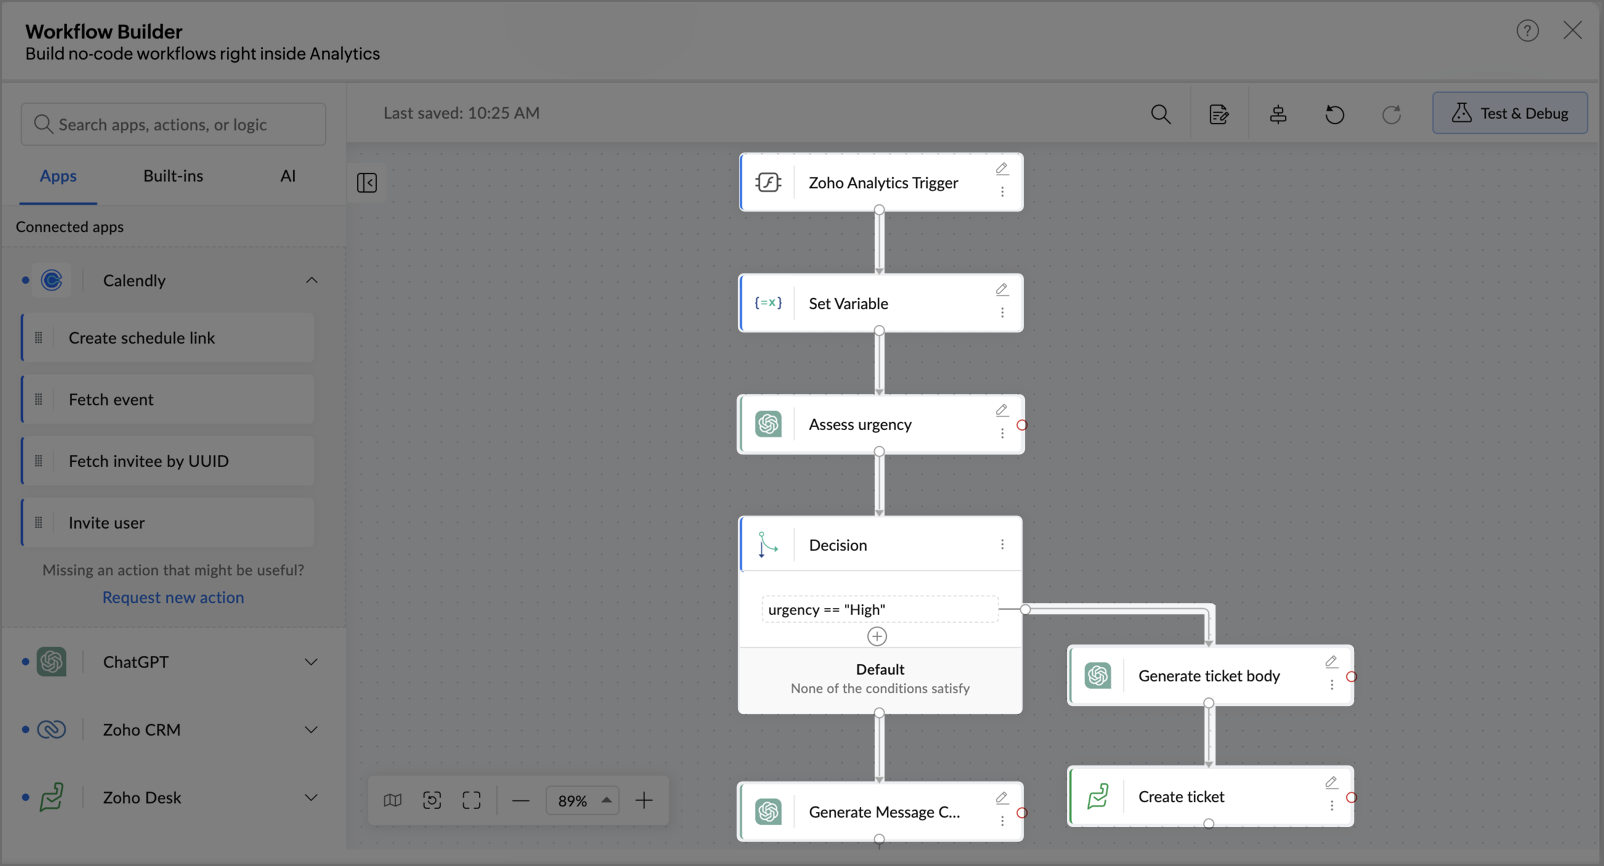
Select Workflows under Actions to Perform and click Configure to open the embedded Zoho Flow builder directly inside Zoho Analytics. From a visual, drag-and-drop canvas you can build a complete automation pipeline that runs the moment your alert conditions are met, without writing code or leaving Analytics.
Workflows let you:
- Run a full pipeline, not a single action. Chain multiple steps across CRM updates, support tickets, notifications, and more, executing in sequence.
- Connect a broad app library. Reach more than 1,000 applications across CRM and sales, customer support, marketing, project management, finance, HR, and collaboration tools.
- Add logic and intelligence. Use built-in controls such as conditional branching, variables, delays, and if-else paths, along with AI utilities that classify, summarize, and route based on context.
- Test before going live. Validate each step in test mode, then activate the workflow from within Zoho Analytics.
- Govern what runs. Approval checkpoints, real-time monitoring, retry logic, and a full run history keep automated pipelines auditable.
For the complete guide to the workflow builder, the connector library, and workflow governance, refer to Workflow Orchestration.
Managing Data Alerts
All alerts can be managed from two places.
- From the report: Open the report, click the Alerts icon, and select Manage Alerts. The Manage Alerts page lists every alert created over that report.
- From the workspace: Open Workspace Settings and click the Alerts tab. This lists every alert created anywhere in the workspace.
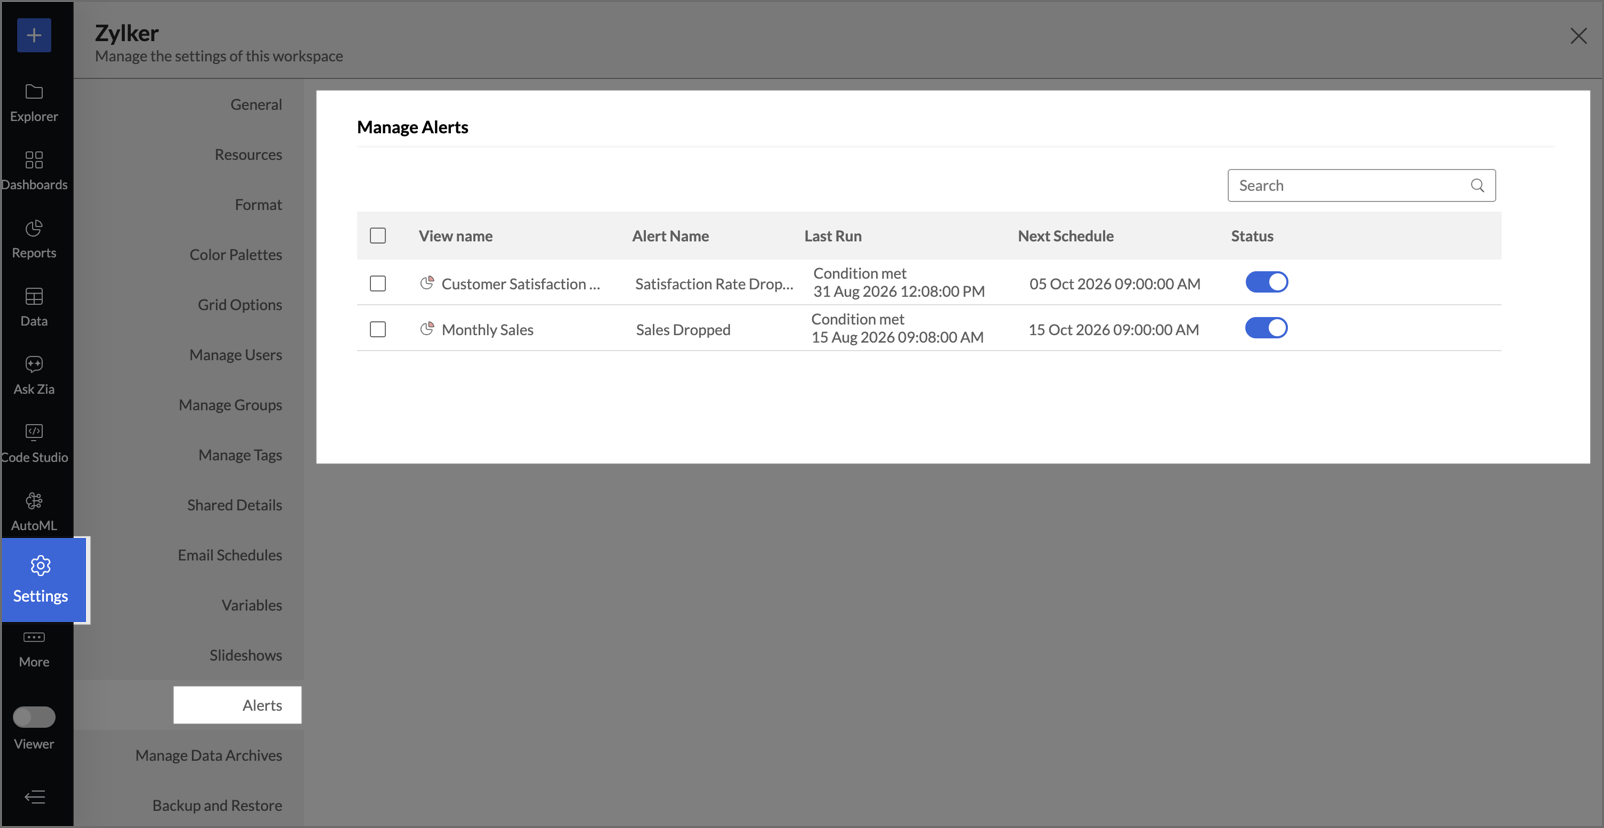
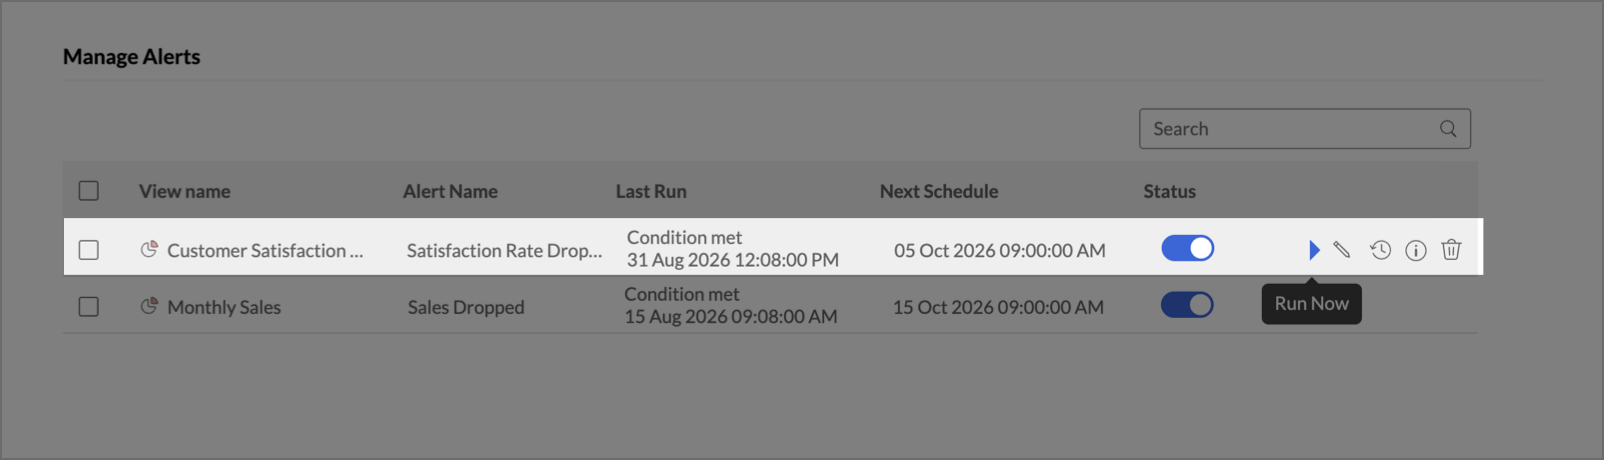
In either list, hover over an alert to reveal its actions:
- Status: Switches the alert between Active and Inactive. An inactive alert stops running and sends no notifications, but retains its full configuration and can be reactivated at any time.
- Run: Verifies the alert conditions immediately, without waiting for the next scheduled check.
- Edit: Opens the alert for modification. Conditions, schedule, actions, and workflows can all be changed.
- View History: Opens a calendar view with triggered days highlighted in red. Click a day to see the run time, the triggered time, and a copy of the report as it was when the alert fired.
- View Alert: Opens the alert configuration in read-only form.
- Delete: Removes the alert. You are prompted to confirm before it is deleted.
Frequently Asked Questions
1. My condition was met, but no alert arrived. Why?
First check that the alert's status is Active on the Manage Alerts page, since an inactive alert does not run at all. Beyond that, conditions are evaluated only at the scheduled verification time, not continuously, so a condition that was met and then reversed between two checks raises nothing. Two settings also commonly cause this: Alert only if result changes, which suppresses notification when the outcome matches the previous check, and Skip Weekends, which pauses verification on Saturday and Sunday for hourly and daily schedules. Use Run on the Manage Alerts page to verify the conditions immediately and confirm they resolve as you expect.
2. Can I create more than one alert on the same report?
Yes. There is no per-report limit. The total number of alerts you can create across your account is governed by your plan.
3. Can I set an alert on a dashboard or a table?
No. Alerts are supported on Charts, Pivot Tables, and Summary Views only. To monitor data in a table, create a report over it first.
4. Why does my alert email contain more data than the version of the report I shared?
Alert emails always include the entire report. Filters applied under Share this view do not carry into the alert. If you need only the matching rows, select Attach filtered alert values, which sends a CSV containing just the data that satisfied the conditions.
5. My alert emails are not reaching recipients. What should I check?
If you are sending from a personal or organization address and your recipients have DMARC configured, the sending domain must be validated first. A Domain not validated warning beside the From Email ID field indicates this has not been done. Either validate the domain through Email Settings, or switch the From Email ID to notifications@zohoanalytics.com.
6. My alert email arrived without the report attached. Why?
Alert email content is capped at 15 MB. If the report or the filtered CSV pushes the email past that limit, the message is sent on its own and the attachment is dropped. Reducing the number of columns or rows in the underlying report usually resolves it.
7. Can I send alerts to people who do not have a Zoho Analytics account?
Yes, for email. Any address can be added to the To Email ID field. In-app notifications are different, as they can only reach administrators and users the report has been shared with.
8. If I add someone to a group after creating an alert, do they receive it?
Yes. Group membership is resolved at the time the alert is sent, so members added later are included automatically and members removed are dropped, with no change needed to the alert.
9. Why can I not select a column in the Reference Axis dropdown?
Alert conditions cannot be defined over columns that use an advanced summary function, or over a View Formula. In Pivot Tables, subtotals whose primary aggregate has been changed using Show Total As are also unavailable.
10. Why is the Threshold or Anomaly option not showing any values?
Both modes reuse configuration that already exists on the view. If the view has no threshold defined, or no anomaly detection applied, there is nothing to select. Add a threshold or set up anomaly detection on the report first, then create the alert.
11. What happens to an alert if the report it monitors is changed?
Editing the report can invalidate an alert whose conditions reference columns that are no longer present. Open the alert from Manage Alerts and review its conditions after any structural change to the report.
12. Can I pause an alert without deleting it?
Yes. Open Manage Alerts and switch the alert's status to Inactive. Verification stops and no notifications are sent, but the conditions, schedule, recipients, and workflow are all retained. Switch the status back to Active to resume.