Automated Machine Learning in Zoho Analytics
Zoho Analytics' automated machine learning offers a code-free experience to build, train, and validate custom ML models of high quality and efficiency. The simple and user friendly low code/ no code interface enables people with varying levels of expertise to build ML models easily and make smart business decisions.
On this Page
- AutoML Models in Zoho Analytics
- Access to AutoML
- Best Practices
- How to Create an AutoML Model
- What If Analysis in AutoML
- Retrain ML models
- Deleting an ML Model
- Algorithms
AutoML Models in Zoho Analytics
Prediction Model
Prediction model is a statistical method used to forecast future outcomes and trends based on historical data. Businesses and industries use predictive models for demand forecasting, price prediction, and fraud detection.
The below are the two main types of prediction models used:
Regression
Regression is a supervised machine learning model that is used for determining the relationship between a dependent and one or more independent variables. It is used for predicting a continuous output based on the input variable and to understand how different factors influence the target variable.
Classification
Classification is a type of machine learning model that is used for classifying data into one or more categories based on the input variable. It is mainly used to identify the class or category to which the new data point will fall under.
Clustering Model
Clustering is a machine learning technique used for grouping data points together based on similarities in their input variables. The goal of a clustering model is to identify patterns and relationships within the data that are not immediately apparent, and group similar data points into clusters.
Access to AutoML
Roles with administrator privileges, such as Account Admin, Org Admin, Workspace Admin, and users with custom permission, can build ML models.
Enabling AutoML
- Access the Organization Settings page.
- Click Controls / Configurations > Feature Controls > DSML.
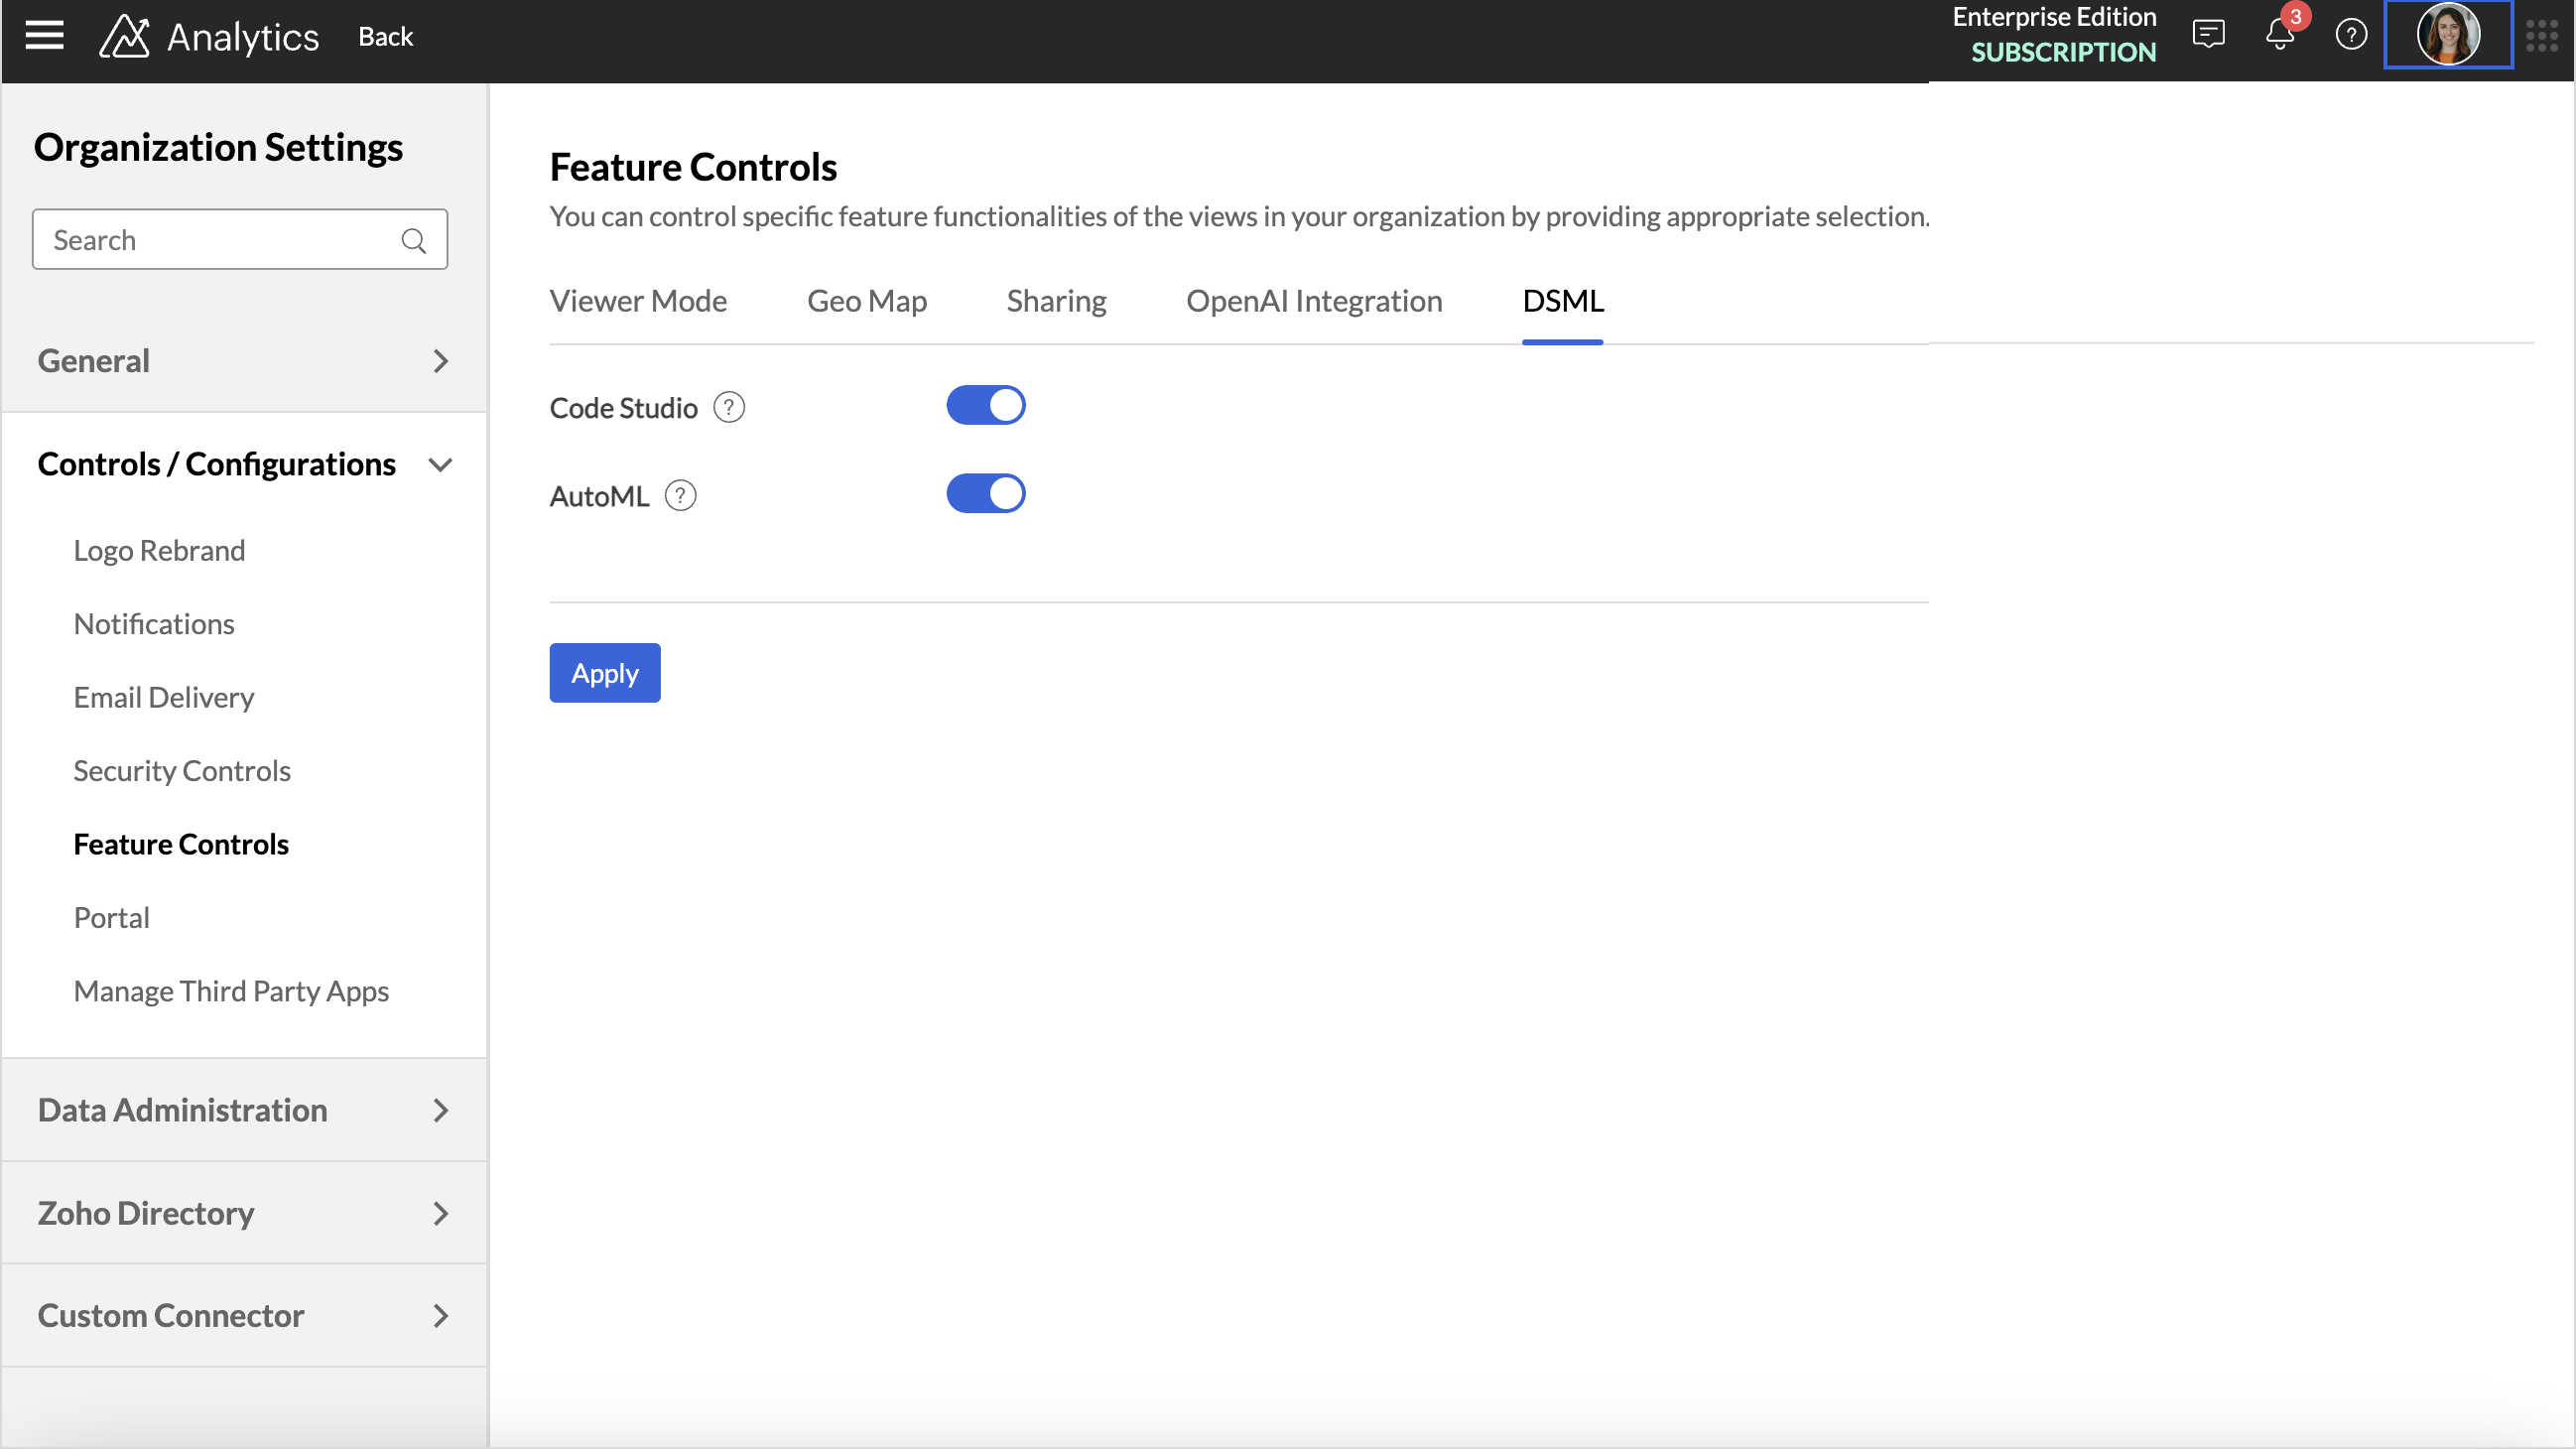
- Enable the AutoML toggle button and click Apply.
Best Practices
Clearly define the business problem for which you seek to build an ML model. Meticulously choose the relevant tables or columns and exclude columns that do not affect the results. While auto-ML can be a powerful tool, its effectiveness depends on the specific needs and goals.
How to create an AutoML Model
Creating an AutoML model comprises four steps:
- Select Data for Training
- Train and Validate the model
- Deploy the ML model
- Interpret Results and make data driven decisions
Select Data for Training
- Access the workspace which has the training table or dataset.
- To invoke the AutoML environment, click the Create icon on the side navigation panel.
- Click Create New Analysis.
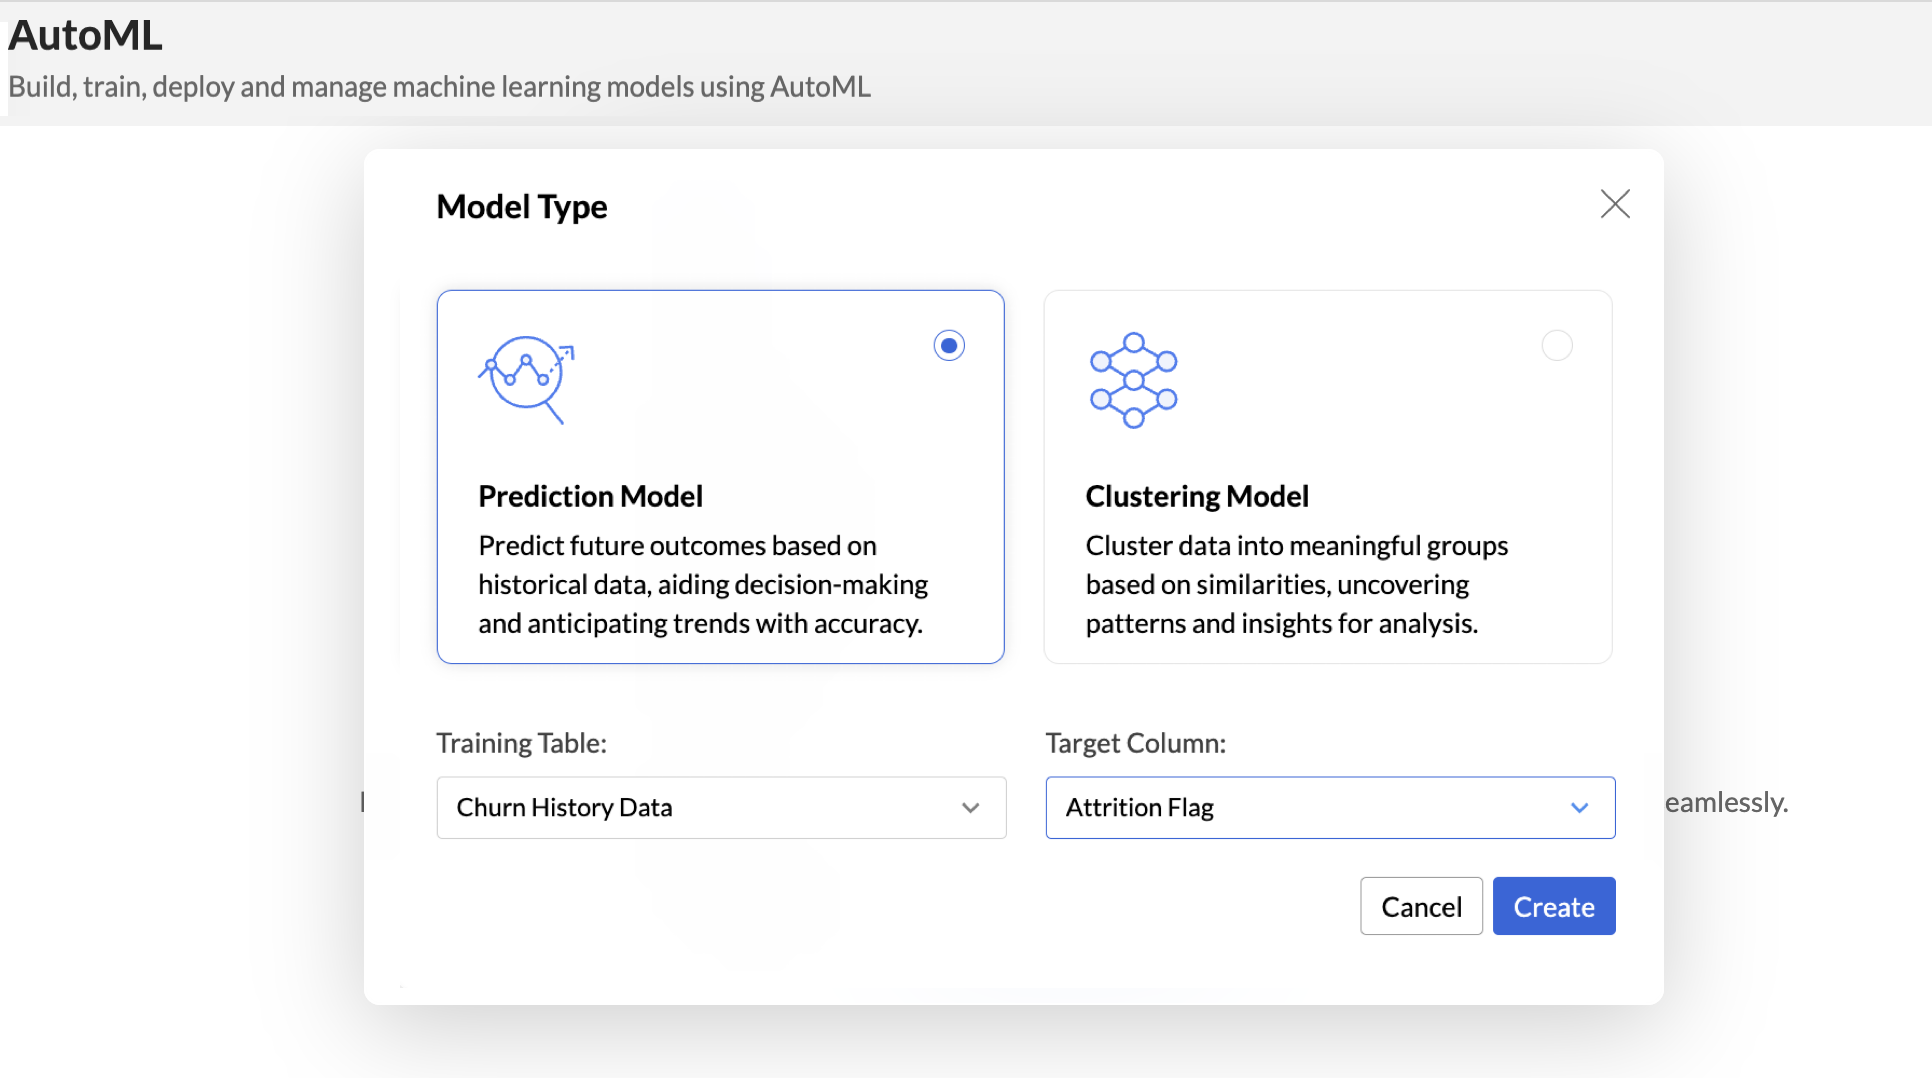
- Select the Model Type that should be used for training based on your goal. Zoho Analytics supports two models, Prediction and Clustering.
- The Training Table is the dataset used to train the machine learning model. Select the appropriate Training Table.
- The Target column (or target variable) is the specific column in the dataset that you aim to predict. It contains the outcomes or labels that the model is trained to forecast based on the input features.
- Click Create.
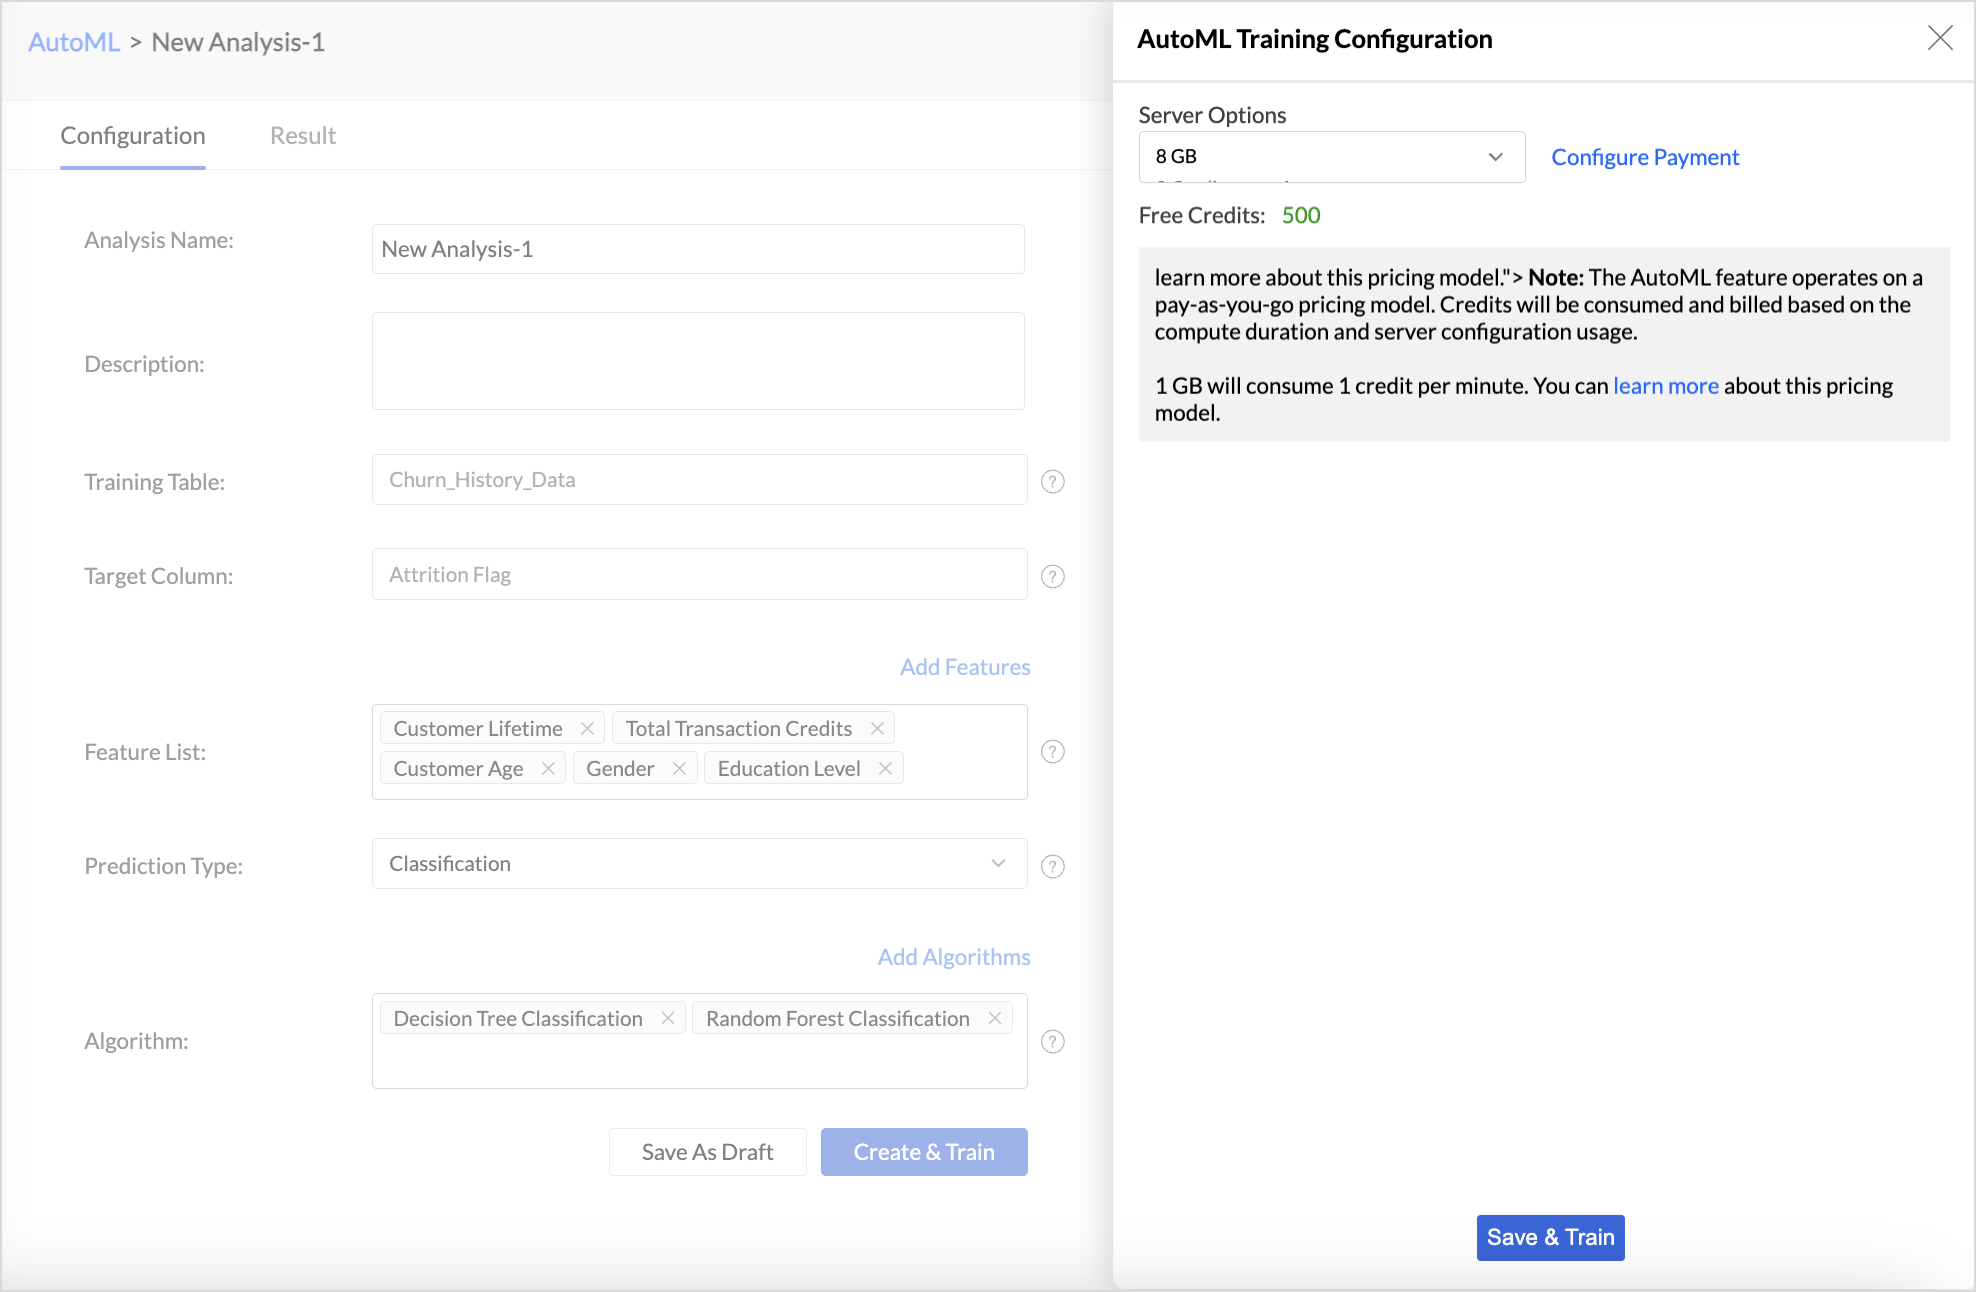
- In the AutoML configuration page, Specify a suitable Analysis Name and add a Description about the training model.
- The selected Training table and Target column will be displayed.
- Features are the factors that influence the column being predicted. Click Add Features to include additional influencing columns. Zoho Analytics will automatically suggest features that influence the column in the Suggested Features field. You can also select Other features that may have an impact.
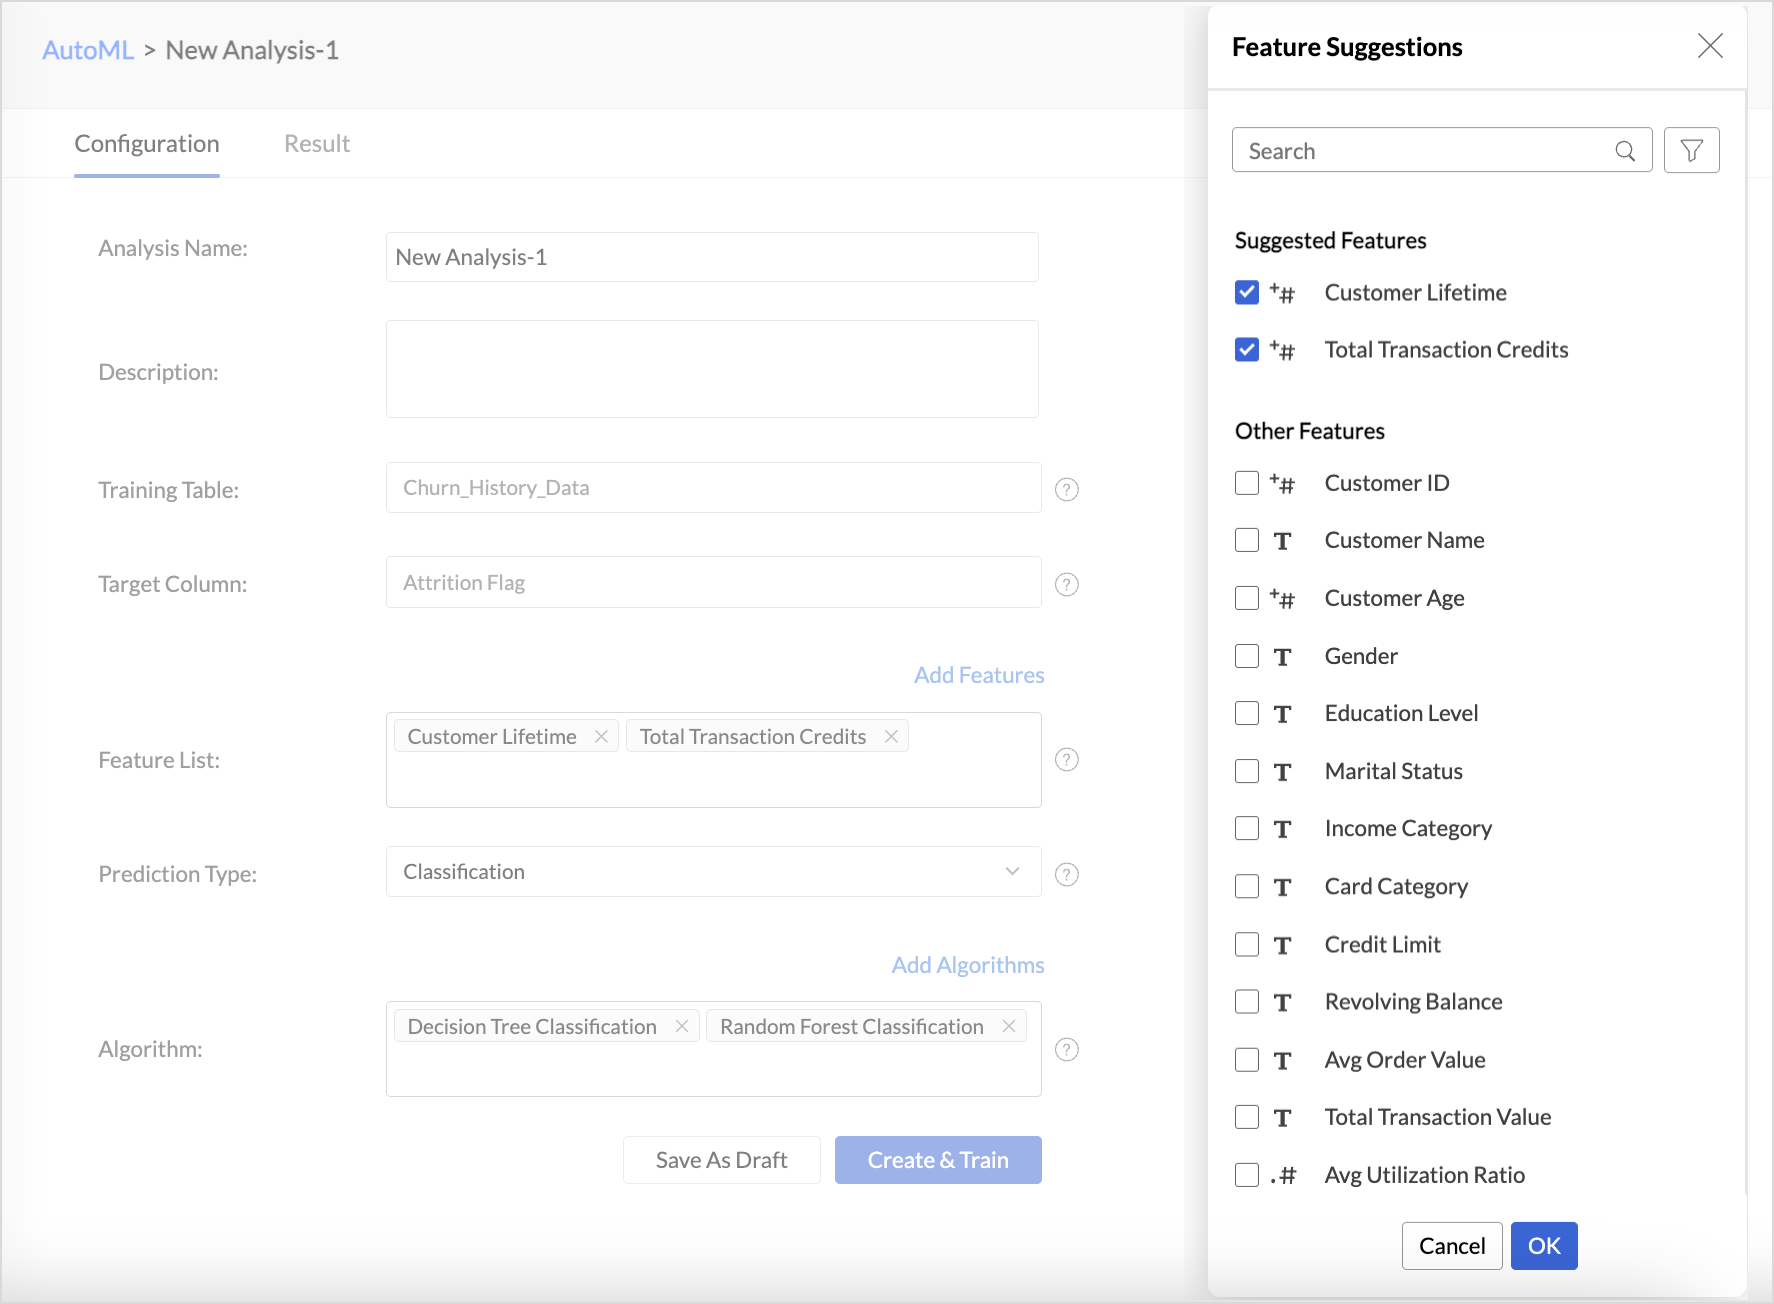
- Choose the Prediction Type. Refer to the AutoML models in Zoho Analytics section to learn more.
- Zoho Analytics automatically selects the most suitable algorithm for training. However, you can also choose specific algorithms for model training. Click Add Algorithm to select the algorithms you want to use for training the model.
- Click the Settings icon to modify the parameter settings.
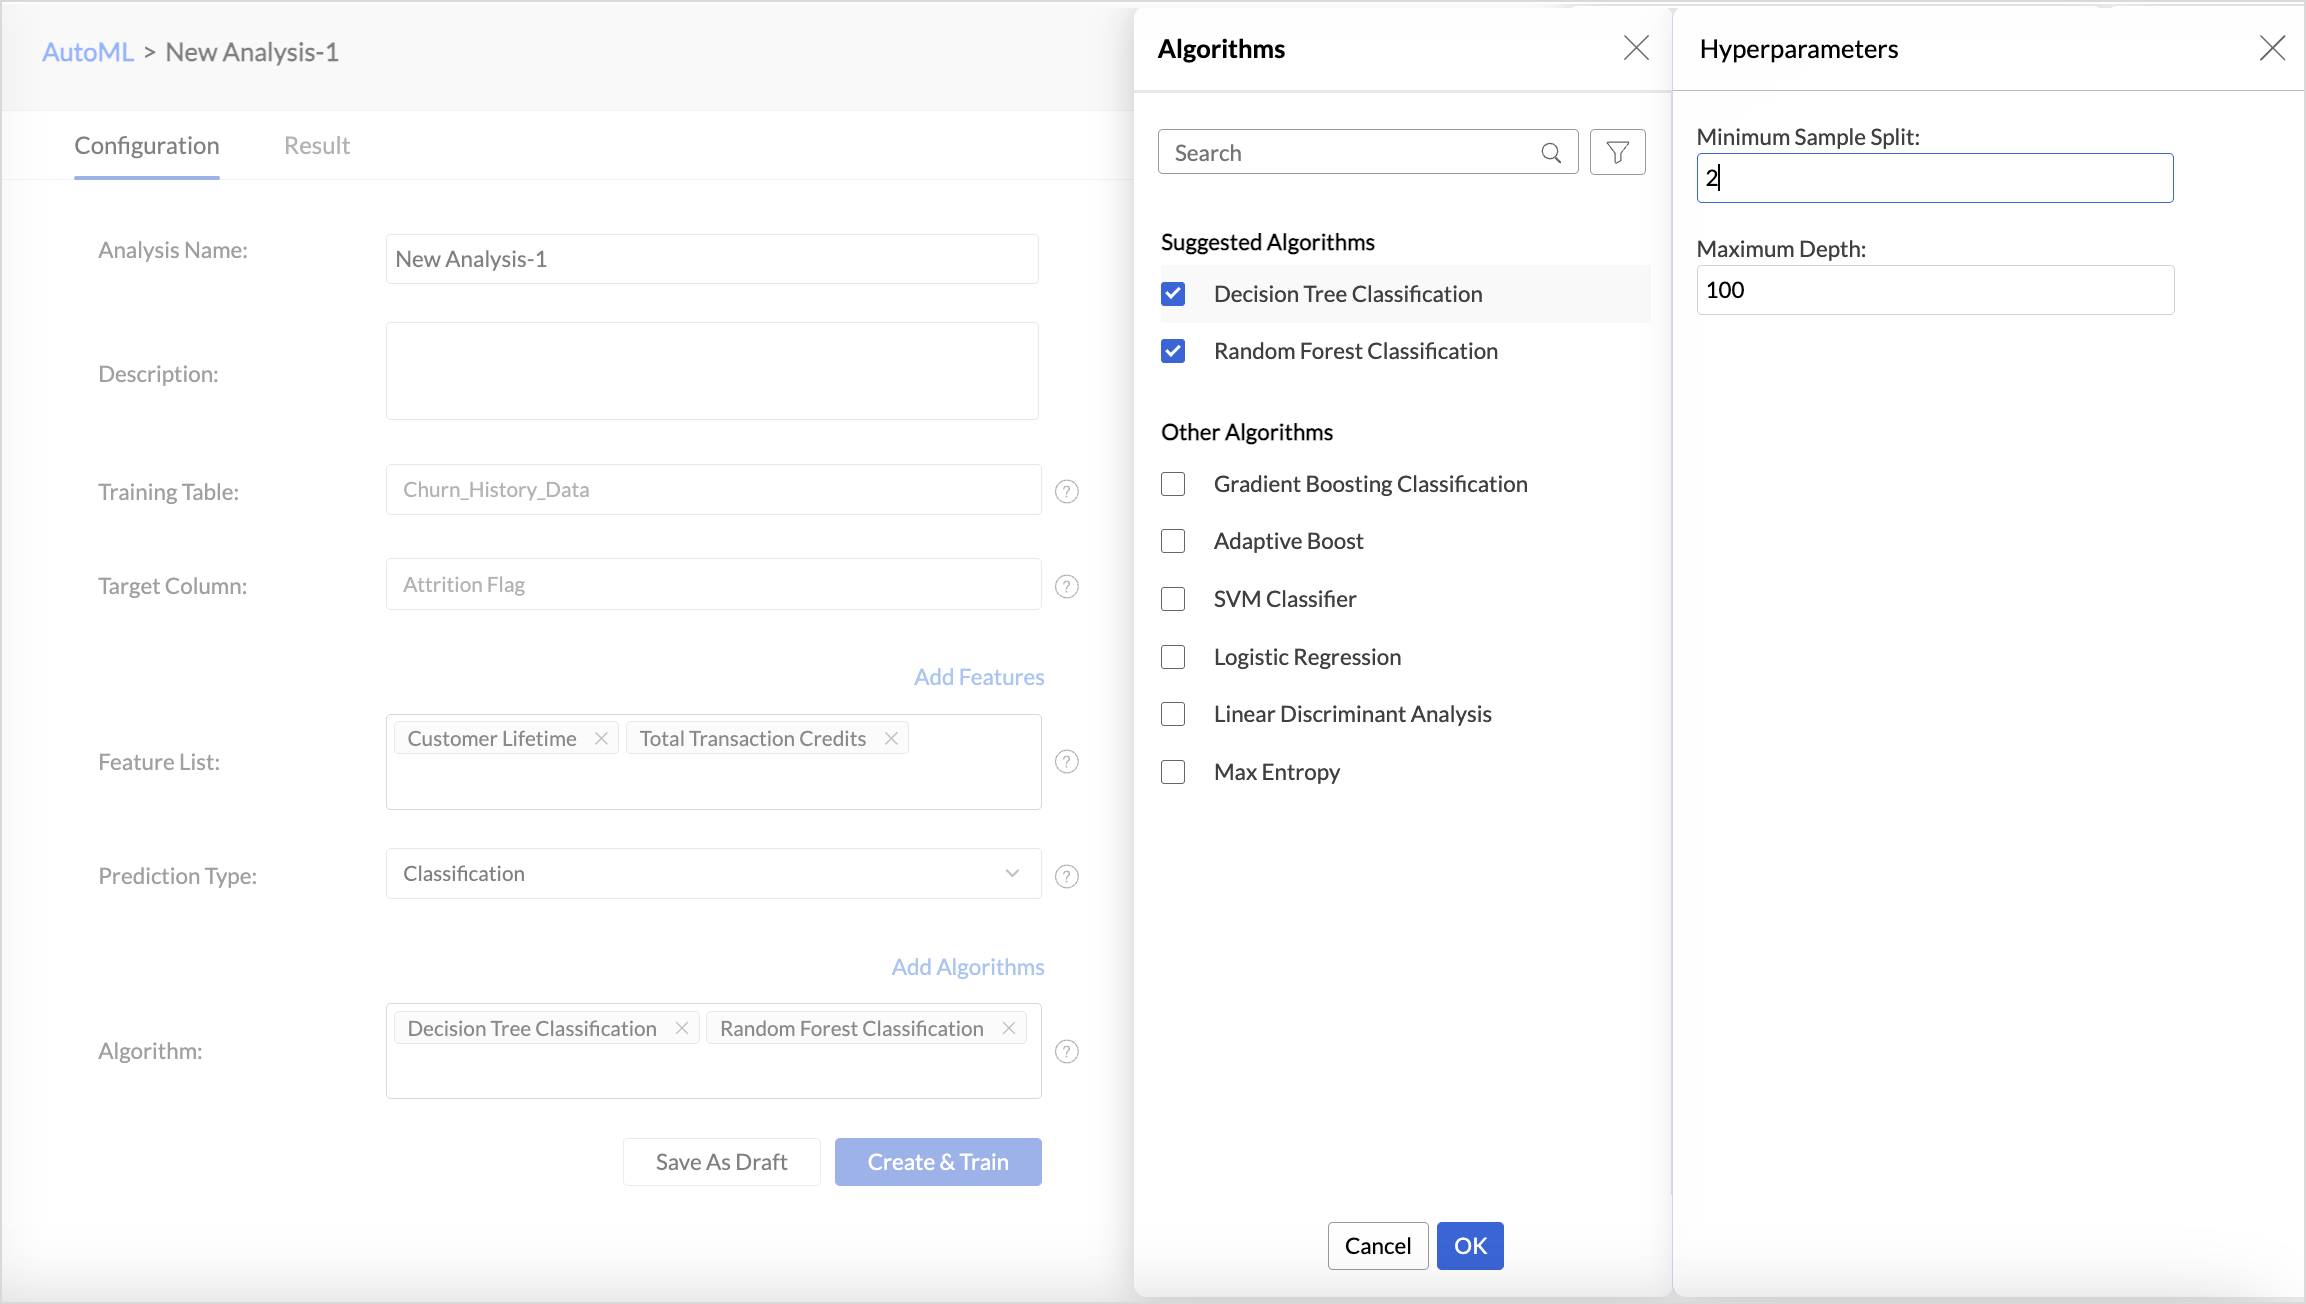
- The Save as Draft option lets you preserve the model configuration, including algorithm selection and feature settings, so that you can initiate model training later at your convenience.
- Click Create and Train to initiate the model training.
- Choose the Server options for training the ML model. Available server options 8GB, 16GB, 32GB and 128GB.
- click Save and Train.
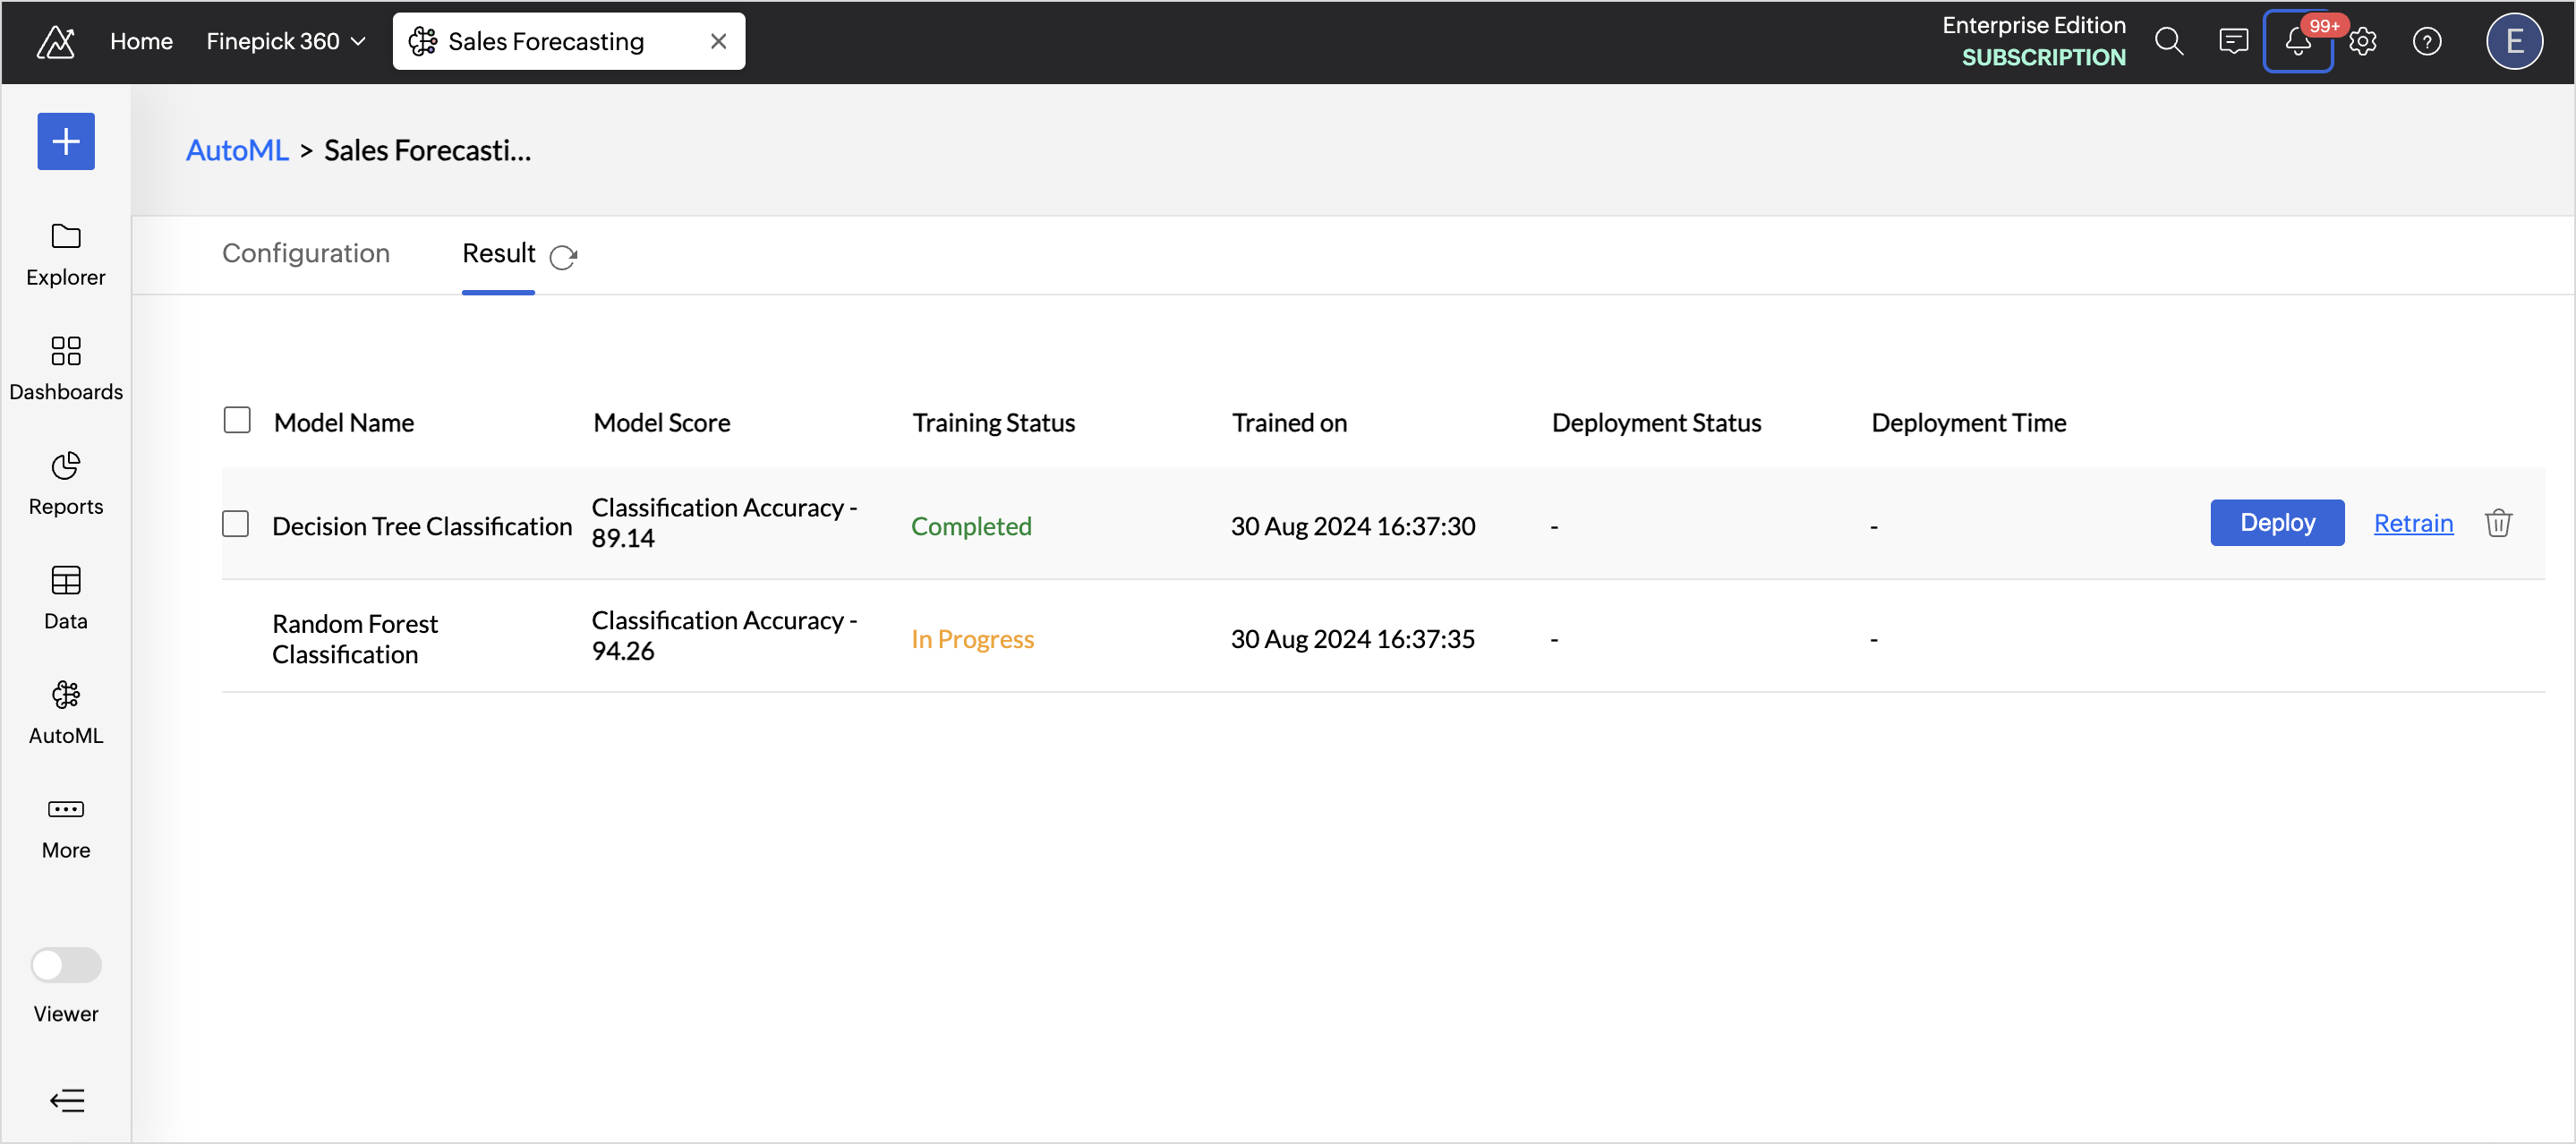
Train and Validate the ML Model
Once the training is complete, a result tab will be provided to know about the performance and accuracy of each algorithm that was used for training. The Results tab will give an overview of each model performance, such as the Model Score, Training Status, Trained on, deployment status, and deployment time.
Select a specific Model Name to get a detailed summary about the performance of the training model. The model details and explanation and performance are specific to each algorithm selected for training.
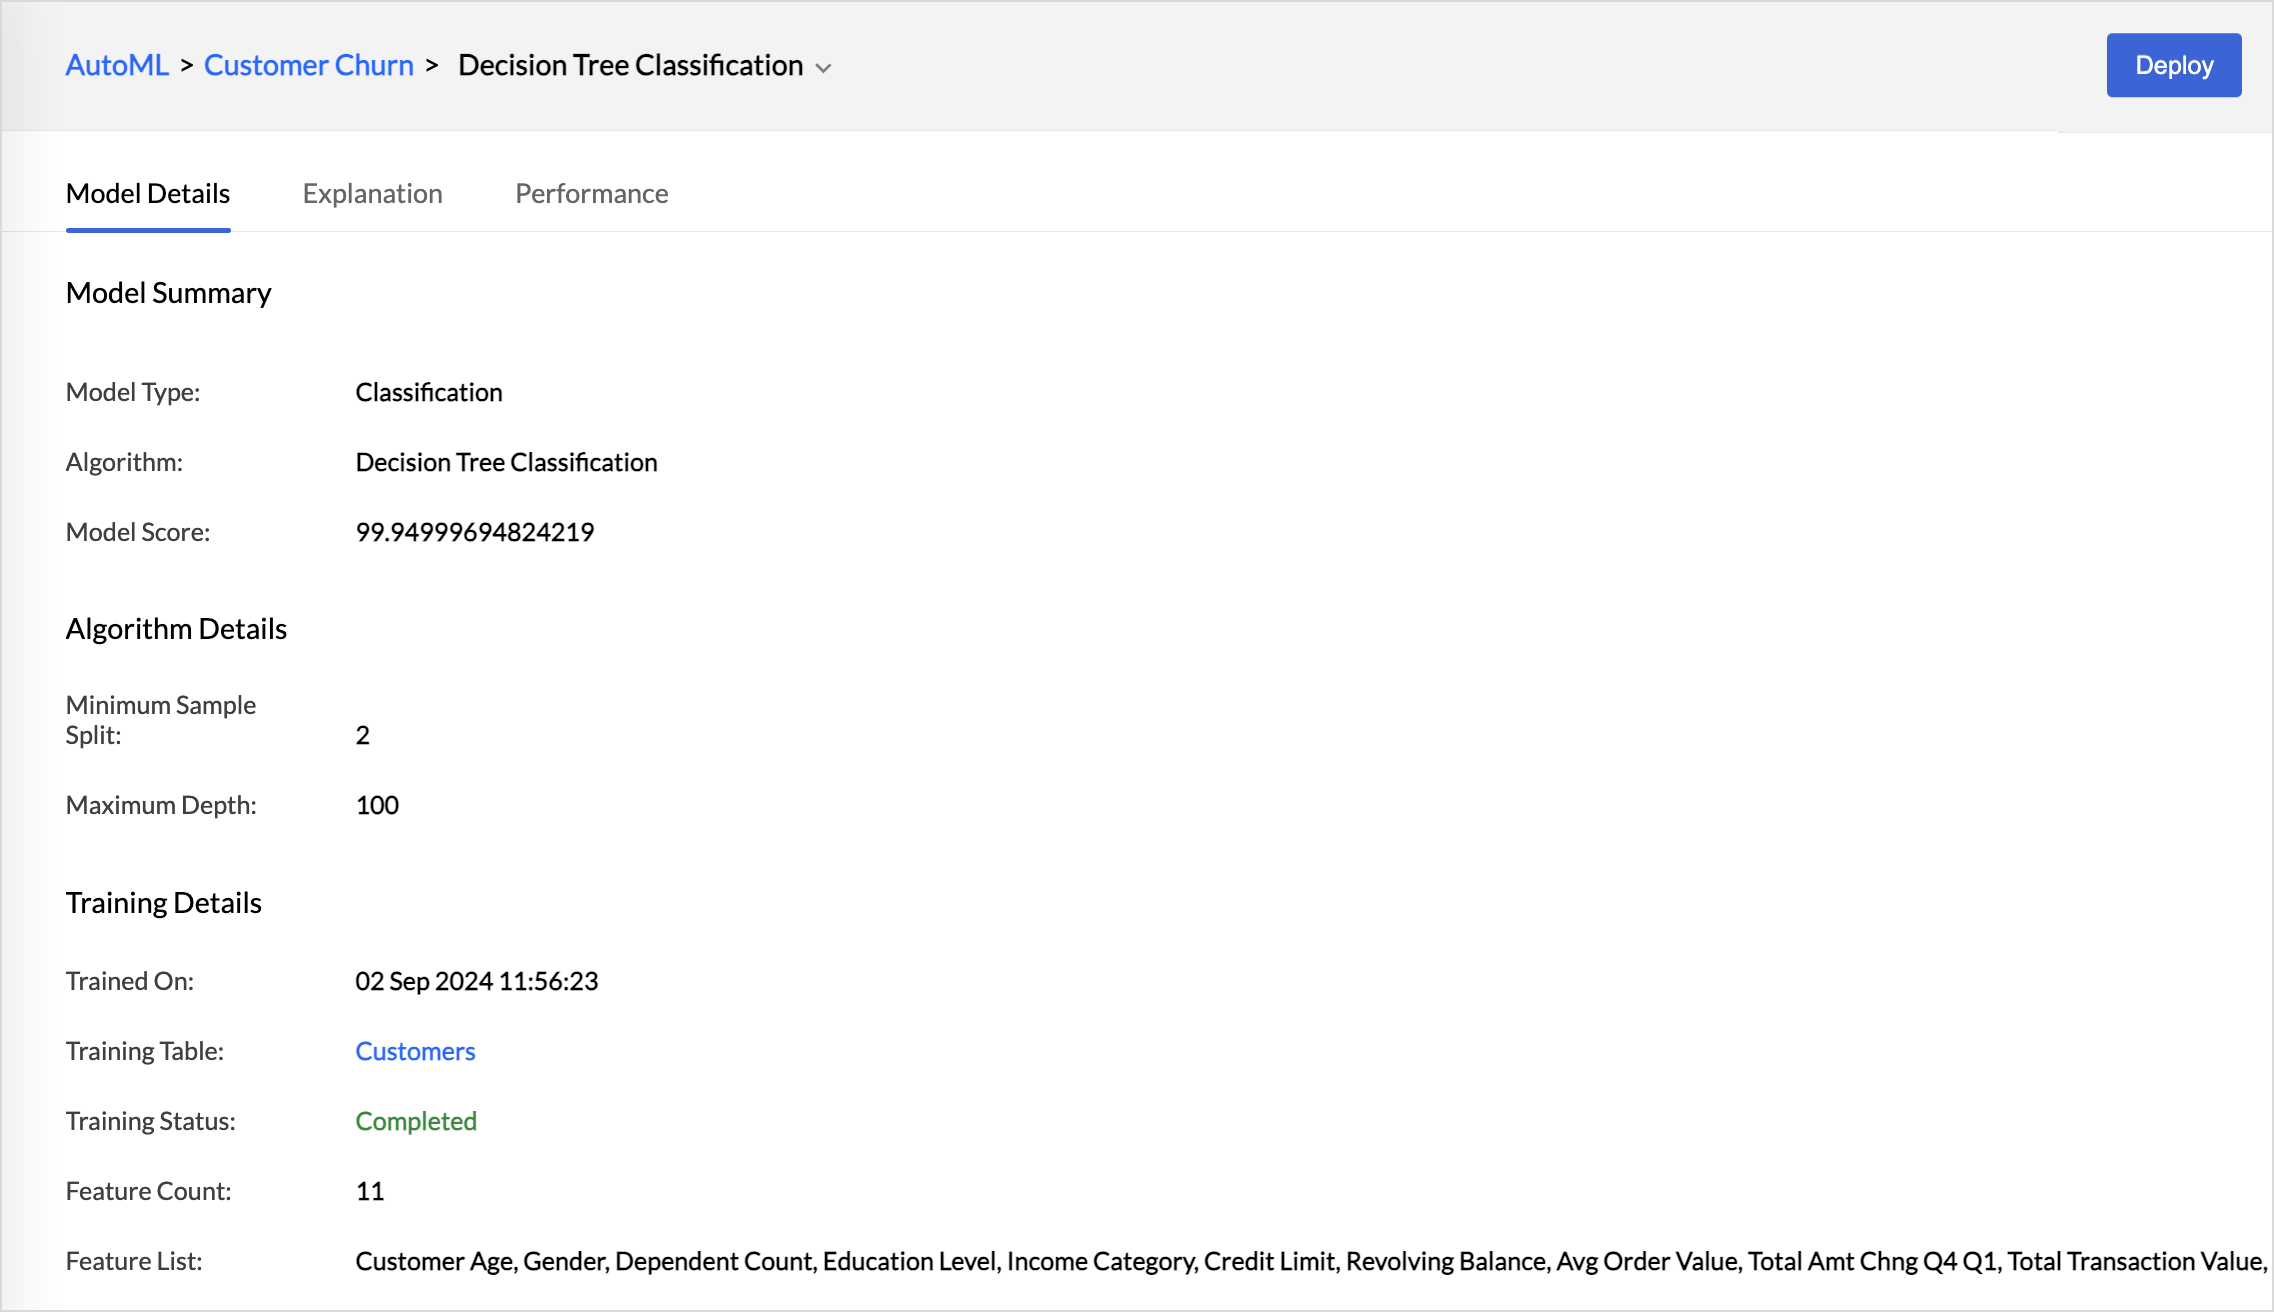
Model Details
The Model Details tab will list the Model Summary, Algorithm Details, and the Training Details.
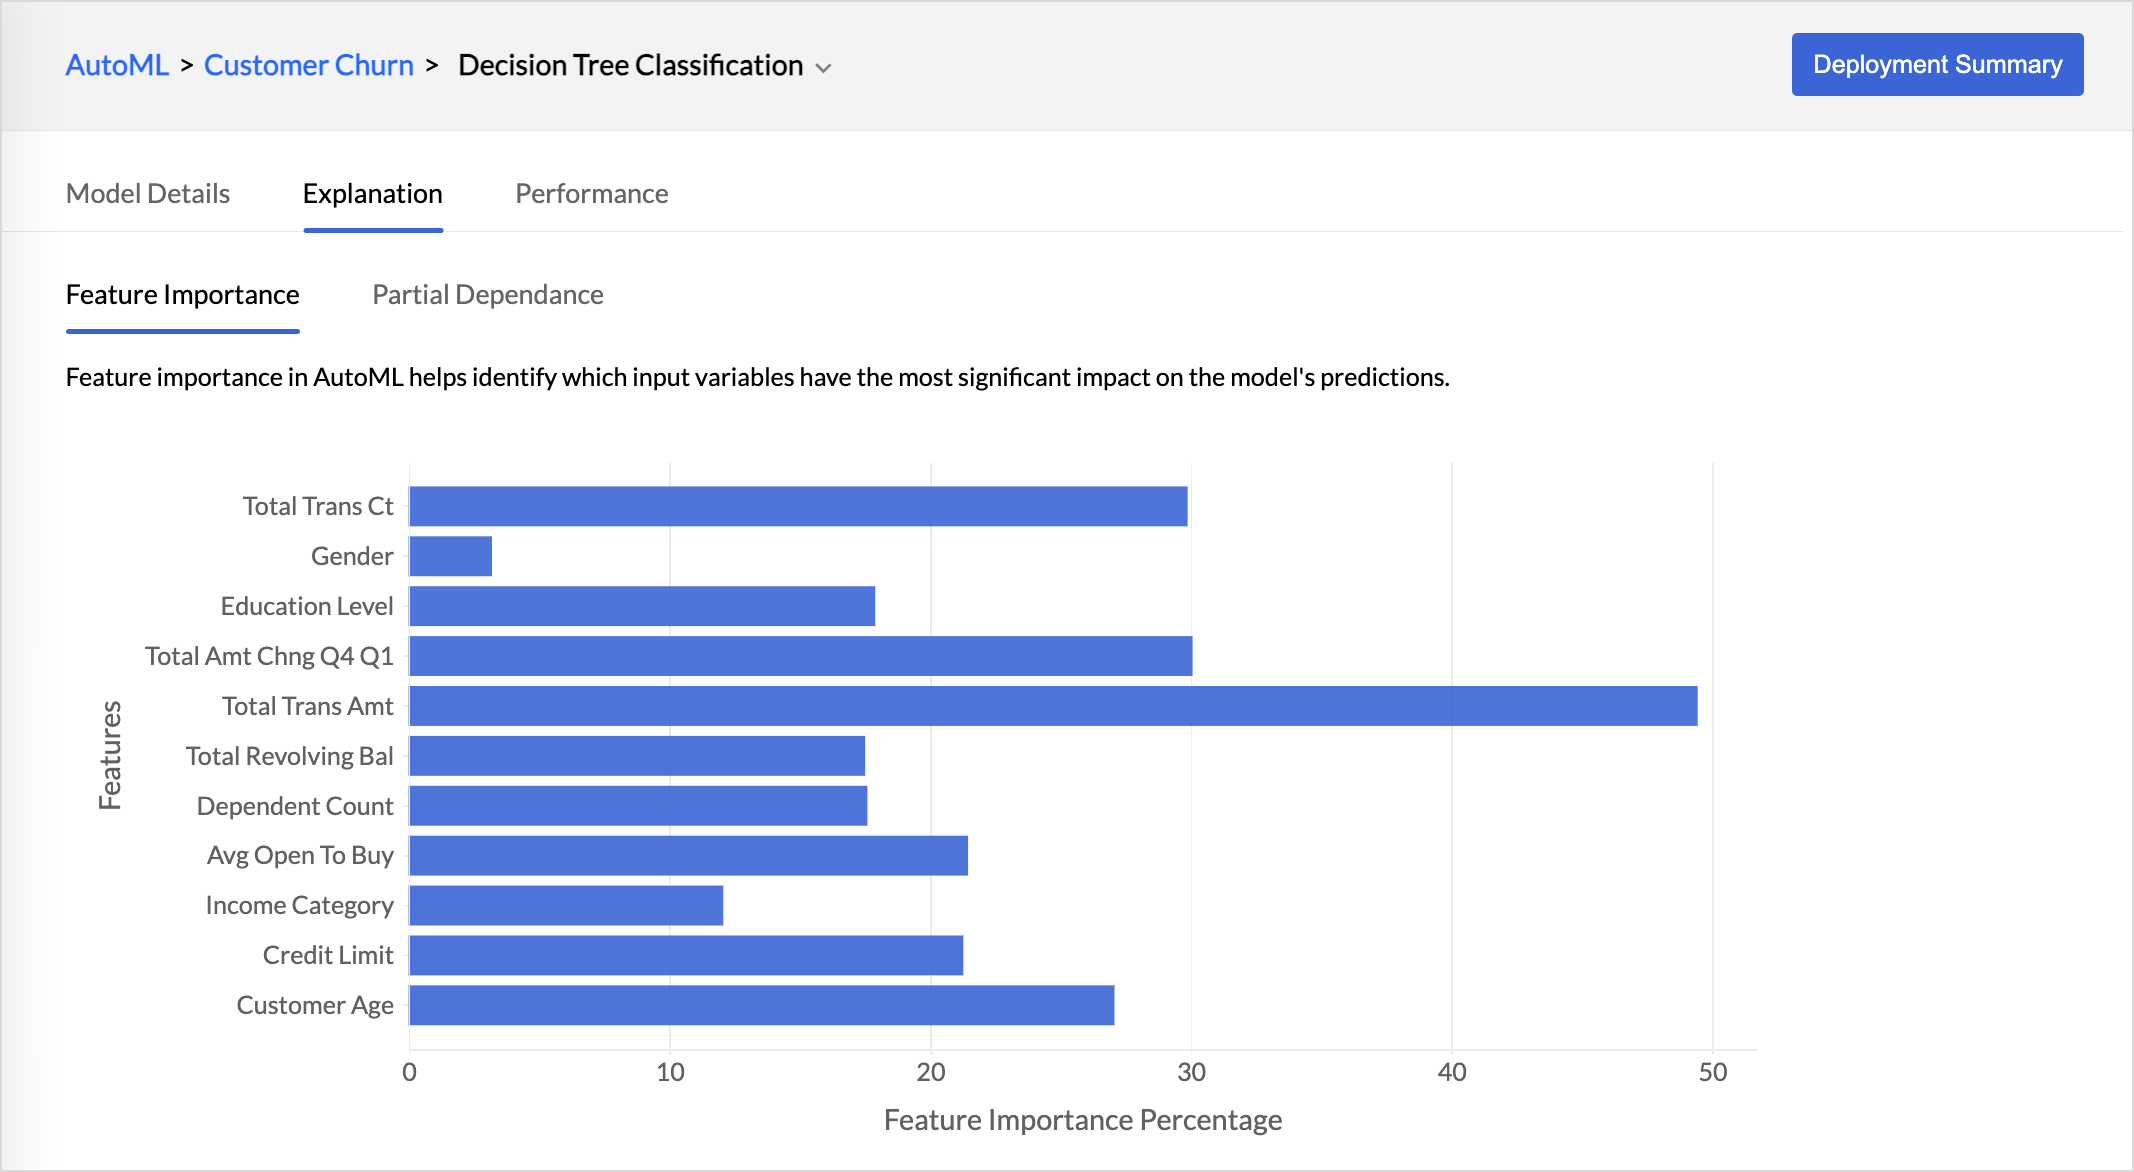
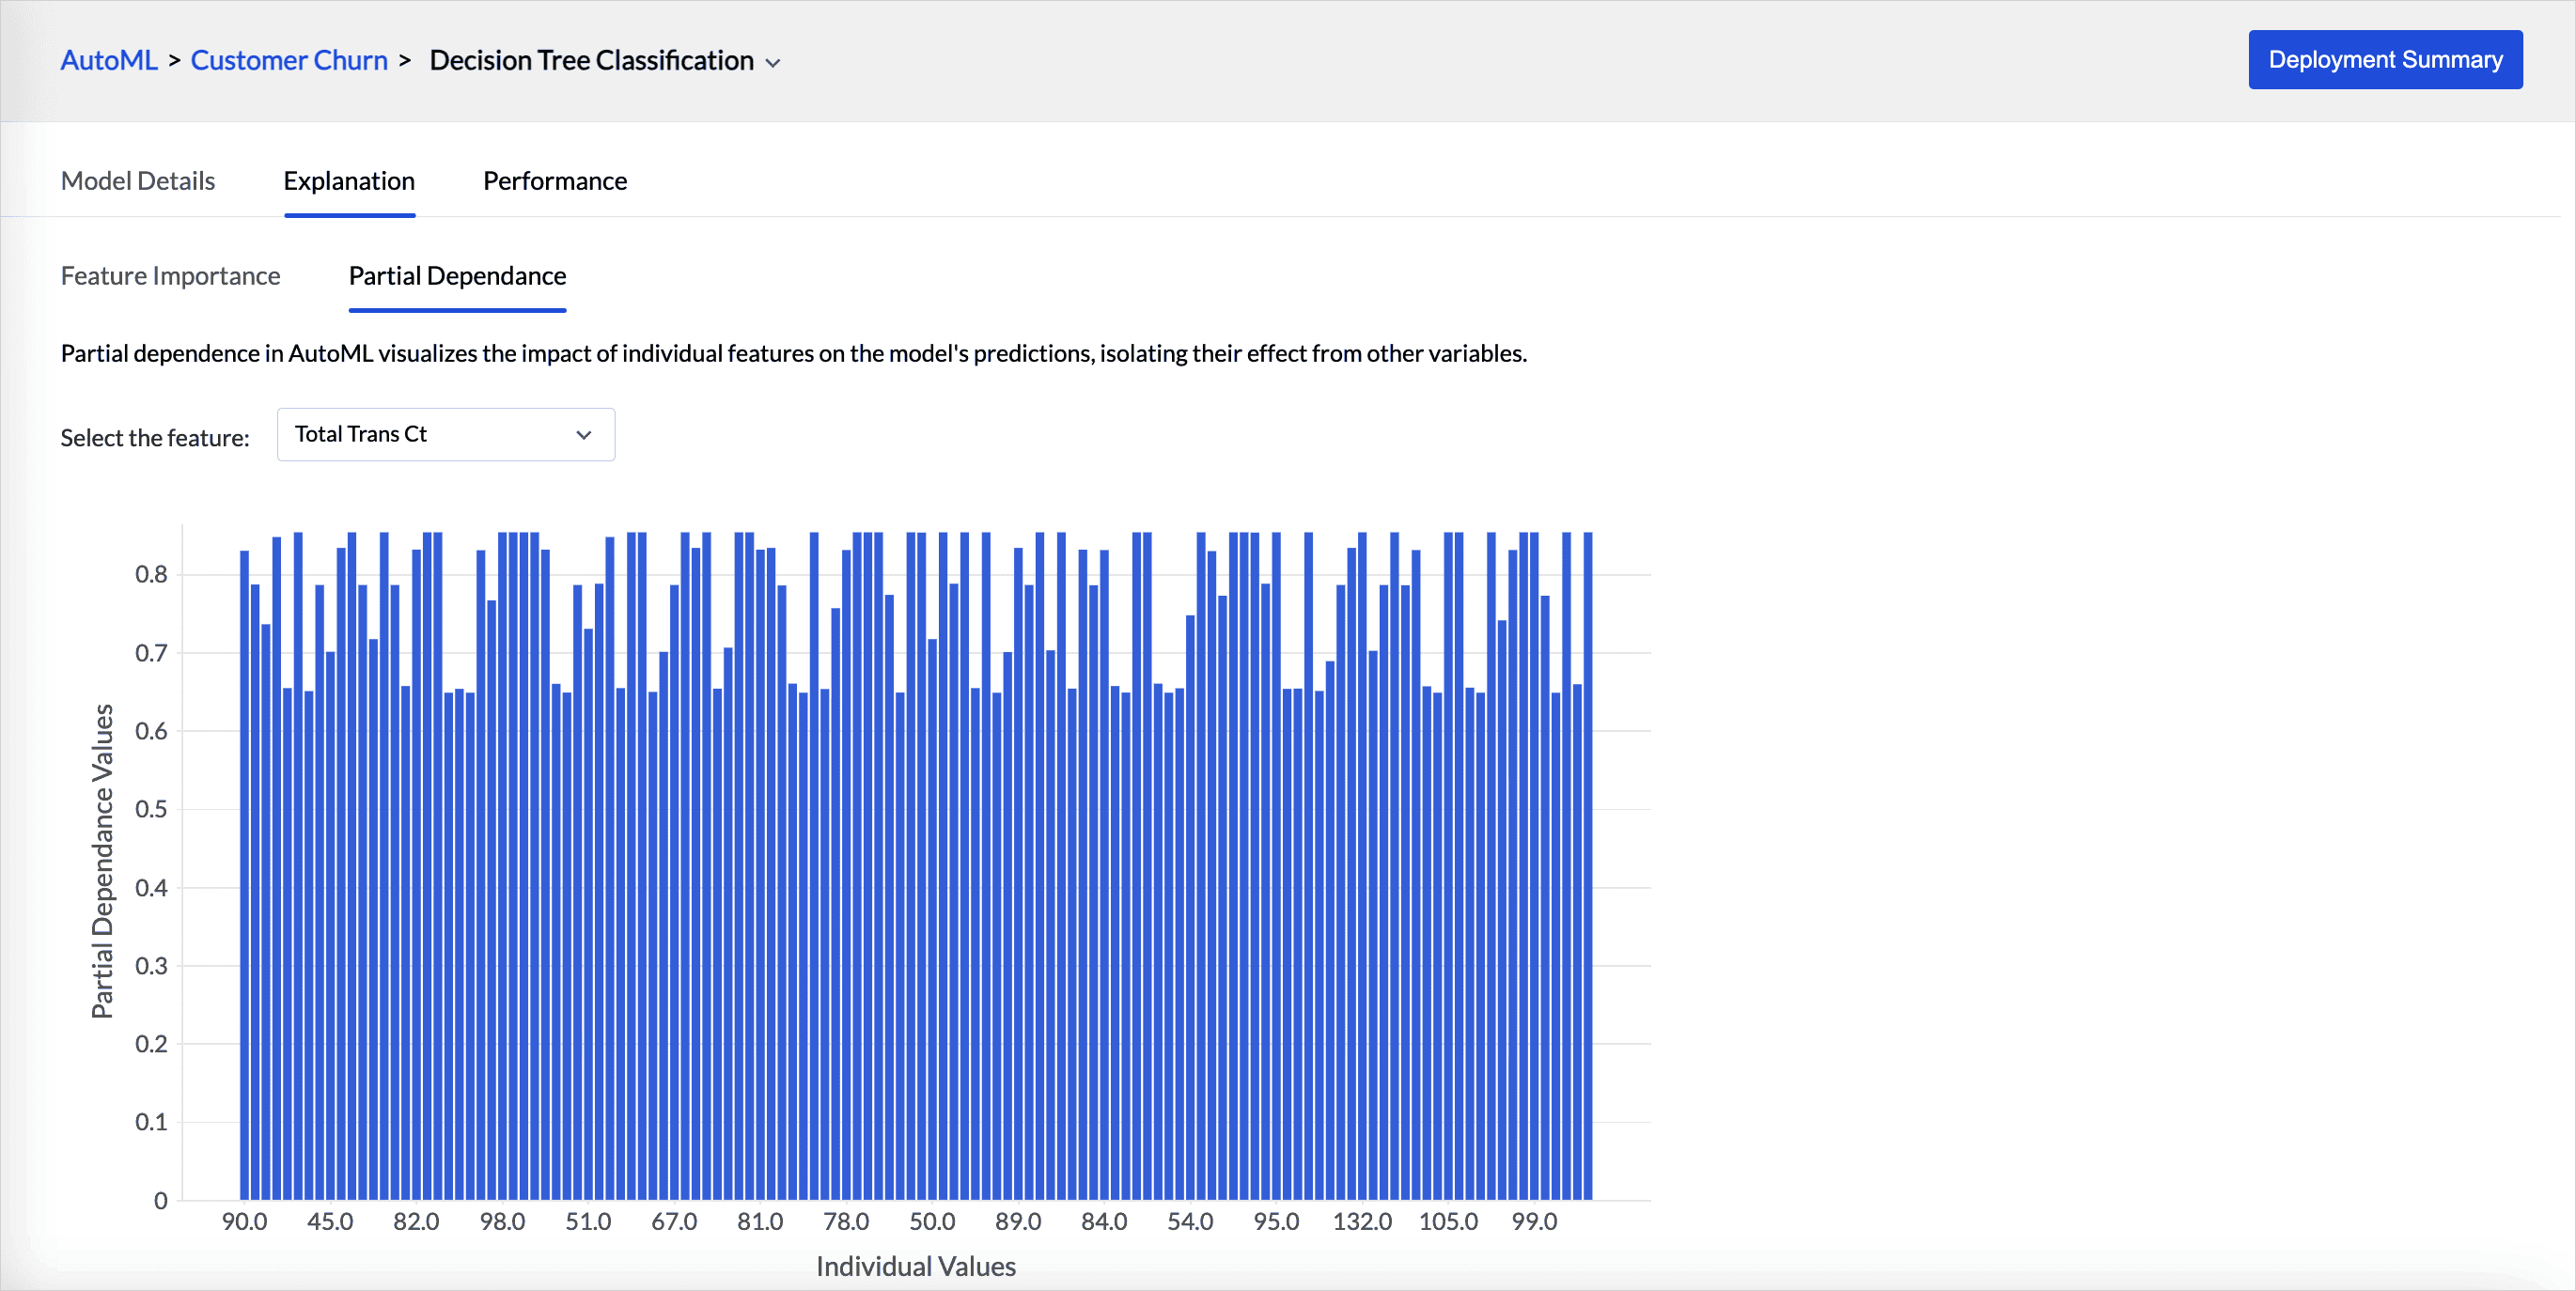
Explanation
Explanation tab provides the details about the feature importance and partial dependence of the model.
- Feature importance indicates which input variable has the biggest impact on the model's prediction. The higher the score of the feature, the larger the effect it has on the model to predict a certain variable.
- Partial dependence in autoML visualizes the impact of individual features on the model's predictions, isolating their effect from other variables. Partial dependence plot is provided for each feature selected for training.
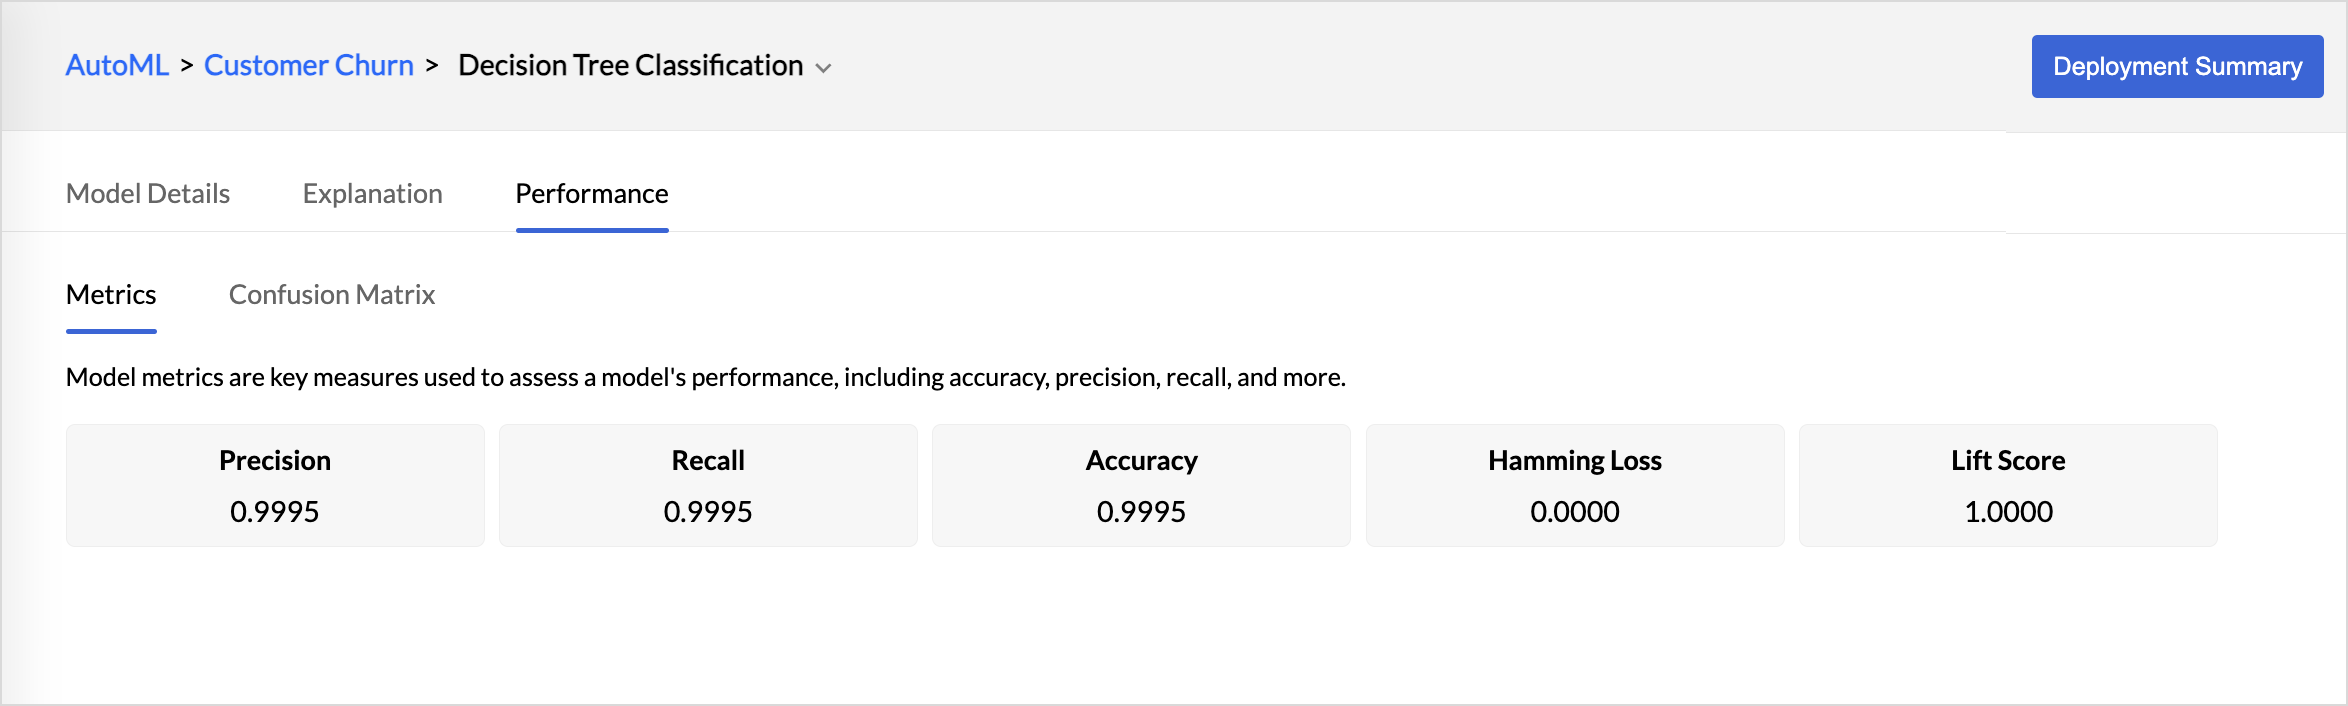
Performance
This section lists the metrics, all the statistical measures used to evaluate the accuracy and precision of the ML model. Metrics are the key measures that are used for evaluating the model's performance.
Performance - Classification Model
Metrics
Metrics are the key measures that are used for evaluating the model's performance.
- Precision is the method that is used to measure the accuracy of the positive predictions.
- Accuracy is a metric used to evaluate the overall performance of a classification model. It measures the proportion of correct predictions (both positive and negative) out of the total number of predictions.
- Hamming loss measures the fraction of incorrect predictions across all target labels for a dataset.
- Lift evaluates the effectiveness of a predictive model by comparing the performance of a model's predictions to the baseline performance.
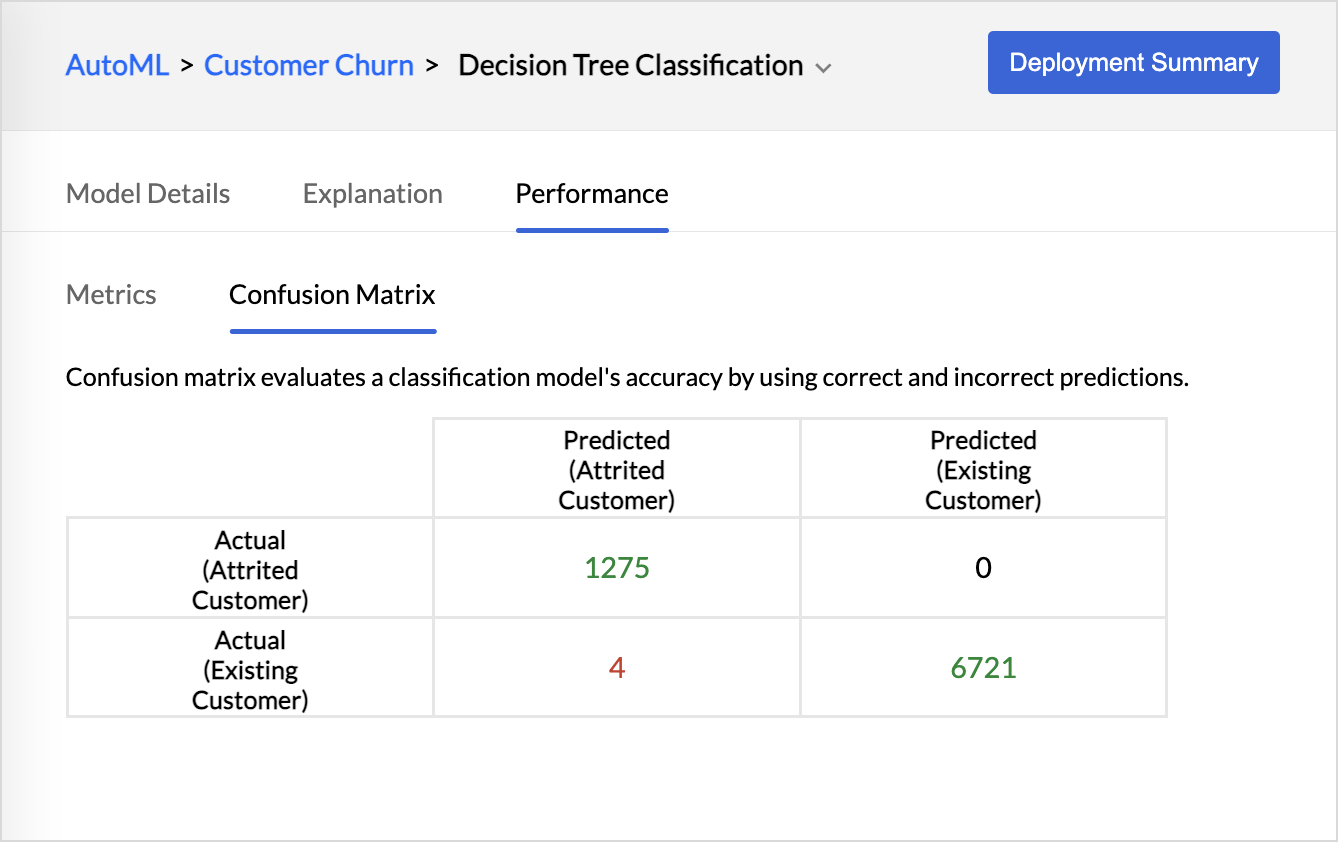
Confusion Matrix
A confusion matrix is a table used to evaluate how well a classification model is working using correct and incorrect predictions.
Performance metrics - Regression Model
- Mean Absolute Error measures the absolute difference between the predicted and actual values. It gives an overview of how far the predicted values are from the actual values.
- Pearson's Correlation Coefficient is the covariance of the two variables to the product of their standard deviations. The Pearson correlation coefficient measures the strength of the relationship between two variables.
- Explained Variance is a measure of how much of the total variance in the dependent variable is accounted for by the independent variables. It is calculated as the ratio of the variance of the predicted values to the variance of the actual values.
- Root Mean Squared Error (RMSE) calculates the mean difference between the actual value and the forecasted value.
- Root Mean Squared Logarithmic Error (RMSLE) is used to evaluate the performance of a model when the target variable is skewed or has a large range of values.
- R-Squared is the statistical method to use to evaluate how well the model fits the data. It calculates how much variation of the dependent variable is explained by the independent variable in the regression model.
- Mean Absolute Percentage Error (MAPE) calculates the average absolute percentage difference between the actual values and the forecasted values.
- Mean Squared Error (MSE) calculates the average of the squared differences between the actual and predicted values. It is commonly used because it heavily penalizes larger errors, making it useful when you want to prioritize minimizing large deviations.
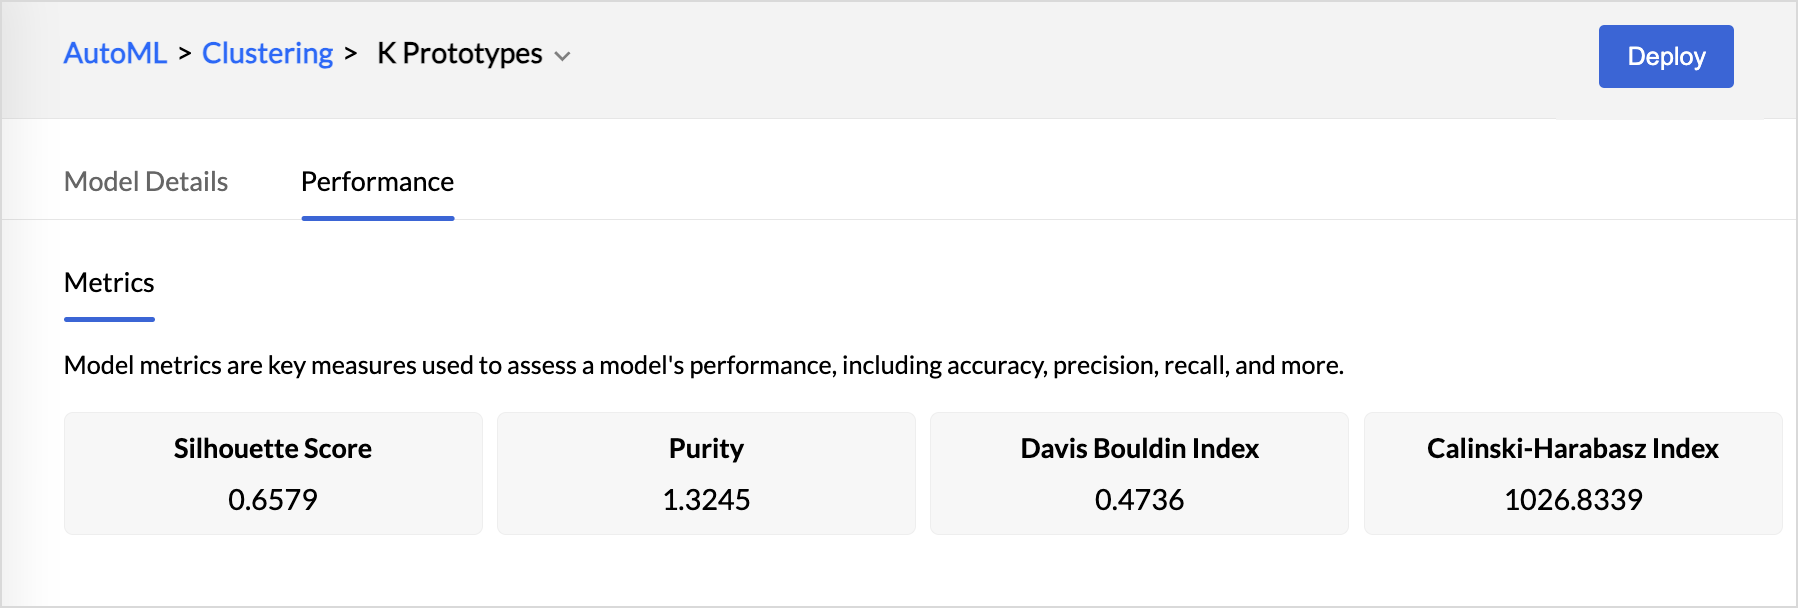
Performance - Clustering Model
- The Calinski-Harabasz index (CHI) is a metric used to evaluate the quality of a cluster. The CHI calculates the ratio of between-cluster variance to within-cluster variance. A higher CHI value denotes that the clusters are well grouped.
- The Davies-Bouldin index (DBI)is another metric to assess the quality of clustering. The DBI is calculated by considering the ratio of the average similarity between each cluster and its most similar cluster, to the average dissimilarity between the clusters.
- Purity is a metric used to evaluate the quality of the clustering results. It assesses how well-defined and internally consistent the clusters are by comparing the dominant class labels within each cluster to the actual class labels in the dataset.
- Silhouette score is a metric used to evaluate how good clustering results are in data clustering. It is calculated by measuring each data point’s similarity to the cluster it belongs to and how different it is from other clusters.
Deploy ML Model
Once you have assessed the quality and fine-tuned the ML model, you can deploy it on a production dataset to which the trained model should be deployed.
- Zoho Analytics allows you to deploy the model in the following two ways:
- Access the Results tab and click the Deploy option adjacent to the model name.
- Access the More Details tab and click the Deploy option in the top right corner.
- Select the Input Table from the drop-down menu for which you need to predict the outcomes.
- Give a suitable Output Table Name and the Prediction Column name.
- Select the Columns that should be included in the output table.
- Choose the Server Option that should be used for computation.
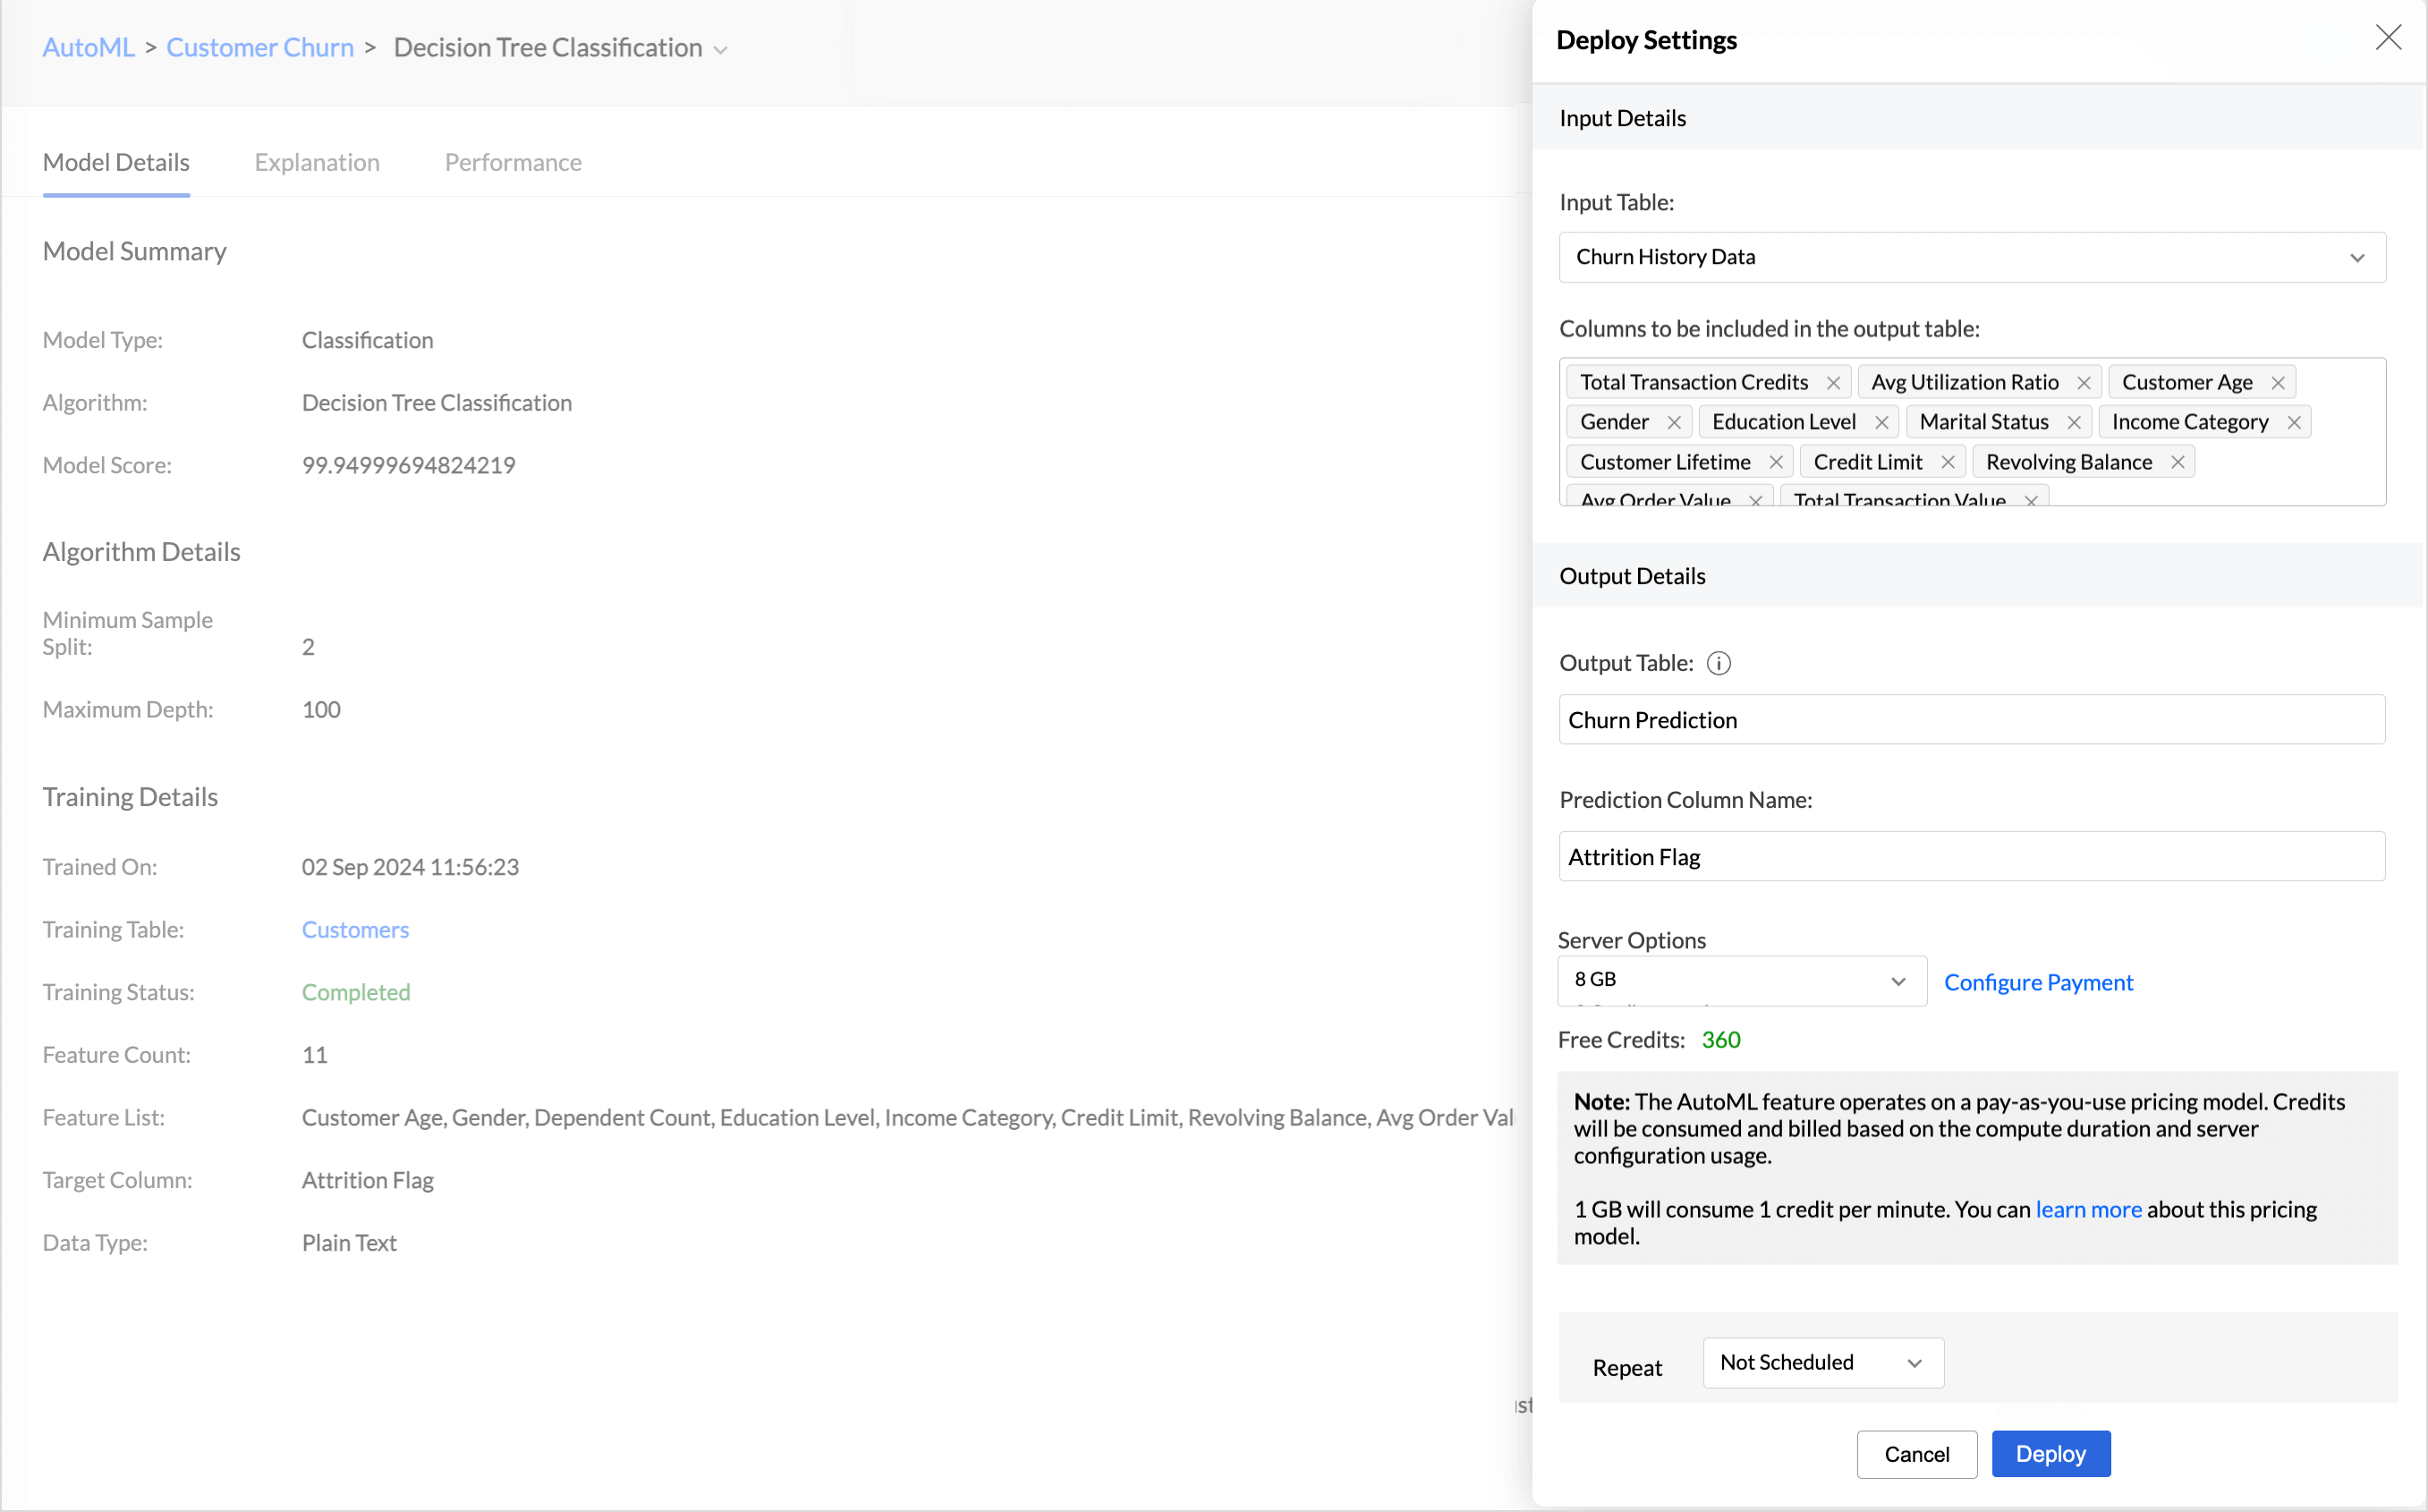
- The Repeat option lets you automatically apply training results to new data Choose the frequency in which it should be applied in the Repeat Every option. Available options are:
- Every N hours
- Every Day
- Weekly Once
- Monthly Once
- Click Deploy.
Interpret Results and make data driven decisions
Once the deployment is complete, a new table is generated; you can then create visualizations and gain insights. Communicate the results to other organizations' members for informed decision-making.
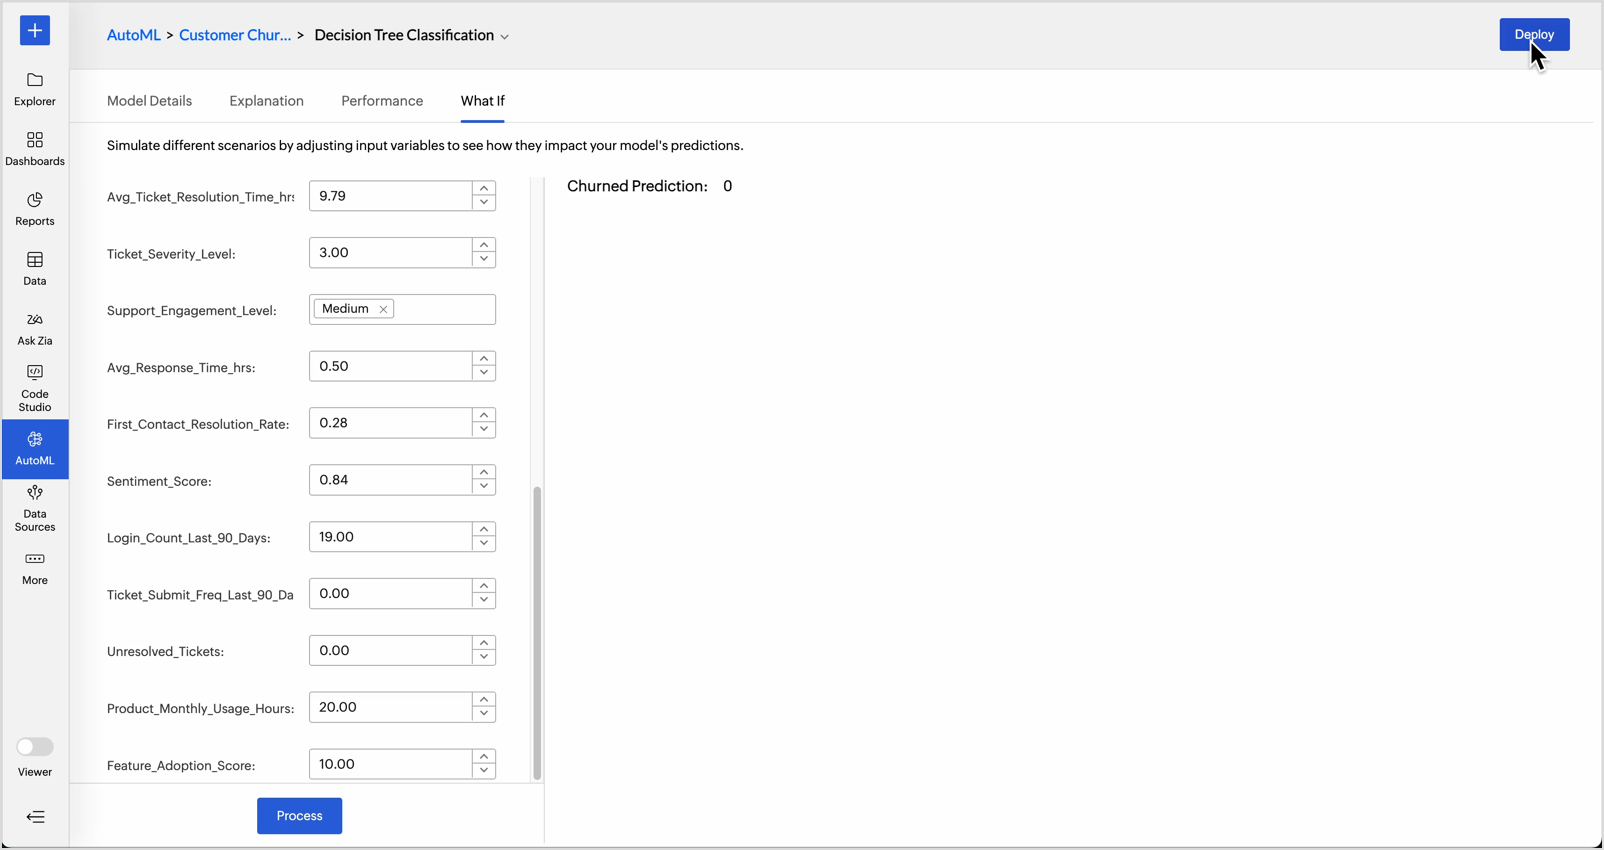
What-if Analysis in AutoML
What-if analysis in AutoML enables users to explore how changes in input variables affect model predictions. Simulating different scenarios helps,
- Understand feature impact: Identify which variables most strongly influence the outcome.
- Test Hypothetical Situations: Evaluate outcomes under different conditions, such as increasing marketing spend or changing product price.
- Support Business Planning: Predict future outcomes by modeling best case, worst case, or most likely scenarios.
Retraining ML Models
Business requirements are constantly evolving. Machine learning models trained on outdated data lead to inaccurate insights and poor decisions. Retraining ML models helps adapt to new data patterns, reduce errors, eliminate data drift, improve model performance, and make them suitable for current business objectives.
Zoho Analytics allows you to retrain an ML model in any of the following three ways:
- Retraining a specific ML model: Access the AutoML tab and choose the Model you want to retrain. Hover on the model and click Retrain.
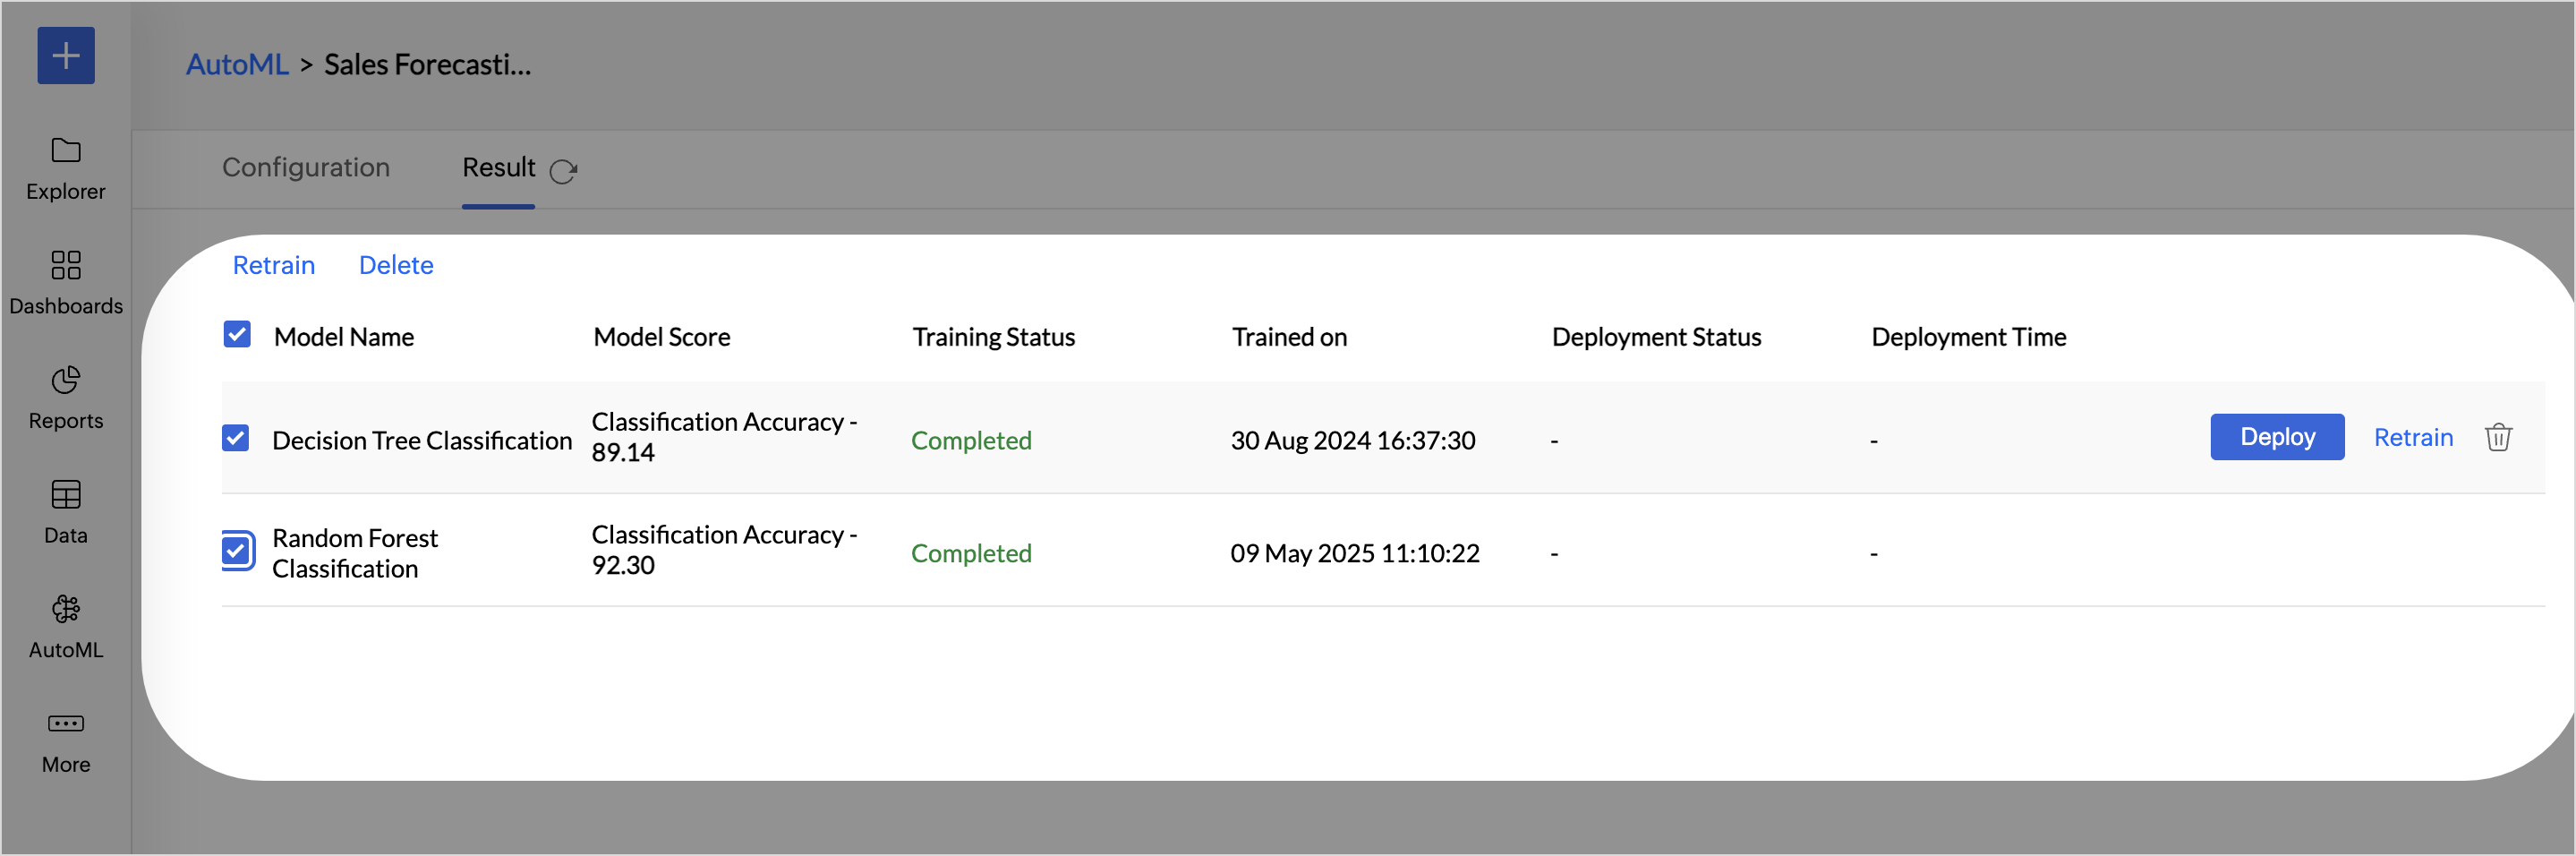
- Retraining Multiple ML Models: You can also multi-select the ML models you want to train and click the Retrain option on the toolbar.
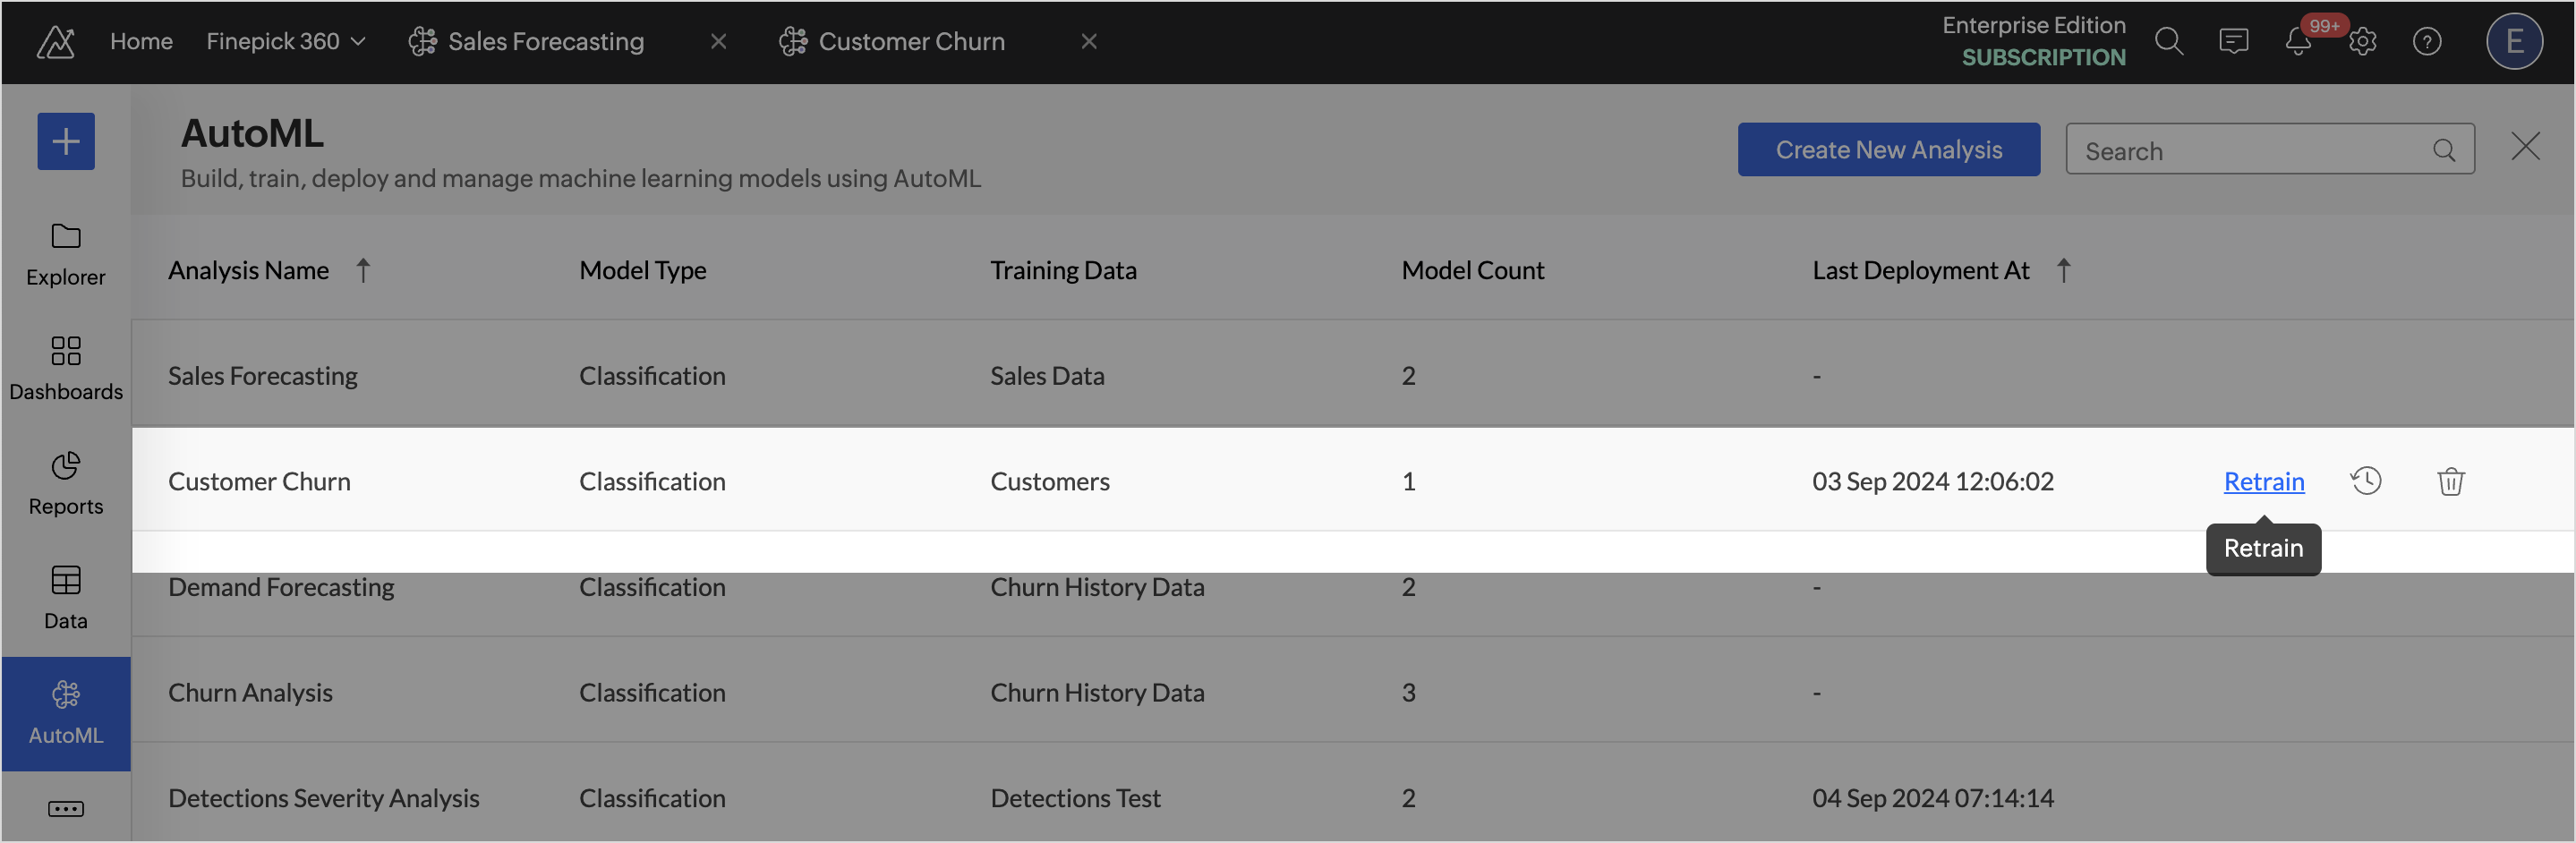
- Retraining an Analysis: Access the AutoML tab and hover over the Analysis to be retrained, and click Retrain. This will retrain all the models in the selected analysis.
Deleting an ML Model
Deleting a machine learning model permanently removes the trained model and its associated metadata from the system. This is usually done to free up storage, remove obsolete models, or eliminate those misaligned with current data or business goals.
Algorithms - Regression
The following are the algorithms supported for the Regression Model in Zoho Analytics.
- Decision Tree Regression is a type of regression model that divides the data into subsets based on feature values, creating a tree-like structure. Each internal node in the structure represents a feature, and each branch represents a decision rule, and each leaf node represents a prediction.
- Random Forest Regression is a supervised machine learning algorithm that uses a combination (ensemble) of decision trees for prediction. Random subsets of the training data are chosen while constructing each decision tree. Each decision tree is combined to output a single prediction value. The random forest model is best suited for predicting continuous values, like time series forecasting and price predictions. Since the algorithm involves constructing multiple decision trees, the predictions are always of high accuracy.
- OLS Regression (Ordinary Least Square Regression) is a statistical technique used for used to estimate the relationship between variables in a regression model. It aims to minimize the sum of the squared differences between the observed values and the values predicted by the model.
- Lasso Regression, or Least Absolute Shrinkage and Selection Operator, is a regularization technique that chooses the most important characteristics in addition to predicting results. It is useful for high-dimensional data.
- Ridge Regression is a technique for analyzing multiple regression data that have from multicollinearity. It adds a penalty to the regression coefficients to prevent over fitting.It aims to minimize the residual sum of squares (RSS) while adding a penalty proportional to the square of the magnitude of the coefficients. This helps to prevent overfitting by shrinking the coefficients of less important features.
- SVM Regressor or support vector machine is a technique used for predicting continuous values rather than classifying data into categories.
- Gradient Boosting Algorithm combines multiple weak predictions for predicting outcomes, and it sequentially improves the model by correcting errors.
Algorithms - Classification
- Decision Tree Classification is a supervised learning algorithm used for classifying data into distinct categories based on feature values. The decision tree splits the data into subsets based on different features. Each branch represents a decision rule representing a class label.
- Random Forest Classification is an ensemble learning technique that builds multiple decision trees and combines their outputs to make a final classification decision. It is often more accurate than individual decision trees due to the aggregation of multiple trees.
- Gradient Boosting Classification is an ensemble learning technique that builds a model in a stage-wise fashion. It combines the predictions of several weak models(usually decision trees) to create a strong predictive model. Gradient Boosting minimizes the loss function by fitting new models to the residuals (errors) of the existing ensemble. It uses gradient descent to optimize the model.
- Adaptive Boosting, or AdaBoost, is an ensemble learning method designed to improve the performance of weak models. It builds a strong classifier by combining multiple weak classifiers.
- SVM Classification model classifies data by finding the best boundary that separates each classes. It maximizes the margin between different classes.
- Logistic regression predicts the probability of a binary outcome by modeling the relationship between the dependent variable and one or more independent variables.
- Linear Discriminant Analysis (LDA) is a technique used for classification. It is helpful for where there are multiple classes and want to find the linear combinations of features that best separate these classes. It aims to find a linear combination of features that maximizes the separation between multiple classes.
- Max Entropy predicts the probability of a binary outcome by modeling the relationship between the dependent variable and one or more independent variables.
Algorithms - Clustering
- K-prototypes model is used for clustering factors containing both measure and dimensional columns. K-prototype combines both K-means and K-modes models for computing the centroids. Weightage parameters are used to define and control the dominance of the measure and dimensional columns.
- X-means is an extension of the K-means clustering algorithm that aims to determine the optimal number of clusters automatically, addressing one of the major limitations of K-means, which requires the number of clusters to be specified in advance.
- K-prototype model is used for clustering factors containing both measure and dimensional columns. K-prototype combines both K-means and K-modes models for computing the centroids. Weightage parameters are used to define and control the dominance of the measure and dimensional columns.
- X-means is an extension of the K-means clustering algorithm that aims to determine the optimal number of clusters automatically, addressing one of the major limitations of K-means, which requires the number of clusters to be specified in advance.
- K-means++ model clusters data points into the pre-defined number of clusters based on the centroid. K-means++ is an improved initialization method for the standard K-means clustering algorithm. It addresses one of the key challenges in K-means: the sensitivity to the initial choice of cluster centroids.
- K-modes model clusters data points into the pre-defined number of clusters based on the modes, making it suitable for clustering categorical data.
- G-means is an extension of the K-means clustering algorithm that automatically determines the optimal number of clusters by combining K-means with a statistical test for Gaussian distribution. G-means dynamically adjusts the number of clusters based on the data structure.