Zia Insights
Deciphering insights in the reports or visualizations could be tedious and time intensive. Zia Insights, a generative AI tool powered by Zoho Analytics, examines all the data points in the report and deploys advanced analytical methods and ML algorithms to bring out the insights, that may not be evident at first sight. These insights facilitate multi-dimensional interpretation of data.
Zia Insights provides contextual narratives as insights to the various questions that arise while trying to interpret data and directs towards meaningful conclusions by offering Descriptive, Predictive, and Diagnostic insights.
- Descriptive insights explain what has happened with a specific measure or metric, providing a clear overview of past performance and trends.
- Predictive insights explain how a trend has been for a metric and how likely it is to change.
- Diagnostic insights focuses on Why something happened. It helps understand the causes of events by identifying the factors that impact and contribute to specific outcomes. Zia insights uses an ML technique to identify the key Drivers that have a significant impact on the outcome and different statistical methods for explaining the factors.
On this Page
- Access to Zia Insights
- Types of Narratives
- Supported Languages
- Invoking Zia Insights
- Customize Zia Insights
- Key Driver Analysis
- Explain Data - Zia Insights
Access to Zia Insights
The Account, Organization and the Workspace admins can access Zia Insights. They can also grant permission to other users while sharing the reports and dashboards, or when they create specific roles.
Types of Narratives
Zia Insights enables users to understand the relationships (correlations) in the data, highlights the key points like trends, outliers, and top contributing measures, and also predicts future outcomes based on the past data. These insights are available as Textual and Visual Narratives
Textual Insights: Provides story-like explanations of the key points in the report in simple language, making it easier for non-technical users to comprehend the data insights. Textual Insights can also be easily added to the presentations for effective data storytelling.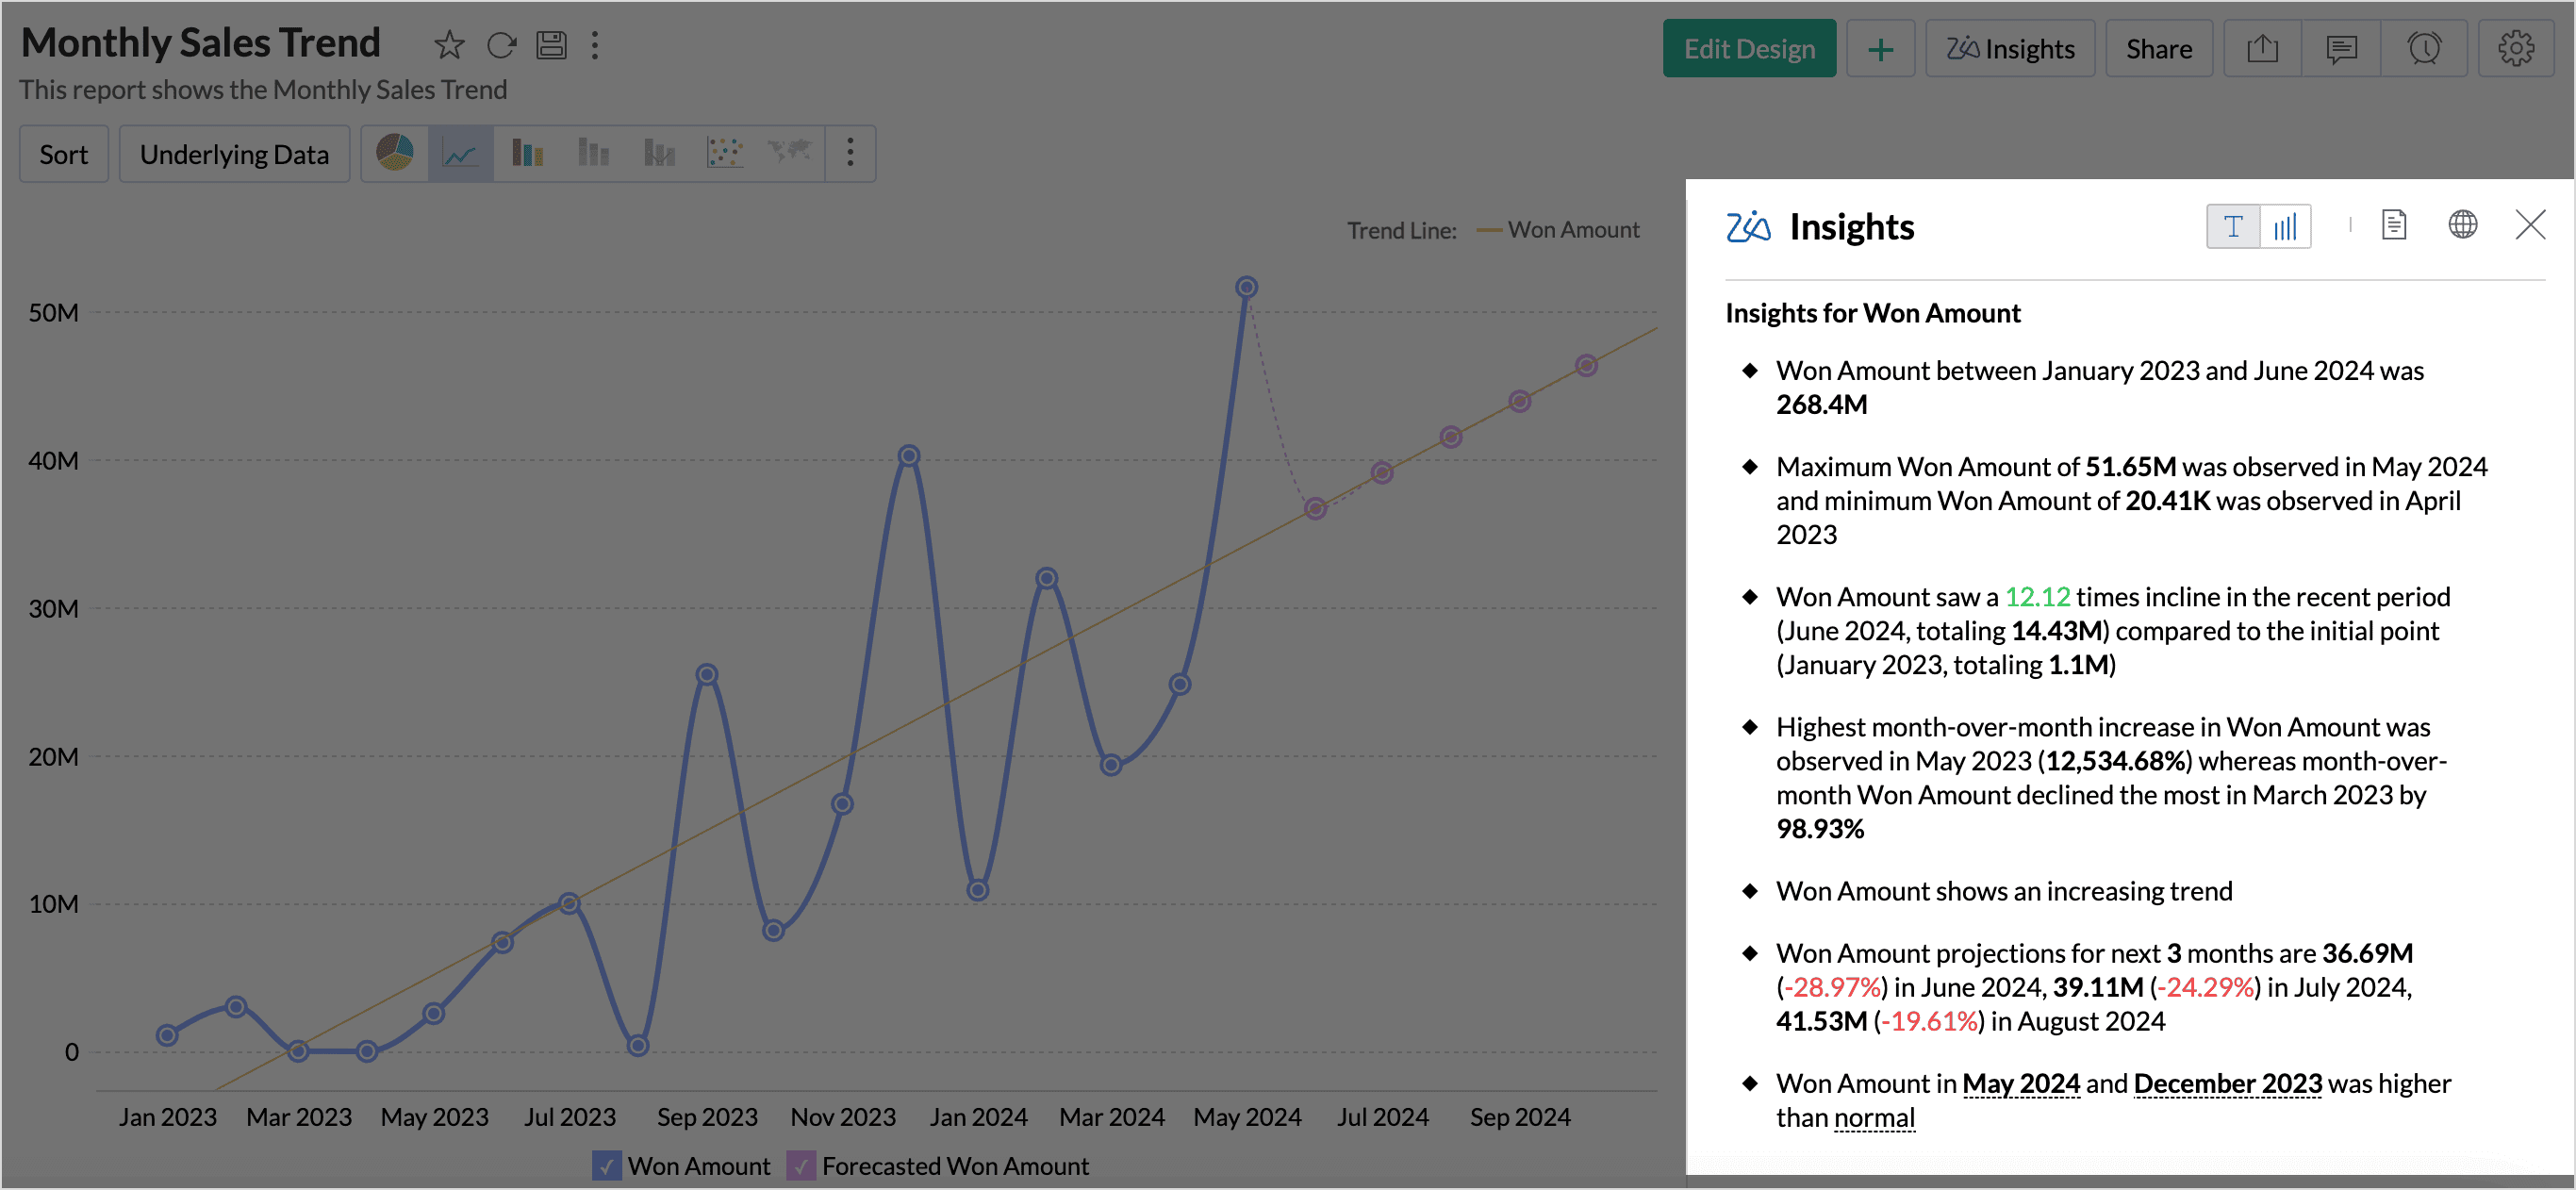
Visual Insights: It is a visual depiction of the textual insights. It analyzes each element in the report and selects the most suitable and intuitive visualization to illustrate the key points clearly. It highlights specific sections and pin-points spikes and dips in the data. Visual insights facilitate multi-dimensional interpretations like comparison, contribution, distribution, trends and proportions, all at once. This eliminates the need for creating multiple reports, providing a holistic view of your data in one visualization.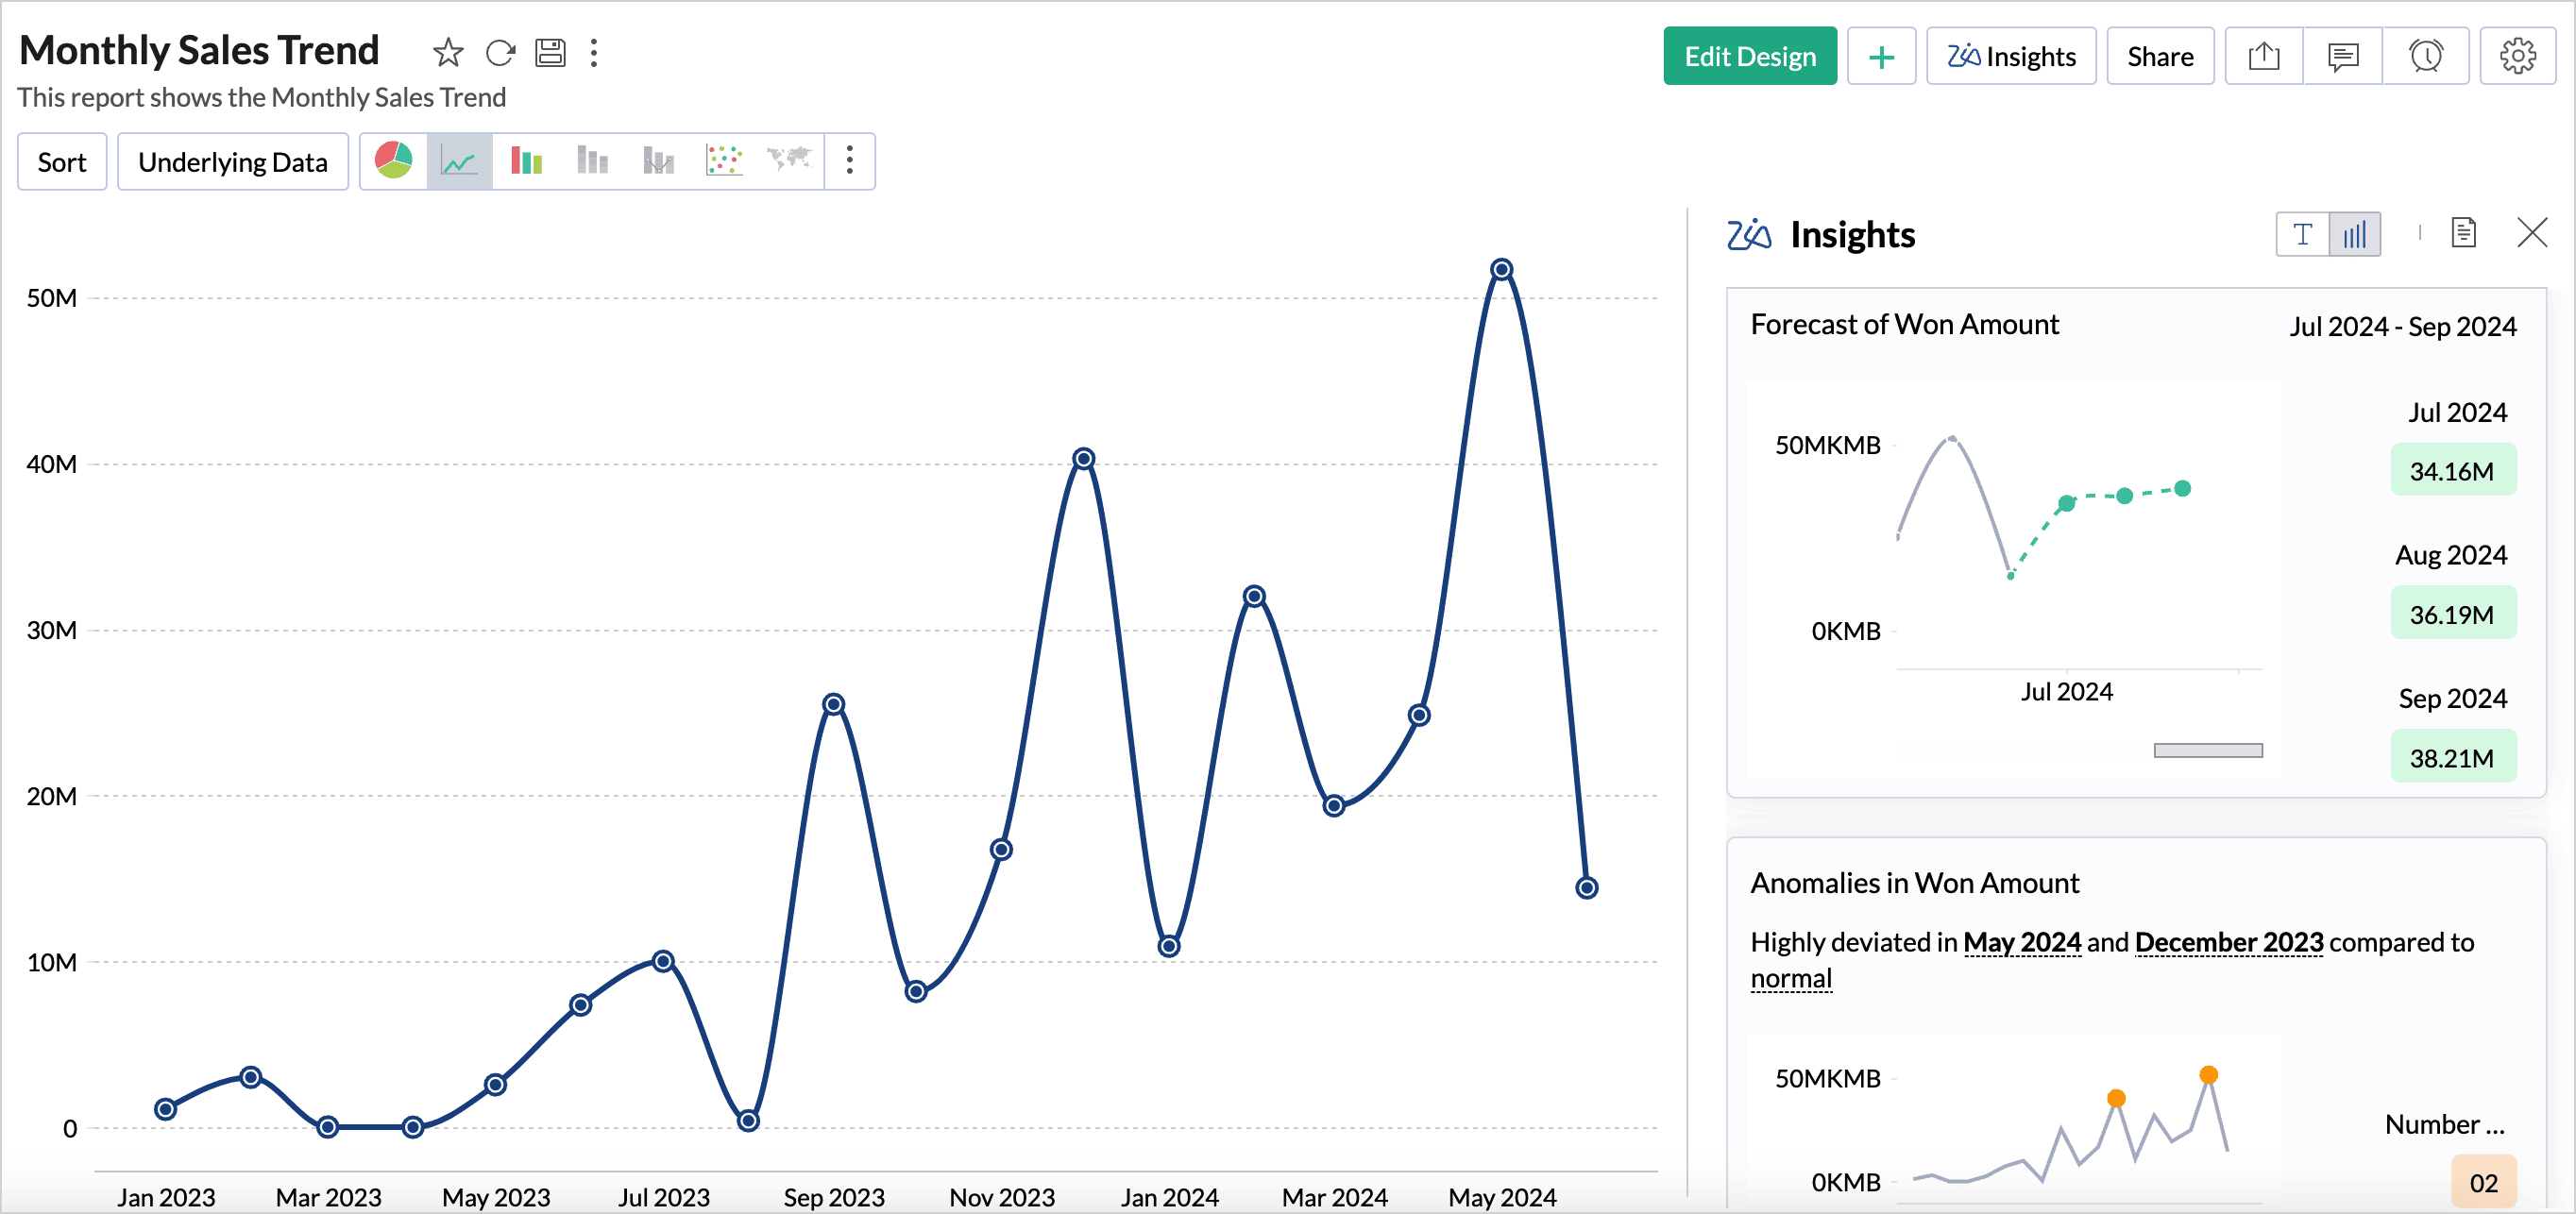
Supported Languages
Zia Insights is available in three languages: English, Spanish, and French. The default language is the one configured with the Zoho Analytics account. Click the Language Settings icon on the right and choose the preferred language from the drop-down.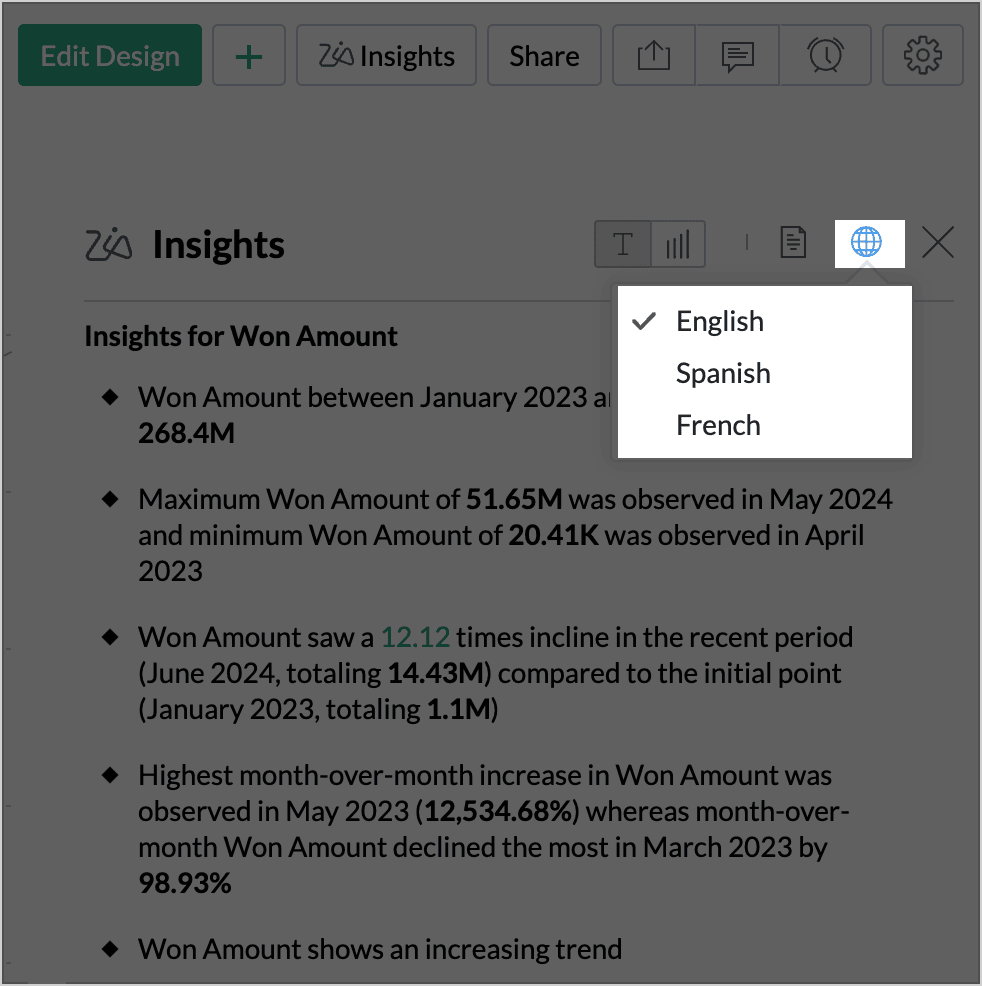
Invoking Zia Insights
You can invoke the Zia Insights either from the individual report or from reports embedded in a dashboard.
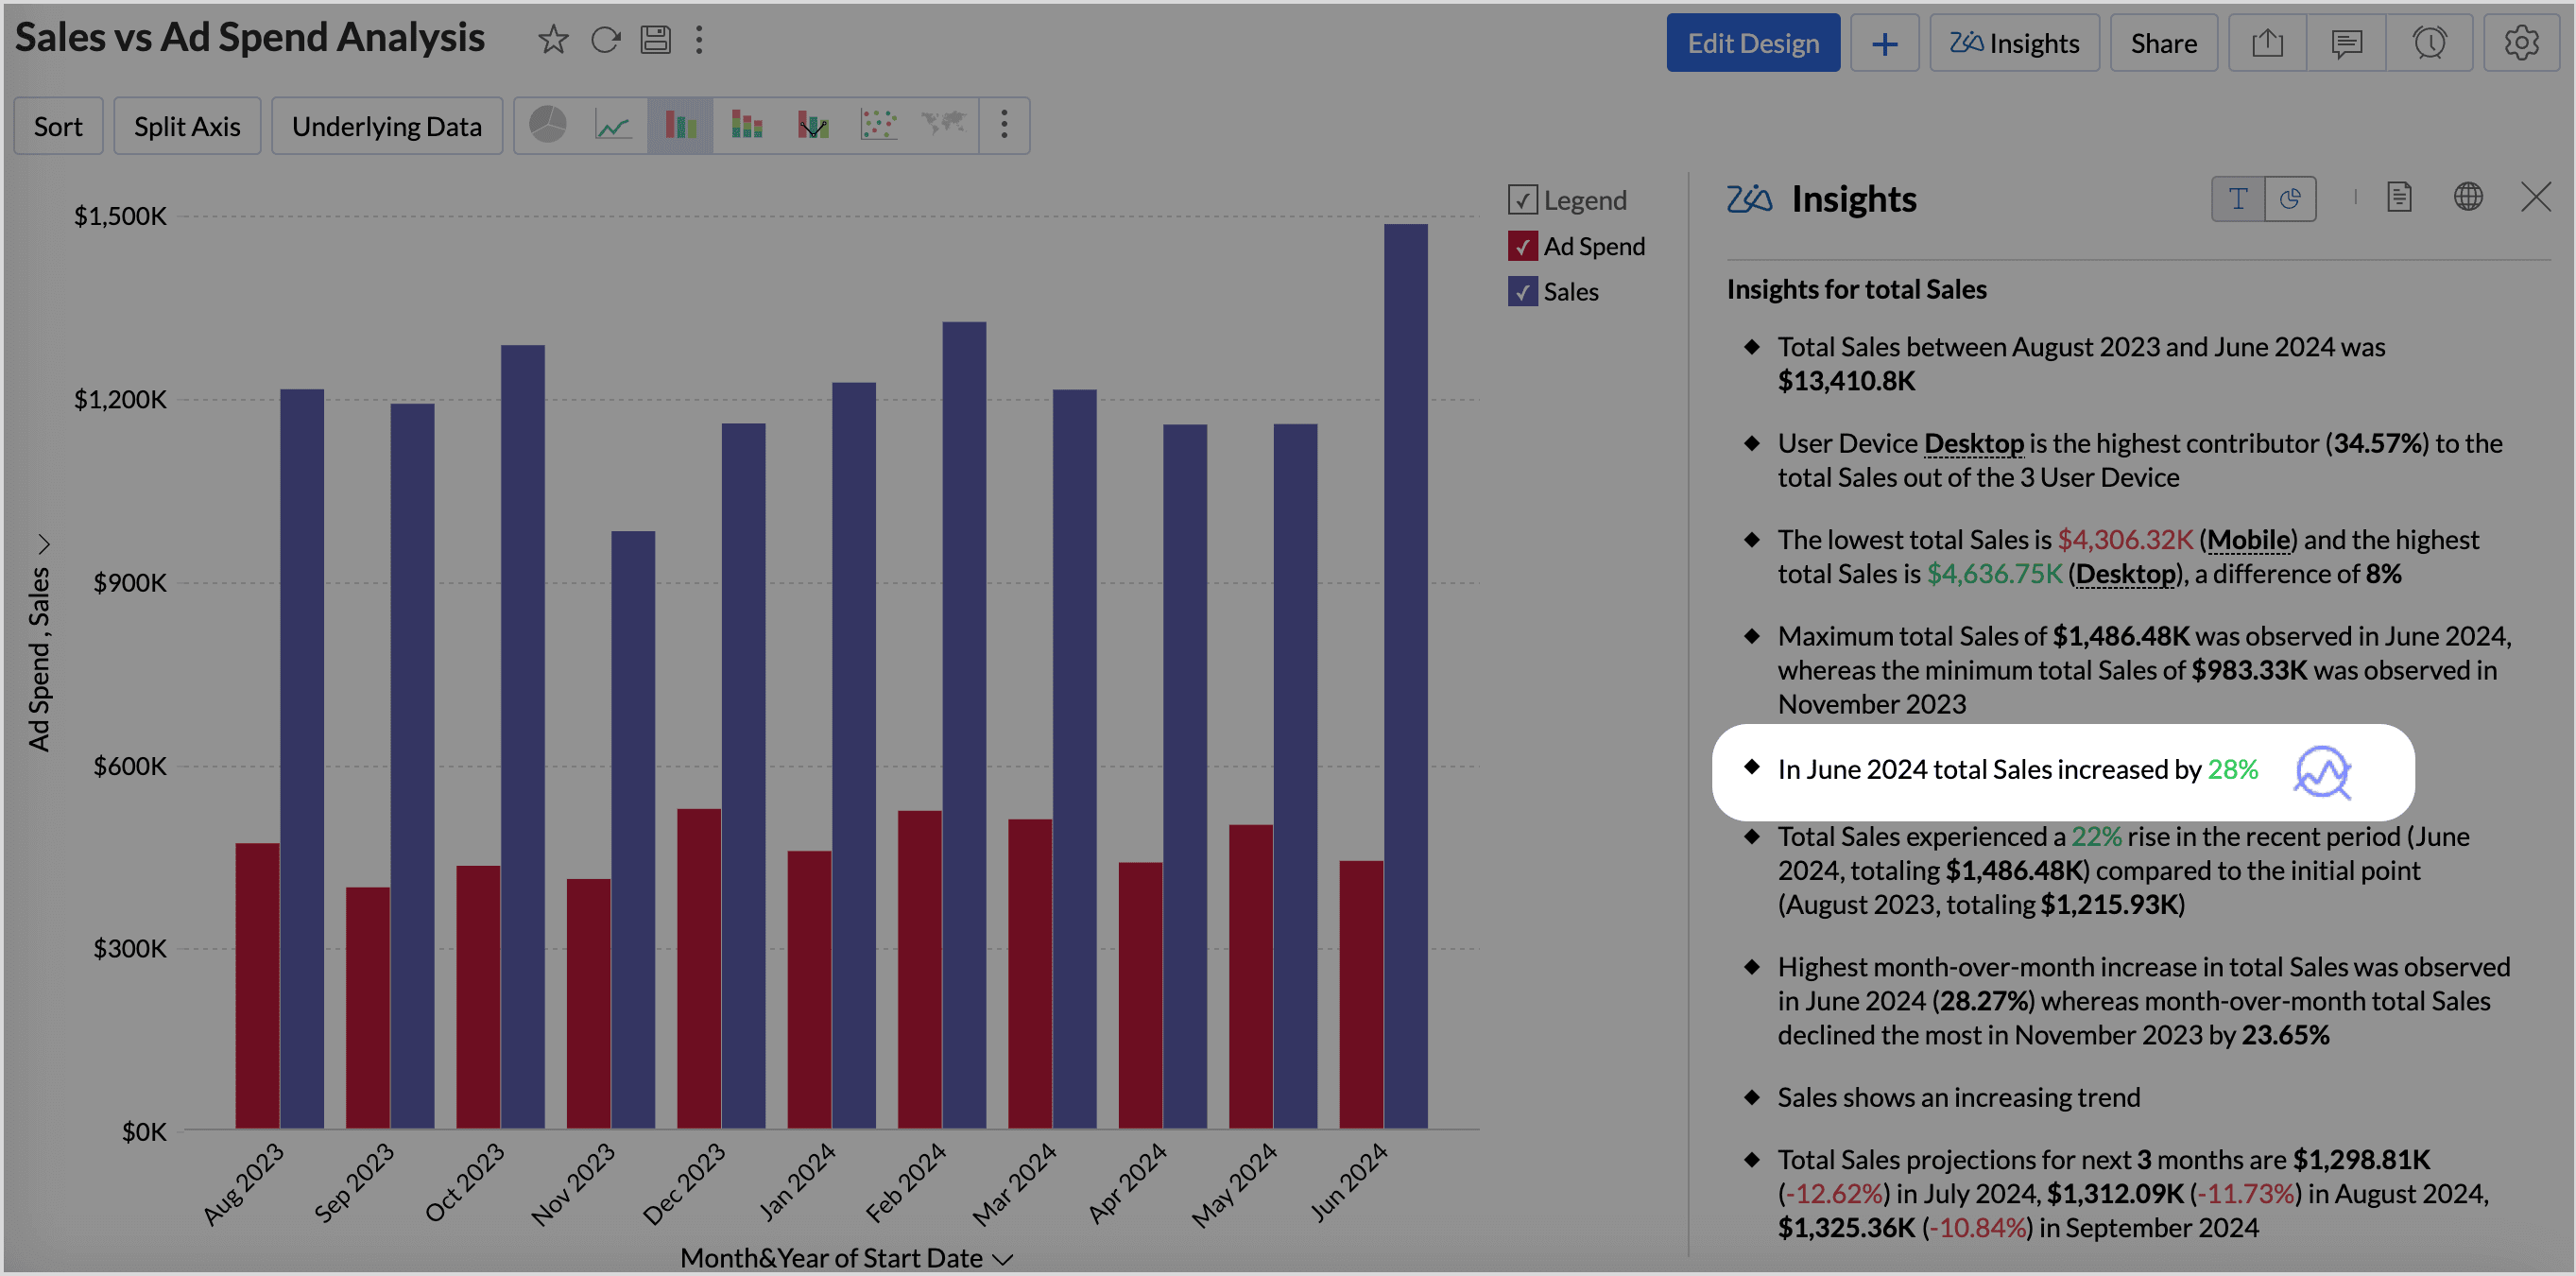
From Report
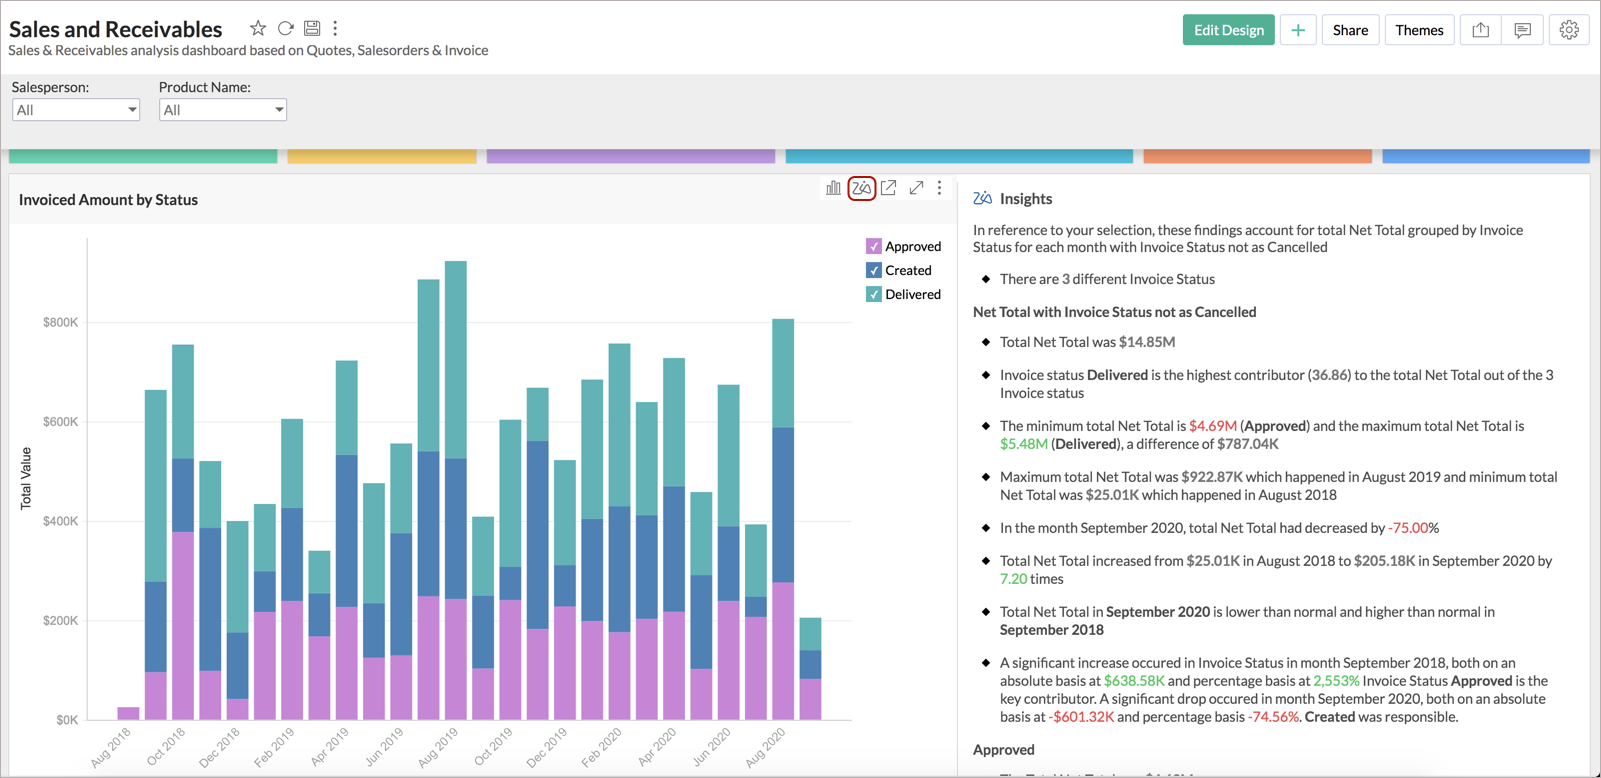
Clicking the Zia Insights button at the top-right will get you the automatic insights displayed on the right side of the report. 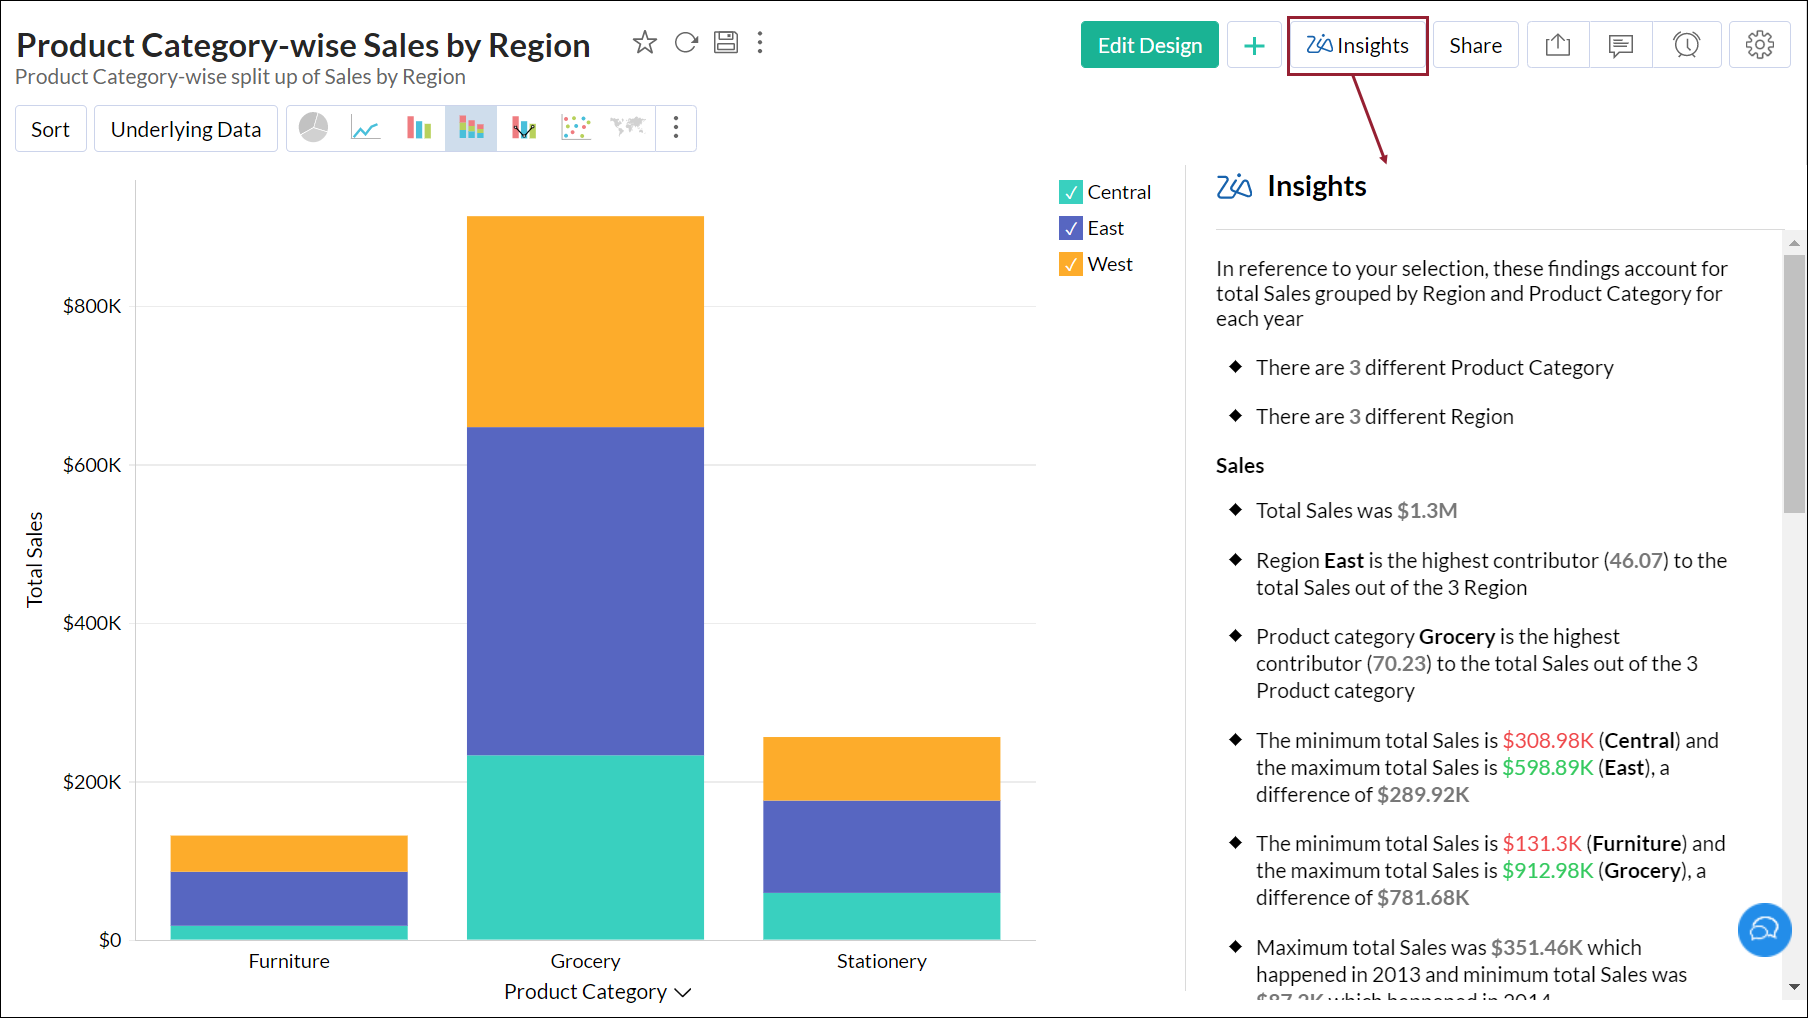
From Dashboard
Clicking the Zia icon from the toolbar of a report (embedded within the dashboard) will also get you the automatic insights of the report.
Customize Zia Insights
Our AI powered analytical assistant, Zia, provides insights across various categories. You can customize and control both the columns (measures and dimensions) and the categories to generate insights that are most specific to your business needs.
Click the Settings icon in the top right corner to customize the Zia Insights settings.
Verbosity
Zia Insights provides three verbosity levels for generating insights. Each level offers contextually tailored insights highlighting key metrics. Click the Verbosity icon to choose your preferred level. By default, the Medium verbosity level is selected.
The following are the verbosity levels available in Zoho Analytics,
Low-verbosity provides a high level summary of key metrics. They include aggregated totals, min-max values, and highest contributors. Insights are generated only based on the meta information available in the report. These insights are ideal for a quick overview.
Medium-verbosity includes an appropriate date dimension, even if it is not used in the report, and generates insights focused on time series analysis, including trend identification, period-over-period comparisons, seasonality detection, forecasting, and anomaly detection. It captures patterns, fluctuations, and key changes across different time periods.
High-verbosity provides a comprehensive, multidimensional analysis. It chooses the best dimension from the meta-information used in the report or selects a suitable dimension available in the data for generating insights.
It provides contextual insights for the top factors for the selected dimensions, which include key patterns, variations, and fluctuations.
How are the Columns Selected for Insights Generation?
- Date columns are selected based on the following conditions:
- Consider the column priorities configured by the user.
- Select the date column that is widely used in other reports.
- Calculate the hop distance from the date column to the measure or non-date dimension columns.
- Dimension columns are selected based on the hop distance from the dimension to the measure columns.
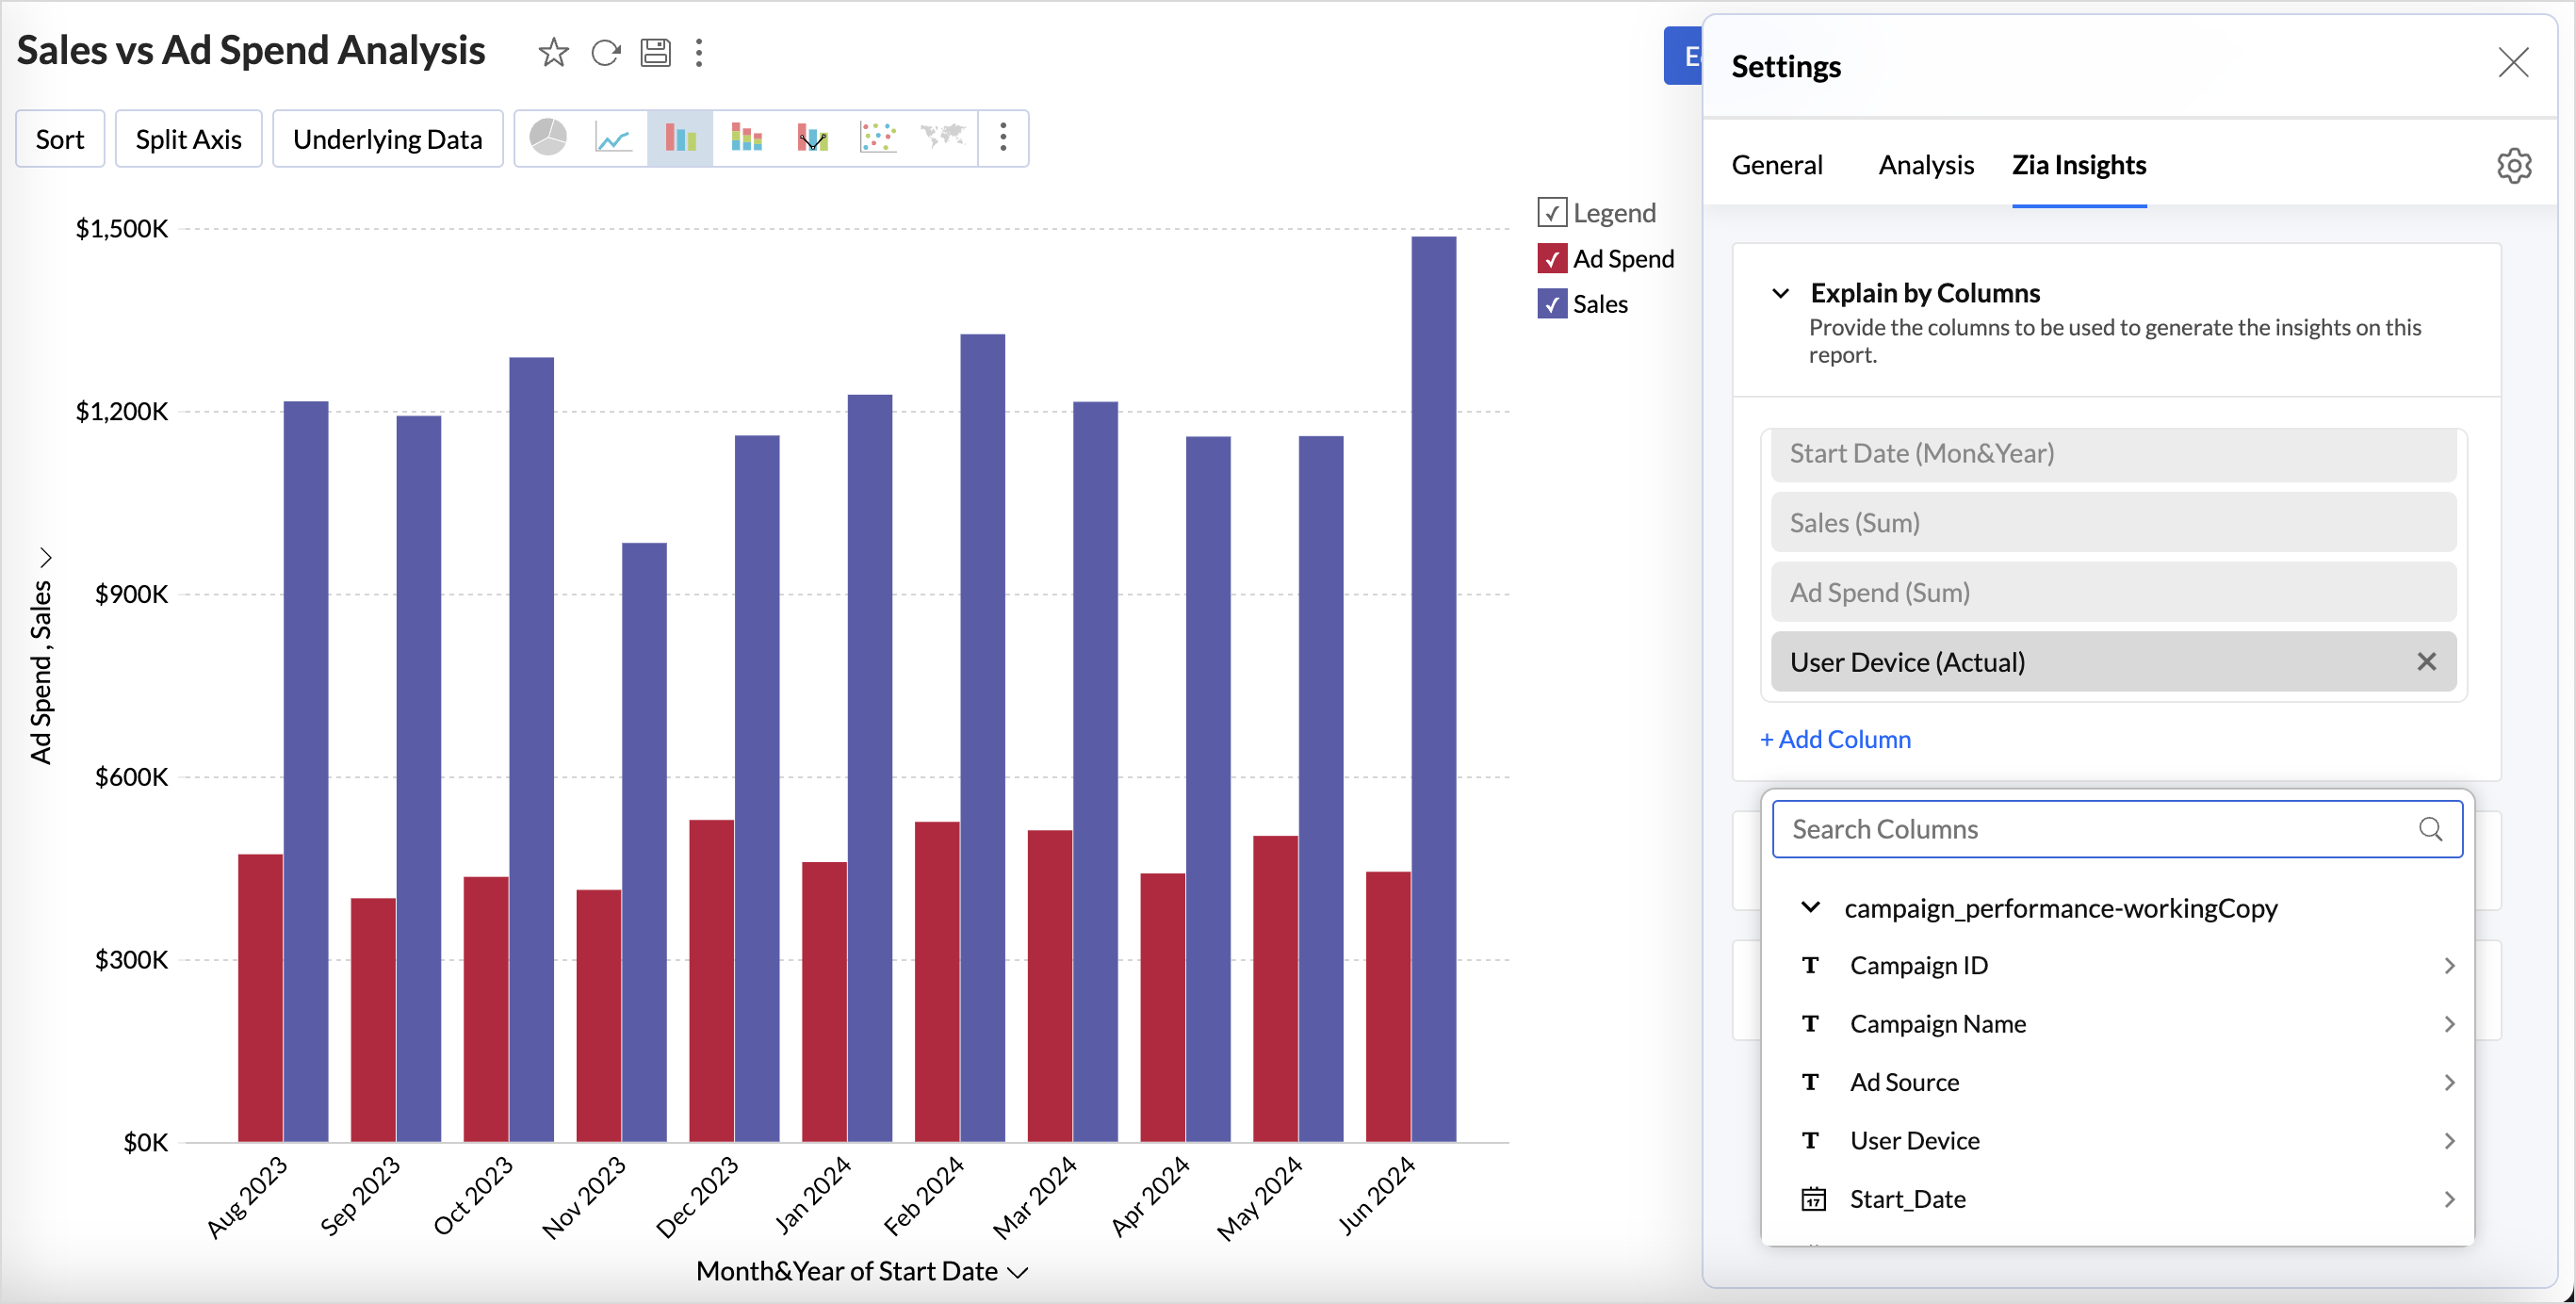
Explain by Column
This option allows you to choose the important metrics and dimensions columns to be used for generating Zia Insights. It is recommended to choose at least one metric and one dimensional or categorical columns for insights.
- All the columns used in the report are selected by default.
- Click Add Column to include the relevant metrics or dimensional columns to be used for generating insights. The selected columns will be used for generating Zia Insights.
Insight Categories
Zoho Analytics allows you to choose the type of insights that needs to be generated for reports. It helps you to focus only on the insight that you want. Zia Insights is broadly classified into the following five key areas: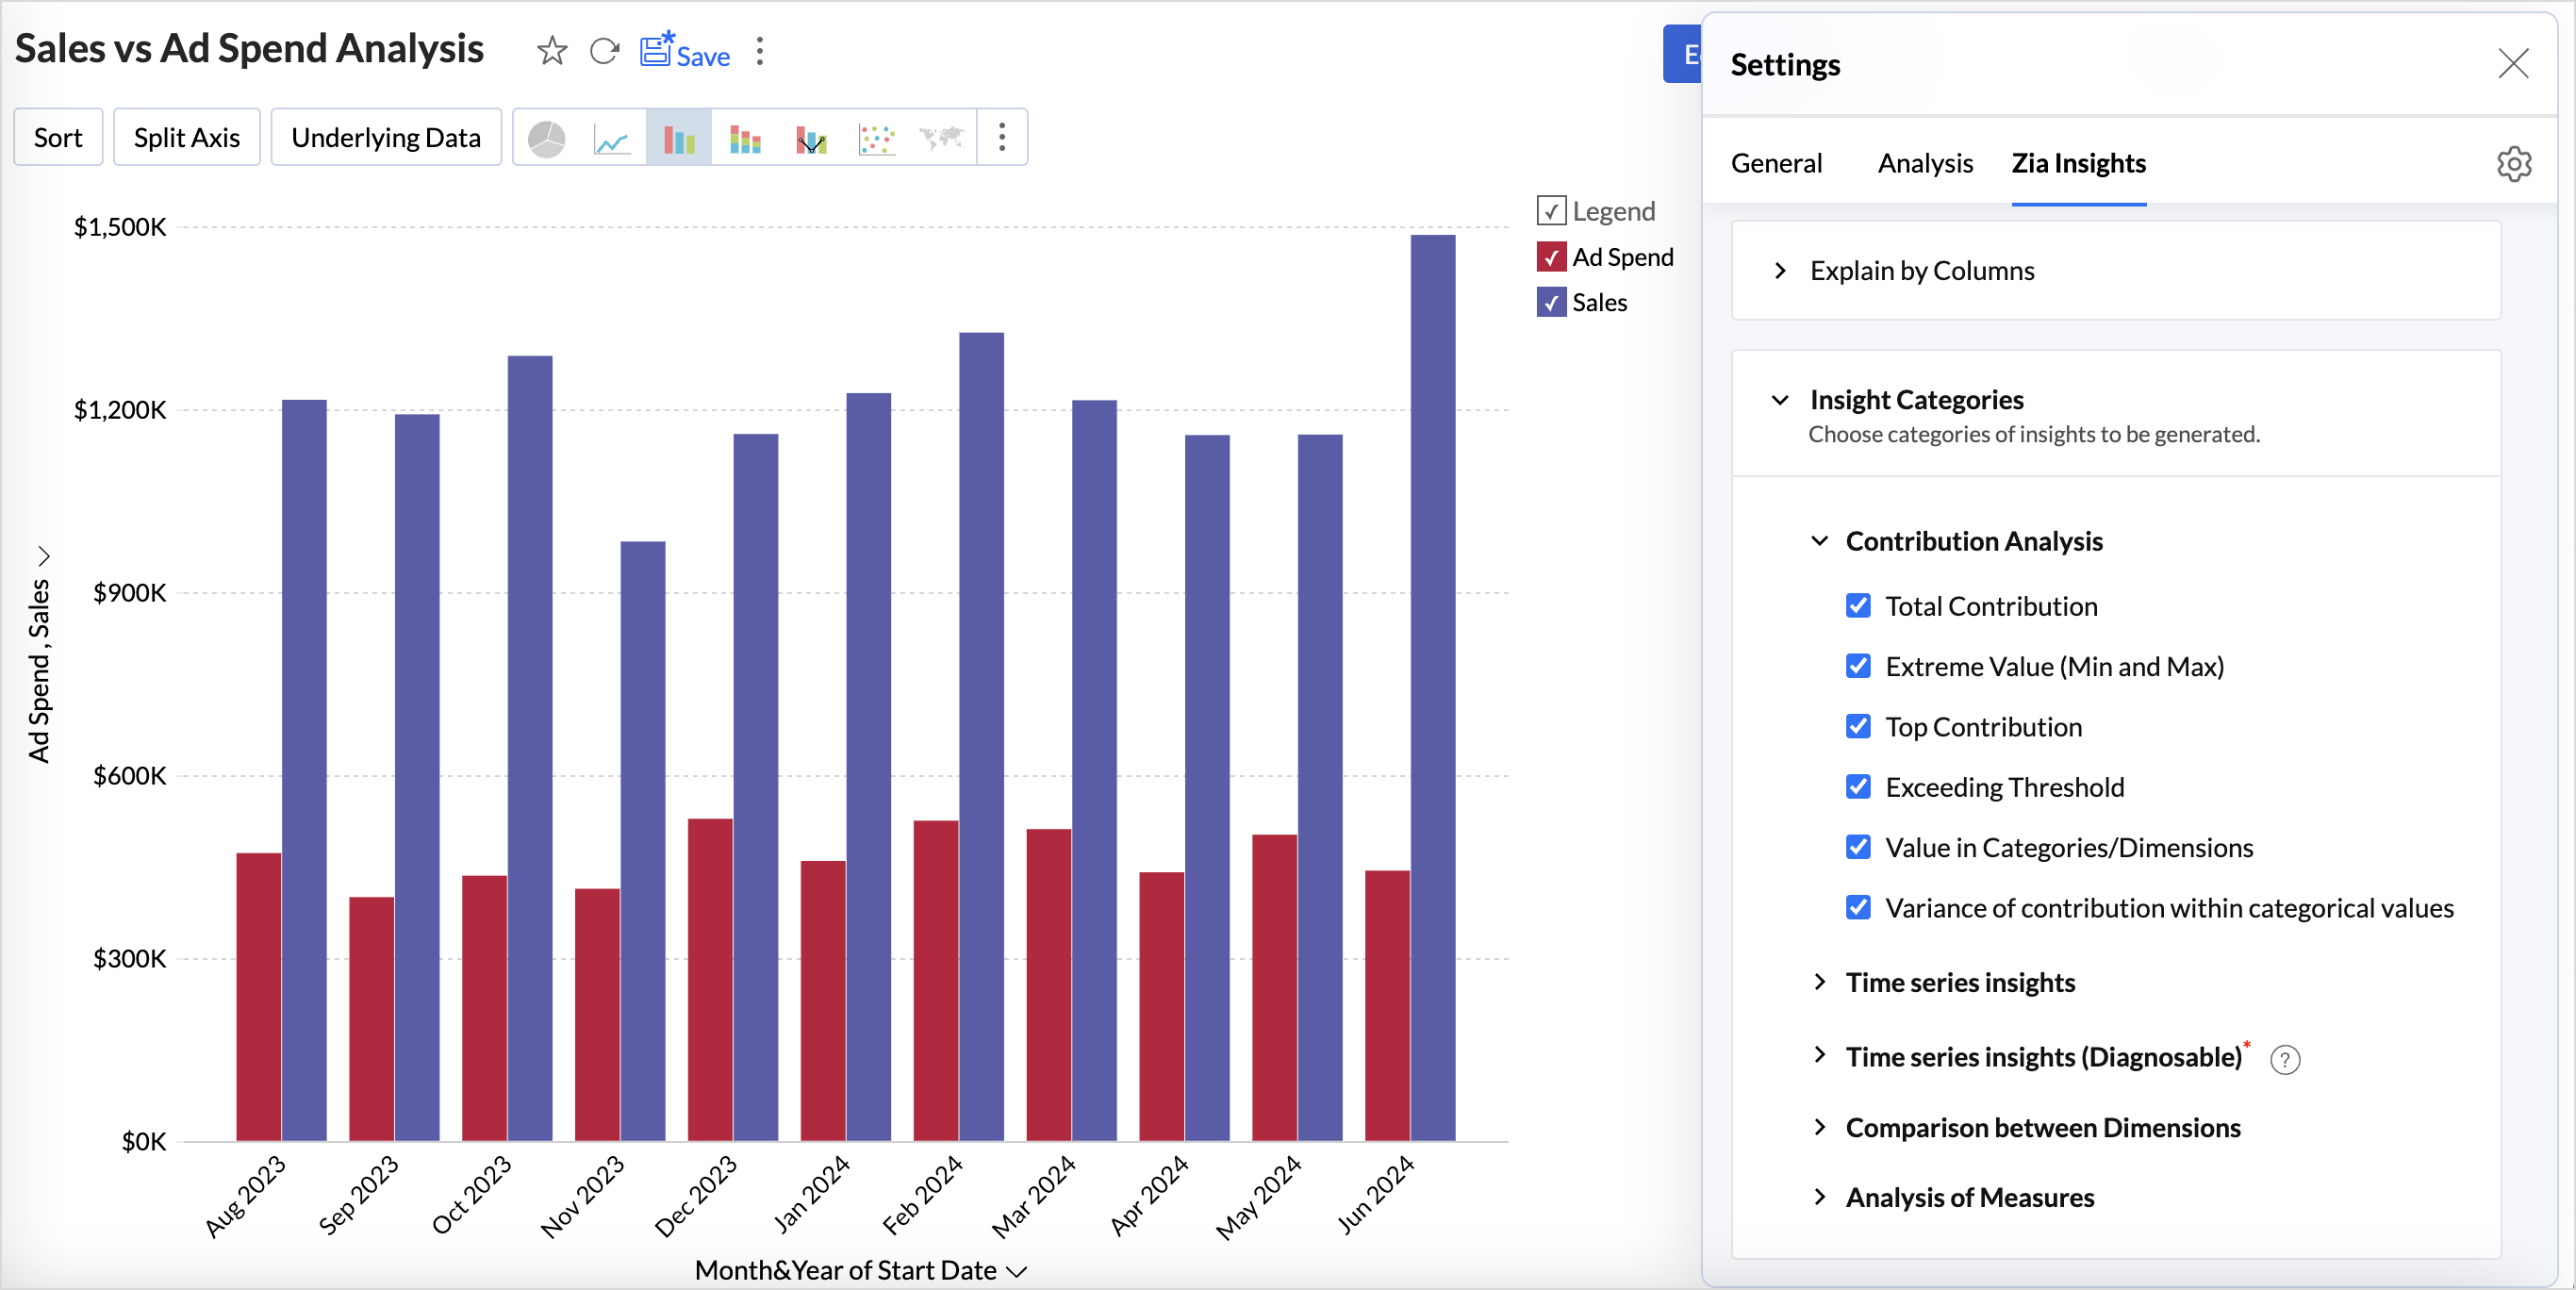
Contribution Analysis
Contribution analysis breaks down the impact and extent of various factors on an overall result. It analyzes the weightage of each factor in relation to a particular outcome. By understanding this, organizations can identify which factors significantly influence results and prioritize their strategies accordingly.
To generate insights about contribution, at least one measure and one dimension column are required.
| Insight | Description |
| Total Contribution | Cumulative sum of values obtained from all categories or dimensions, reflecting the overall impact. |
| Extreme Value | Highlights the minimum and maximum values of a metric, providing insights into the range, variability, and identifying outliers, trends, and boundaries. |
| Top Contributors | Identifies multiple factors that contribute to the overall result of a metric, based on the Pareto principle. |
| Value in Categories and Dimensions | Breakdown of the total outcome by showing how each category or dimension contributes to the overall result, helping identify relative impact and distribution. |
| Value in Categories | Indicates the number of categories within a dimension, highlighting the distribution across segments. |
| Variance of Contribution | Measures the degree of variability or dispersion in the contributions of different factors toward an overall outcome. |
Time Series Insights
Time Series Insights analyzes trends and patterns within sequences of data points that are recorded or collected at consistent time intervals. It focuses on interpreting the changes in data over time to uncover valuable insights, such as identifying trends, detecting anomalies, and predicting future outcomes based on historical patterns.
To generate time series insights, at least one time series column like date is required
| Insights | Description |
| Trend | Shows how a particular measure changes over time, indicating whether it is increasing, decreasing, or remaining stationary. |
| Seasonality | Helps identify recurring patterns or fluctuations in data at regular intervals, often driven by external factors like time of year, holidays, or cyclical events. |
| Forecasting | Predicts future values based on historical data, providing an outlook on potential trends and outcomes. |
| Anomalies | Highlights data points that significantly deviate from the observed trend, indicating potential outliers or unexpected changes. |
| Period-over-Period Analysis | Compares data from one period to another to identify changes, trends, or growth over time, offering insights into performance changes. |
| Start vs End Period Analysis | Highlights how a specific metric has changed from the beginning to the end of a defined period, indicating if it has increased, decreased, or remained stable. |
| Recent Time Period Analysis | Compares data from the most current period to the immediately previous period, identifying trends, patterns, or changes in performance. |
Comparison between Dimensions
Comparison between dimensions compares the performance of a metric across various dimensions and helps understand how values within each dimension perform relative to one another.
To generate insights based on comparison between dimensions, at least one measure column and at least two-dimensional columns are required.
- Trend across series shows the performance trends of each value within a dimension over time.
- Variance across dimensions shows the degree of variability of categorical values in a dimension over a period of time.
Analysis of Measures
The analysis of measures computes the correlations between measures and their respective proportions. To generate insights for analysis of measures, at least two measure columns are required.
Key Driver Analysis (Diagnostic insights)
Key driver analysis is a machine learning technique that identifies the key factors that significantly influence a target metric and the degree to which these factors impact the outcome (results). It is a robust method that uncovers the causes behind the observed trends of the target metric.
Key driver Analysis (KDA) or diagnostic insights are automatically generated for all time series insights without requiring manual configuration. These insights help identify the factors influencing trends, anomalies, spikes, declines, and significant changes in the target metric over time.
Based on the business context and data patterns within the workspace, the AI powered analysis intelligently selects the most relevant influencing factors that affect the Target metric.
A maximum of five dimensions and three measures are used as factors to analyze how they have influenced the target metric.
Components of Key Driver Analysis
Key driver analysis hinges on the following two main components,
Target Metric
Target Metric is the dependent variable or metric for which you want to assess the different factors that lead to a specific trend. For instance, revenue is a target metric used to evaluate the effectiveness of sales strategies and marketing campaigns.
Influencing Factors
Influencing Factors or key drivers are the independent variables (factors) features that impact the outcome of the target metric. These factors contain information about what affects the trends observed in the data. Influencing Factors can be both quantitative and qualitative.
- Quantitative Factors: Numerical data that can be measured and analyzed statistically. For instance, Advertising Spend is the amount invested in marketing campaigns, which can impact revenue.
- Qualitative Factors: Non-numerical data that provide details about behavior and preferences. For instance, The perception of a brand in the market, which can affect customer loyalty and purchasing behavior.
Managing Key Driver Analysis Configurations
Zoho Analytics automatically identifies and configures the most influential factors affecting the target metric for Key Driver Analysis (KDA) using AI-powered analysis and business context. These settings can be further reviewed and customized based on your analysis requirements.
For key driver analysis, Both measure and categorical fields can be used as influencing factors. A maximum of five dimensions and three measures can be used as factors to analyze how they have influenced the target metric.
- Click the Zia Insights Configuration Settings icon in the top-right corner of the Zia Insights pane.
- Navigate to the Key Driver Analysis (Diagnostic) section.
- You can view the Target Metric, Model used and the influencing factors (columns) used for generating diagnostic insights.
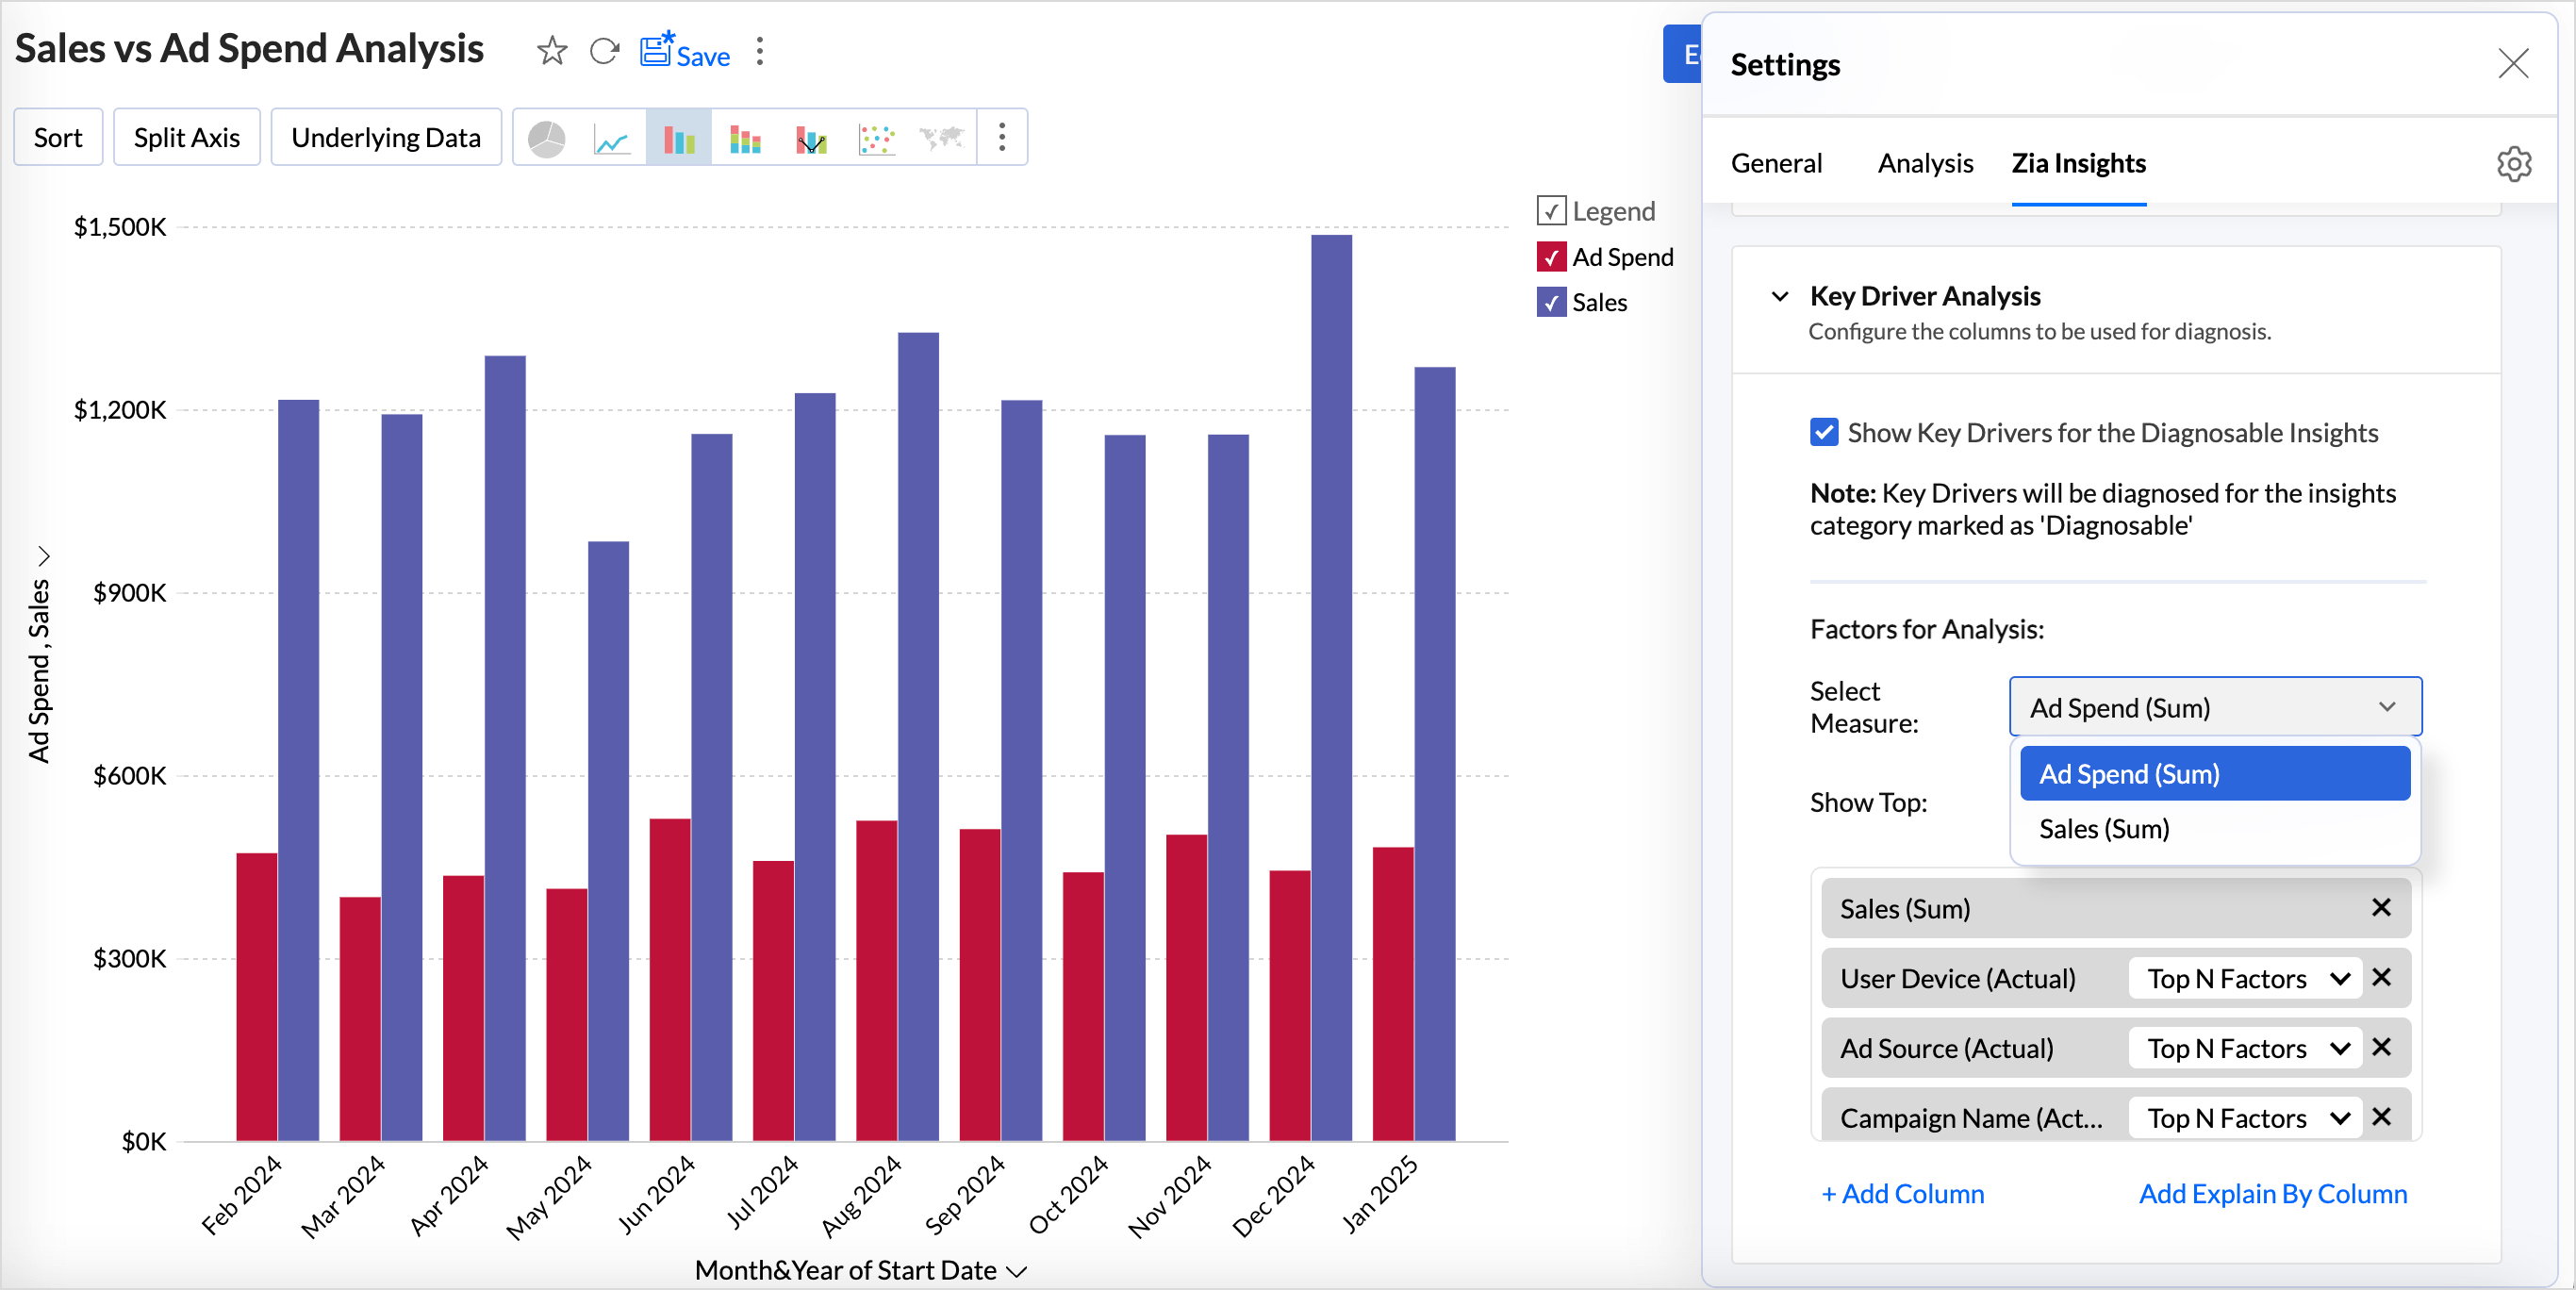
- The Factors for Analysis section displays all the influencing factors (drivers) selected for the diagnostic analysis.By default all the values in a categorical field is selected . You can review and refine the values considered for each driver by choosing whether to analyze the Top N factors, Bottom N factors, or specific Actual Values based on your analysis requirements.
- Click Add Column to include more factors for analysis. A maximum of five dimensions and three measures can be used. The Add Explain By column includes all selected columns from the Explain By columns for Key Driver Analysis.
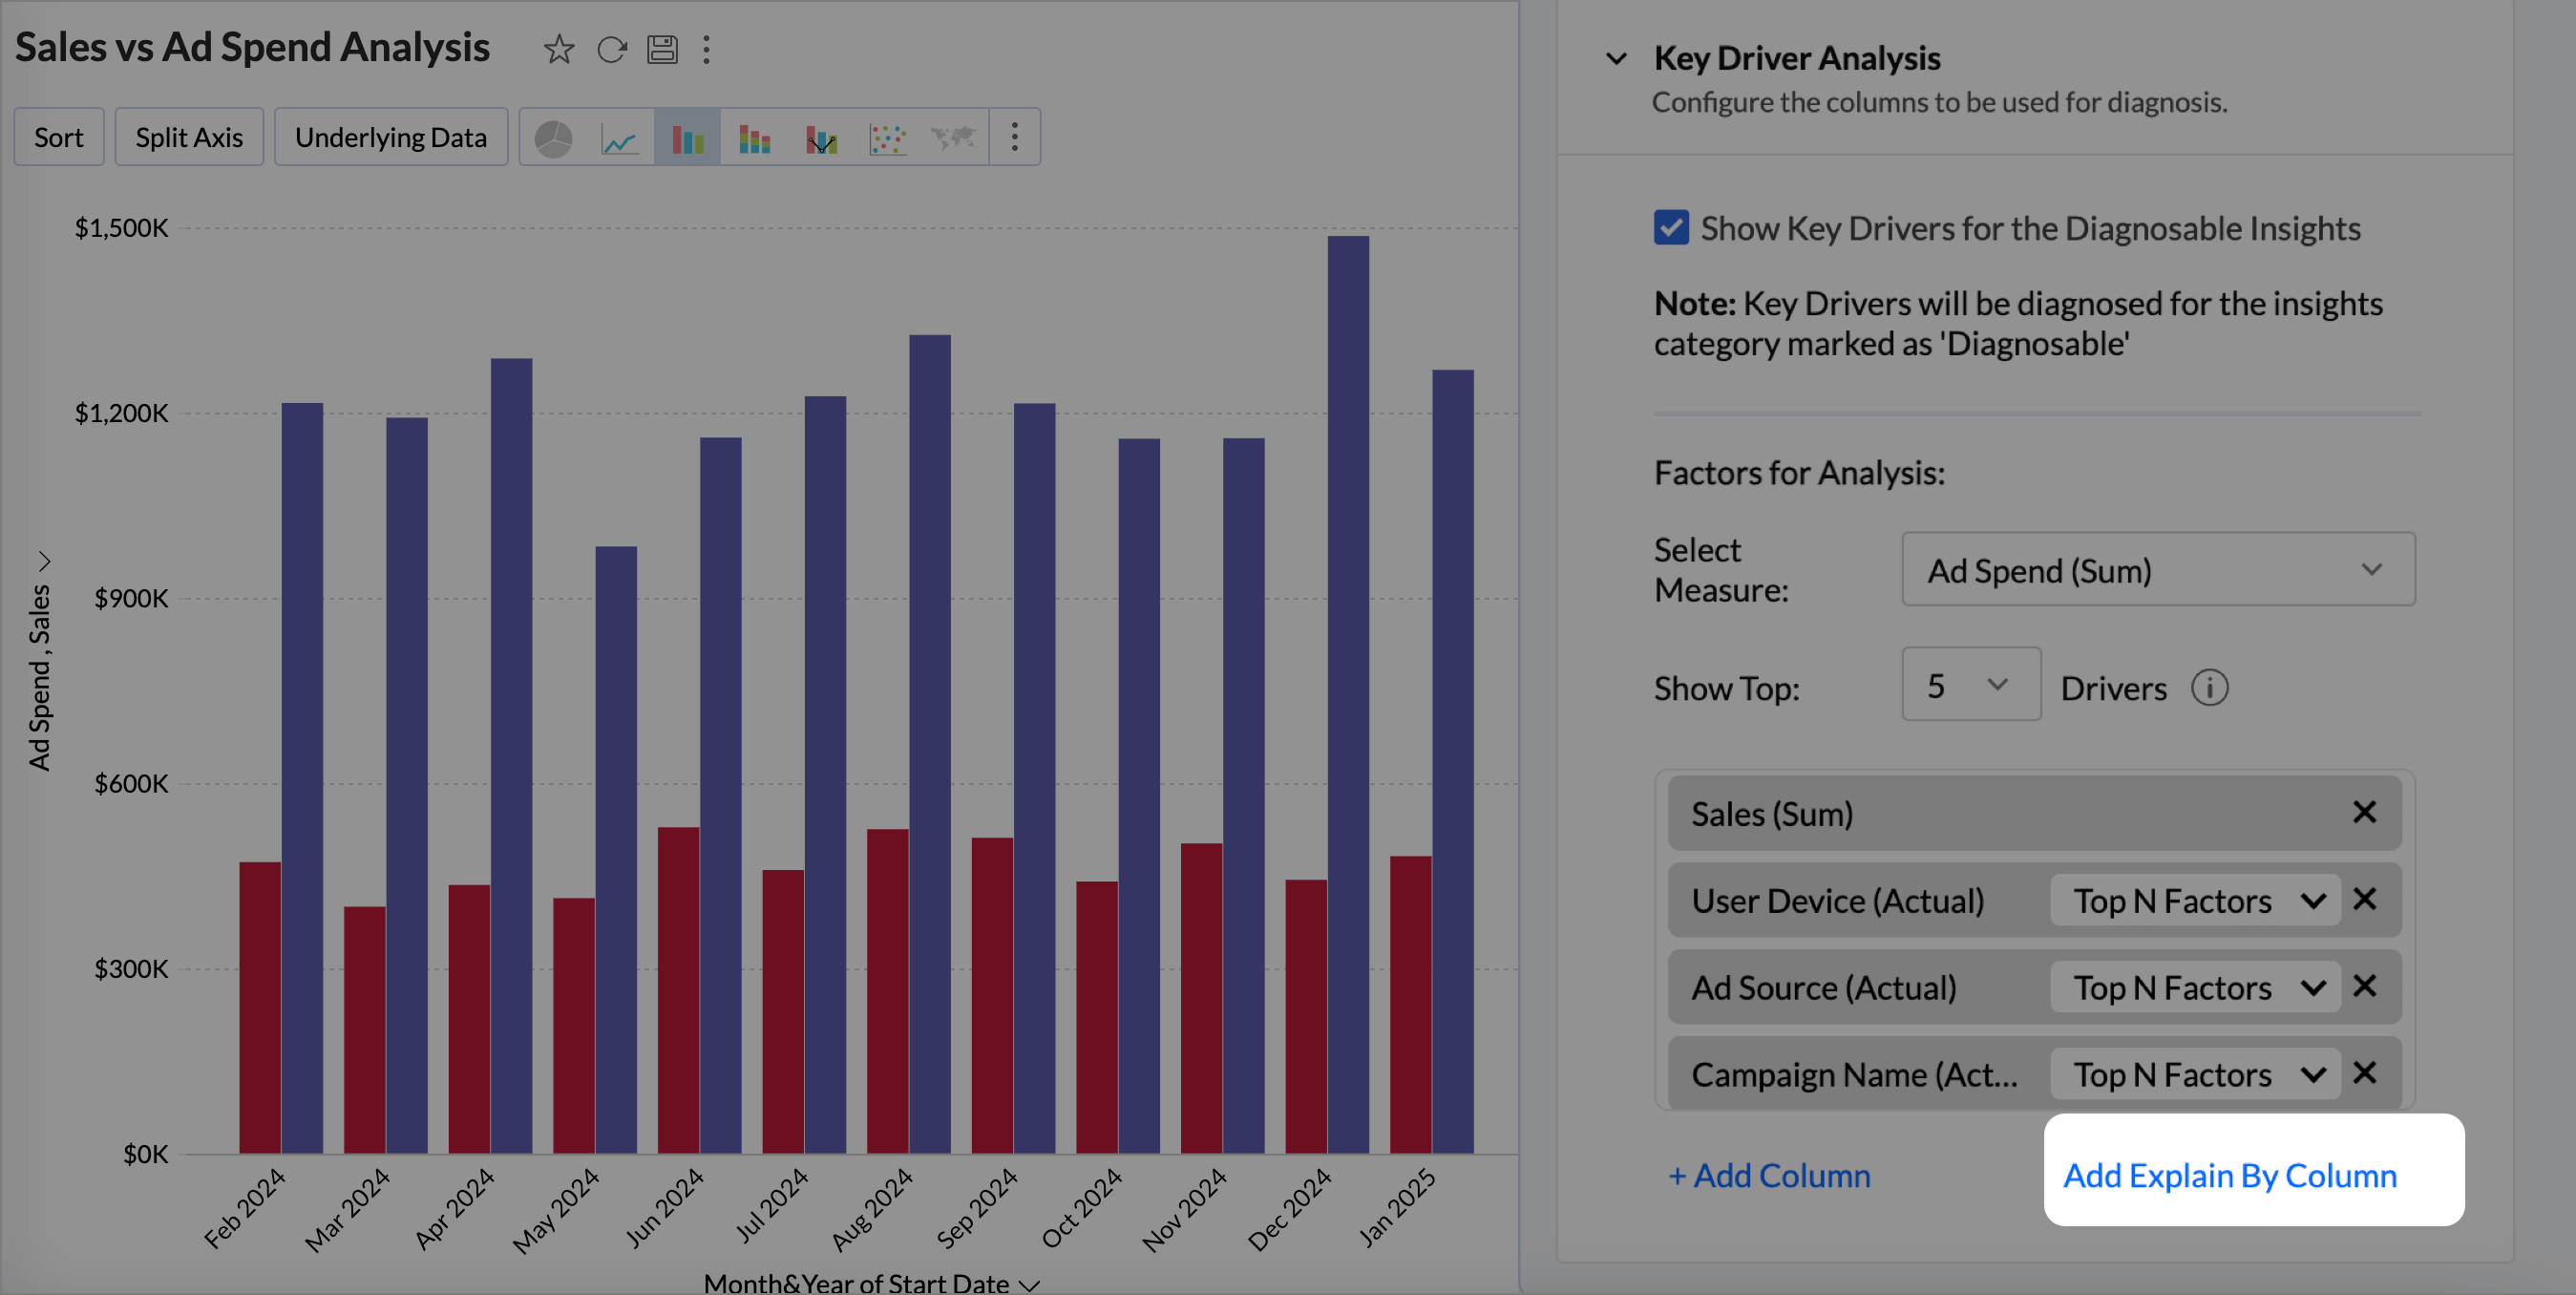
- Select the Enable Recommendations checkbox to generate prescriptive recommendations and suggested next actions based on the Key Driver Analysis (KDA) results.
- After reviewing and updating the settings, save the report to apply the changes and view the updated Zia Insights.
Interpreting the Results of Key Driver Analysis
Key Driver insights offer valuable analysis for time series trends, helping to identify the underlying factors behind increases or decreases and how the outliers or anomalies affect the results. These insights explain what is driving the changes, making it easier to understand the reasons behind shifting patterns over time.
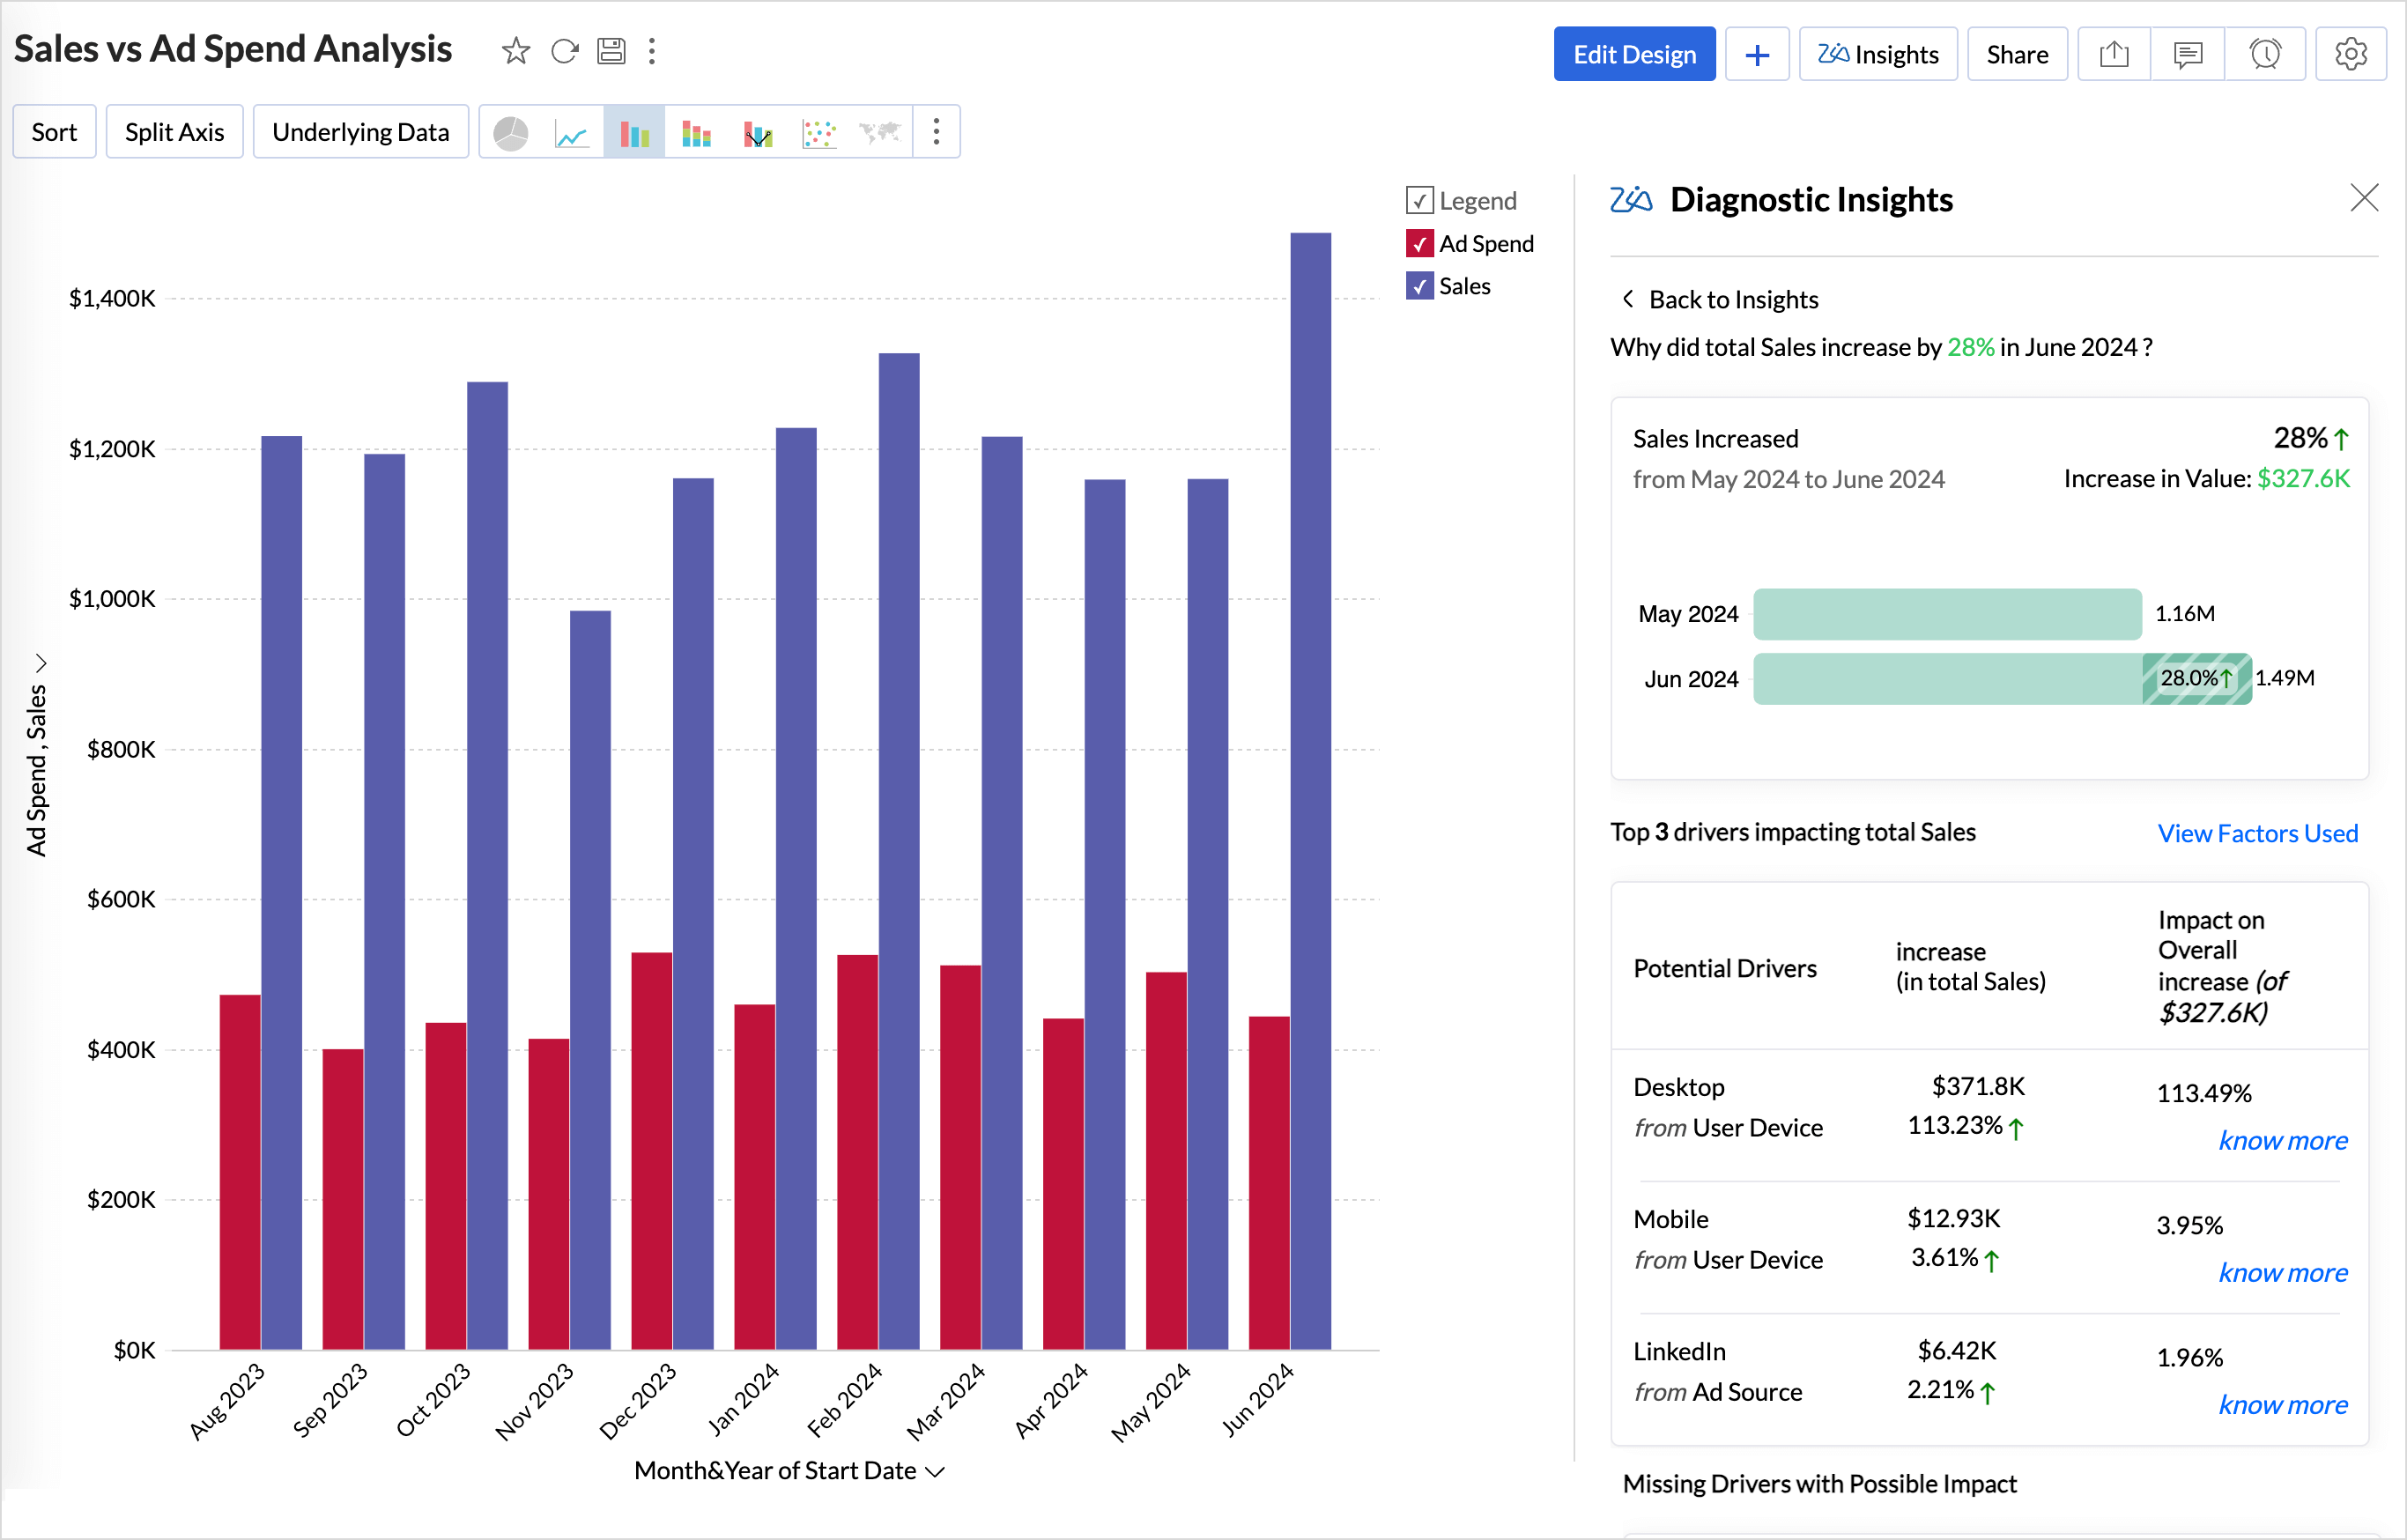
Viewing Diagnostic Insights
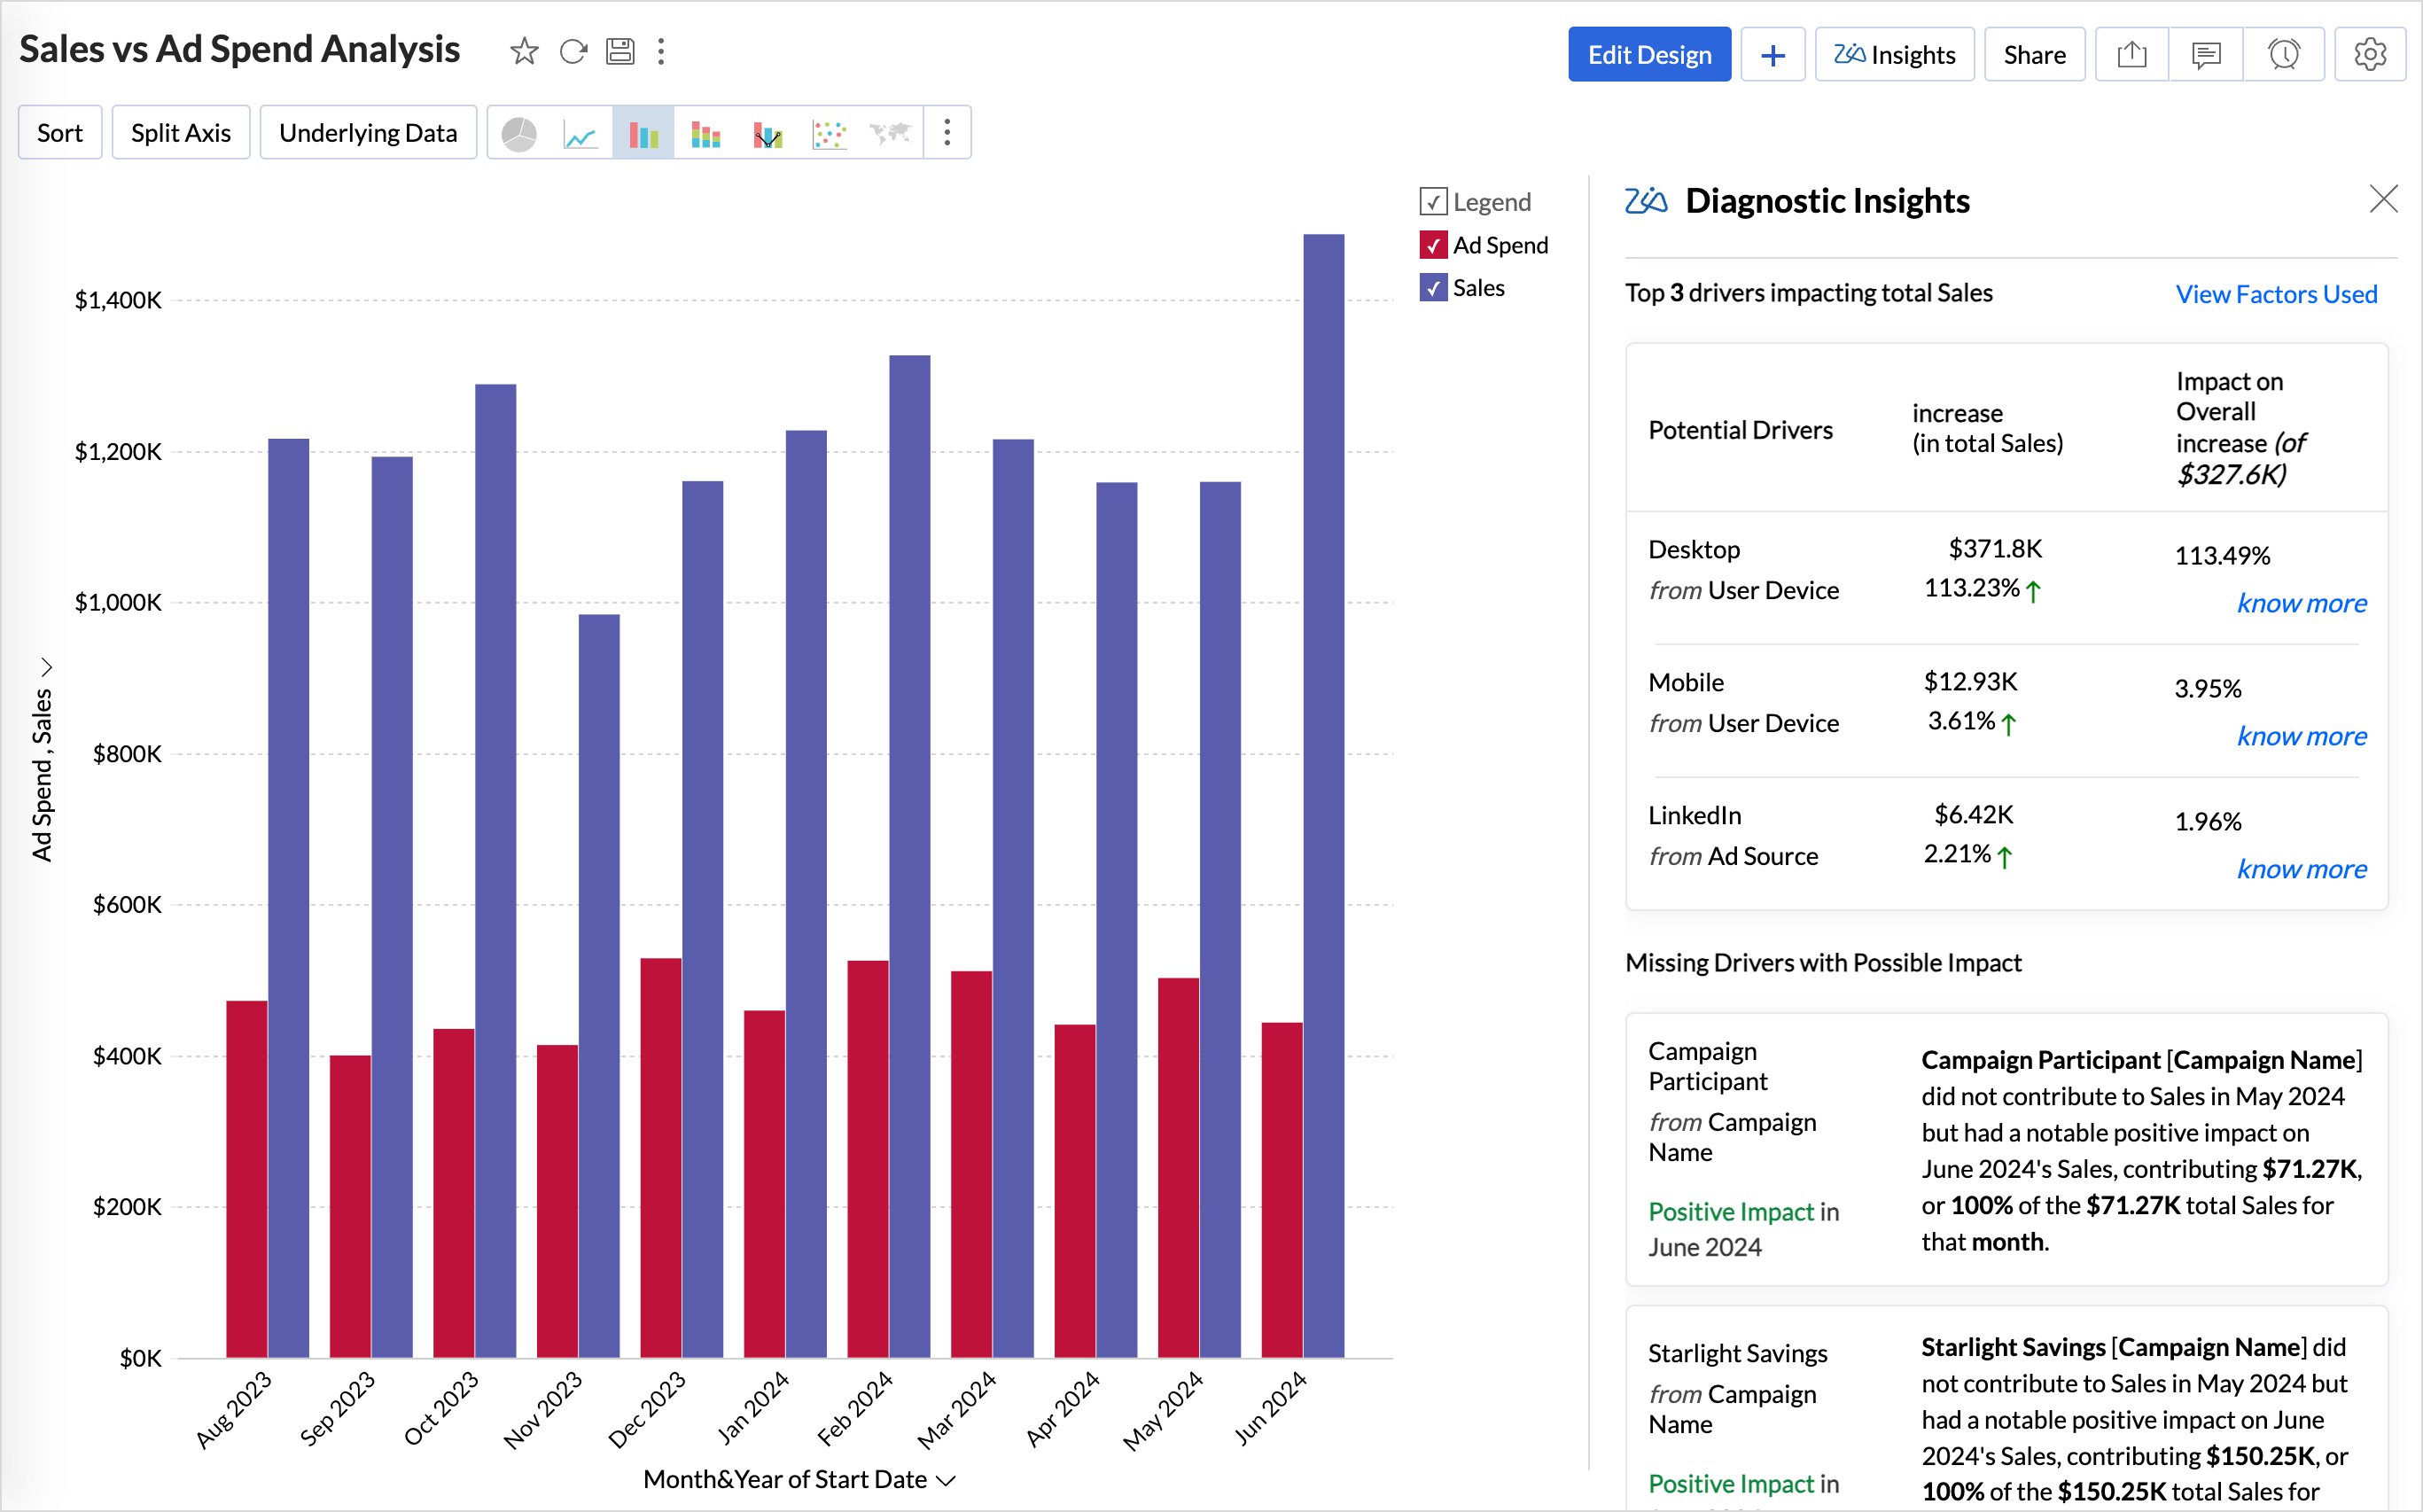
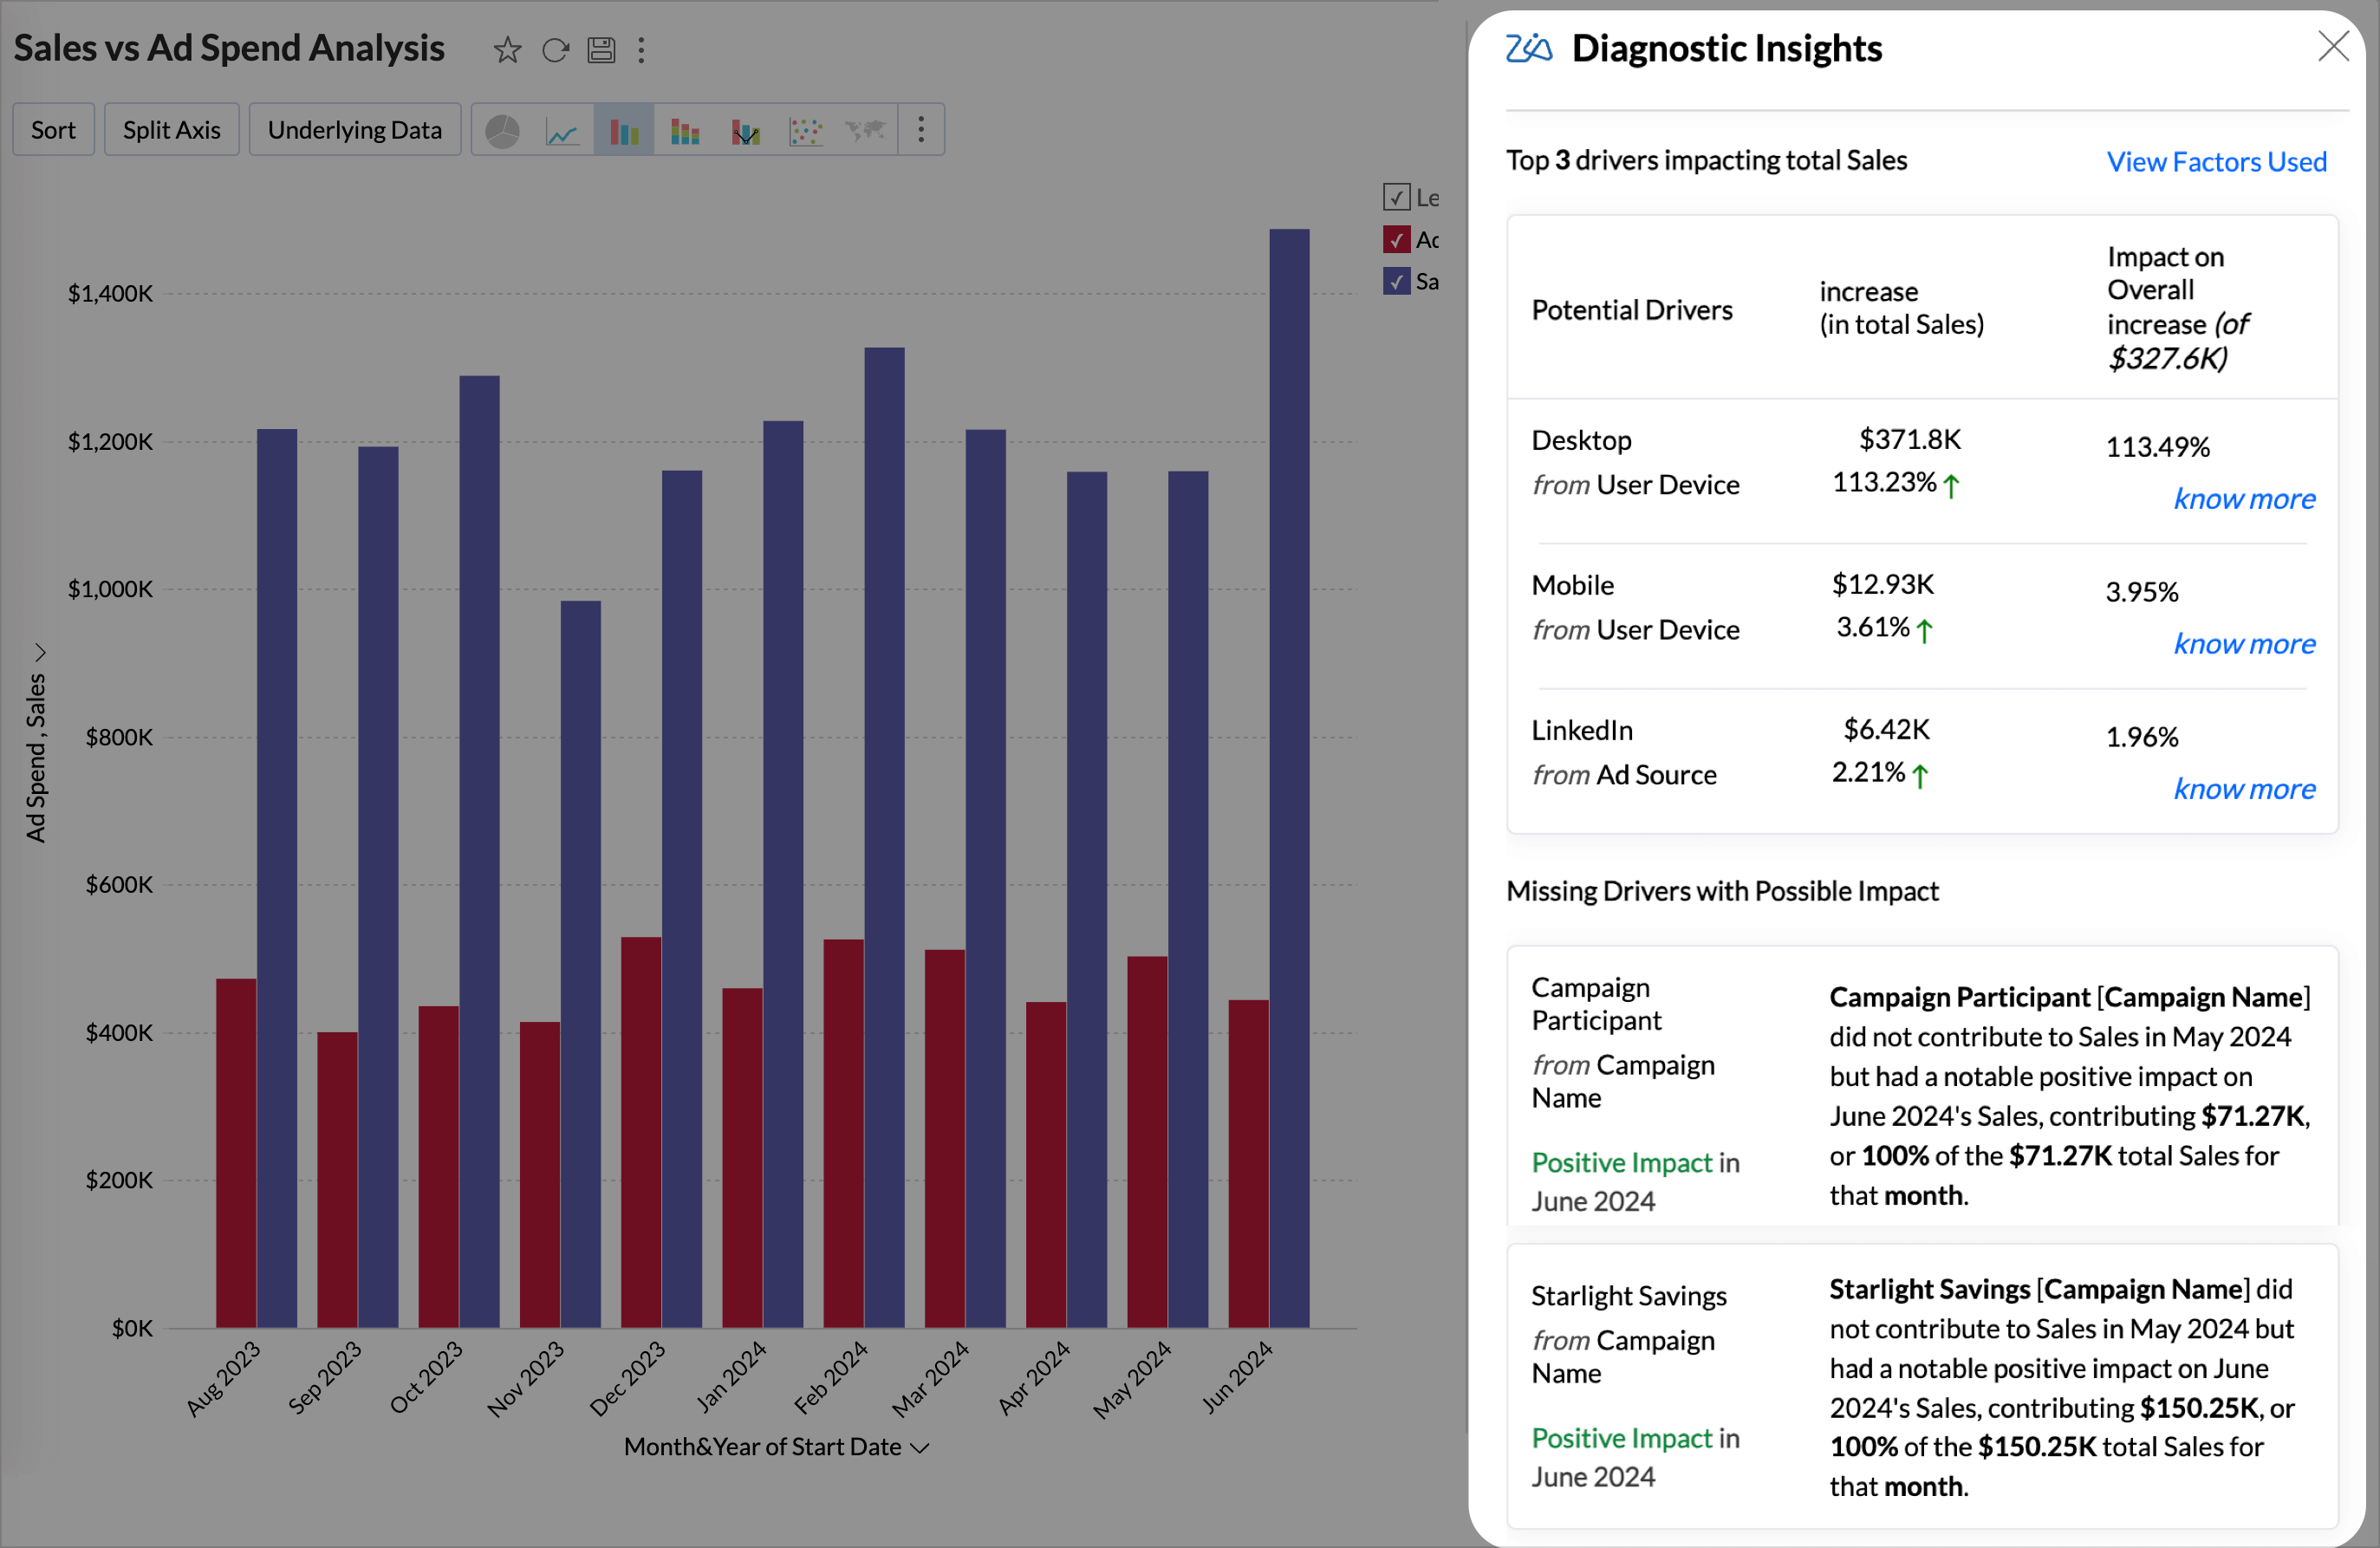
The Diagnostic Insights pane offers a comprehensive details of the Potential Drivers that influence the outcome of the Target Metric and the Possible Reasons that could have contributed to the observed trends in the target metric.
To access the insights, click the Diagnosis icon adjacent to any of the time series insights.
The diagnostic insights provides the following details
- A visual narrative of what has happened to the target metric, whether increased or decreased, percentage of increase or decrease, and the increase or decrease in value.
- The Top Drivers impacting the target metric with the possible reasons that could have contributed to the observed trends of the target metric.
- The Missing drivers that have not contributed in the past but have contributed positively or negatively to the outcome.
Extreme Value Insights
In diagnostic analysis, Extreme Value Insights highlight instances where the key driver values are exceptionally high or low (outliers) and have a significant impact on the target metric.
These insights help you identify threshold points or unusual variations that strongly influence overall performance, either positively or negatively.
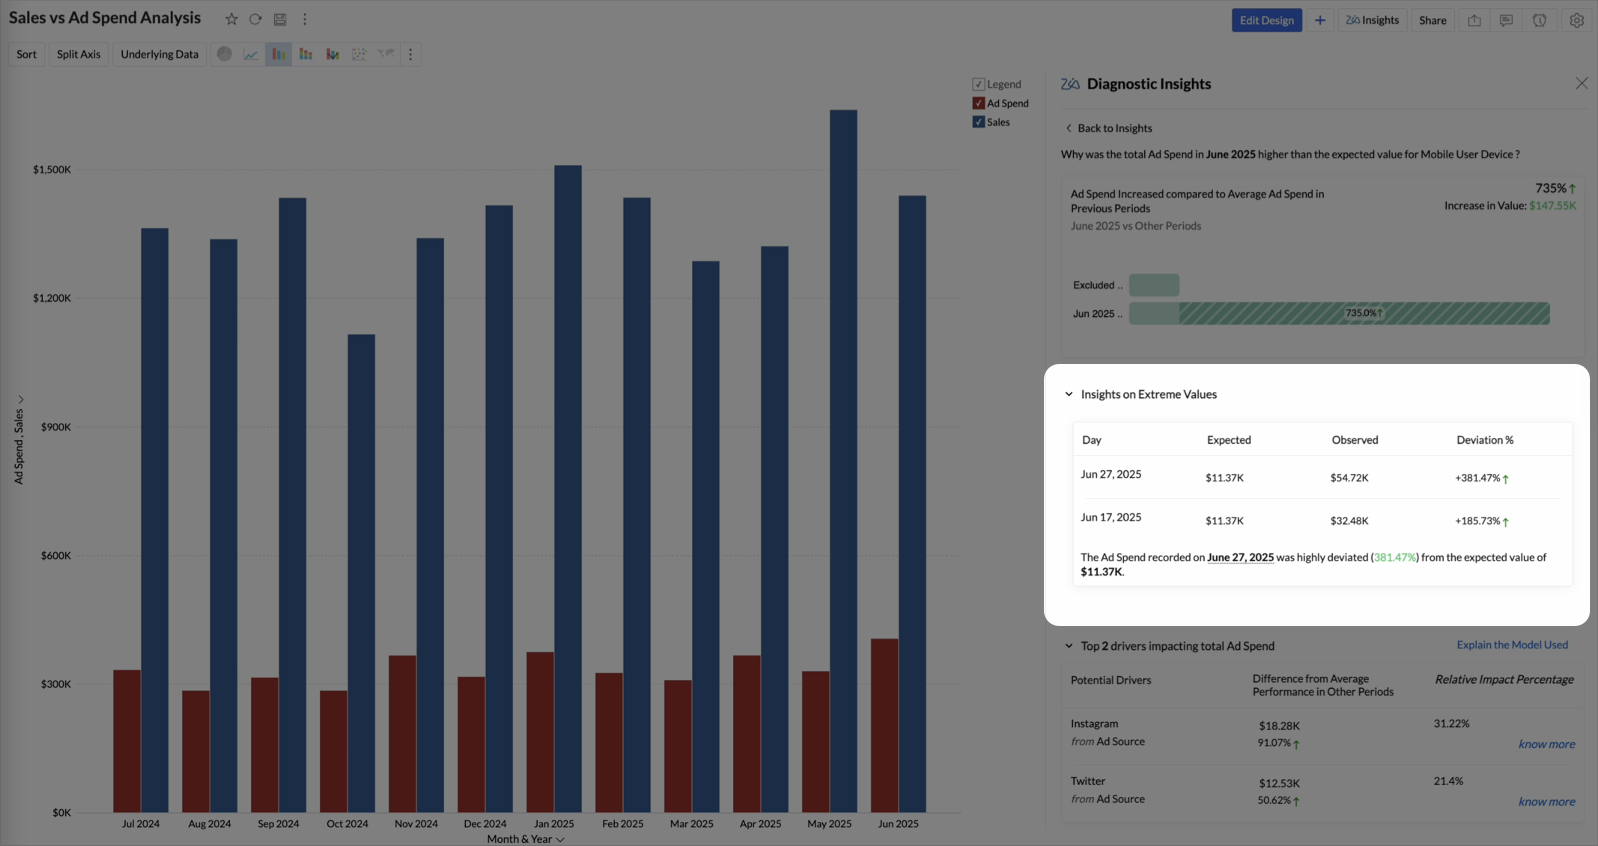
Each record in this section includes the following details:
- Date: The specific date on which the deviation occurred.
- Expected: The predicted or typical value derived from historical data trends.
- Observed: The actual value recorded on that date.
- Deviation (%): The percentage difference between the observed and expected values, indicating the magnitude and direction of the deviation.
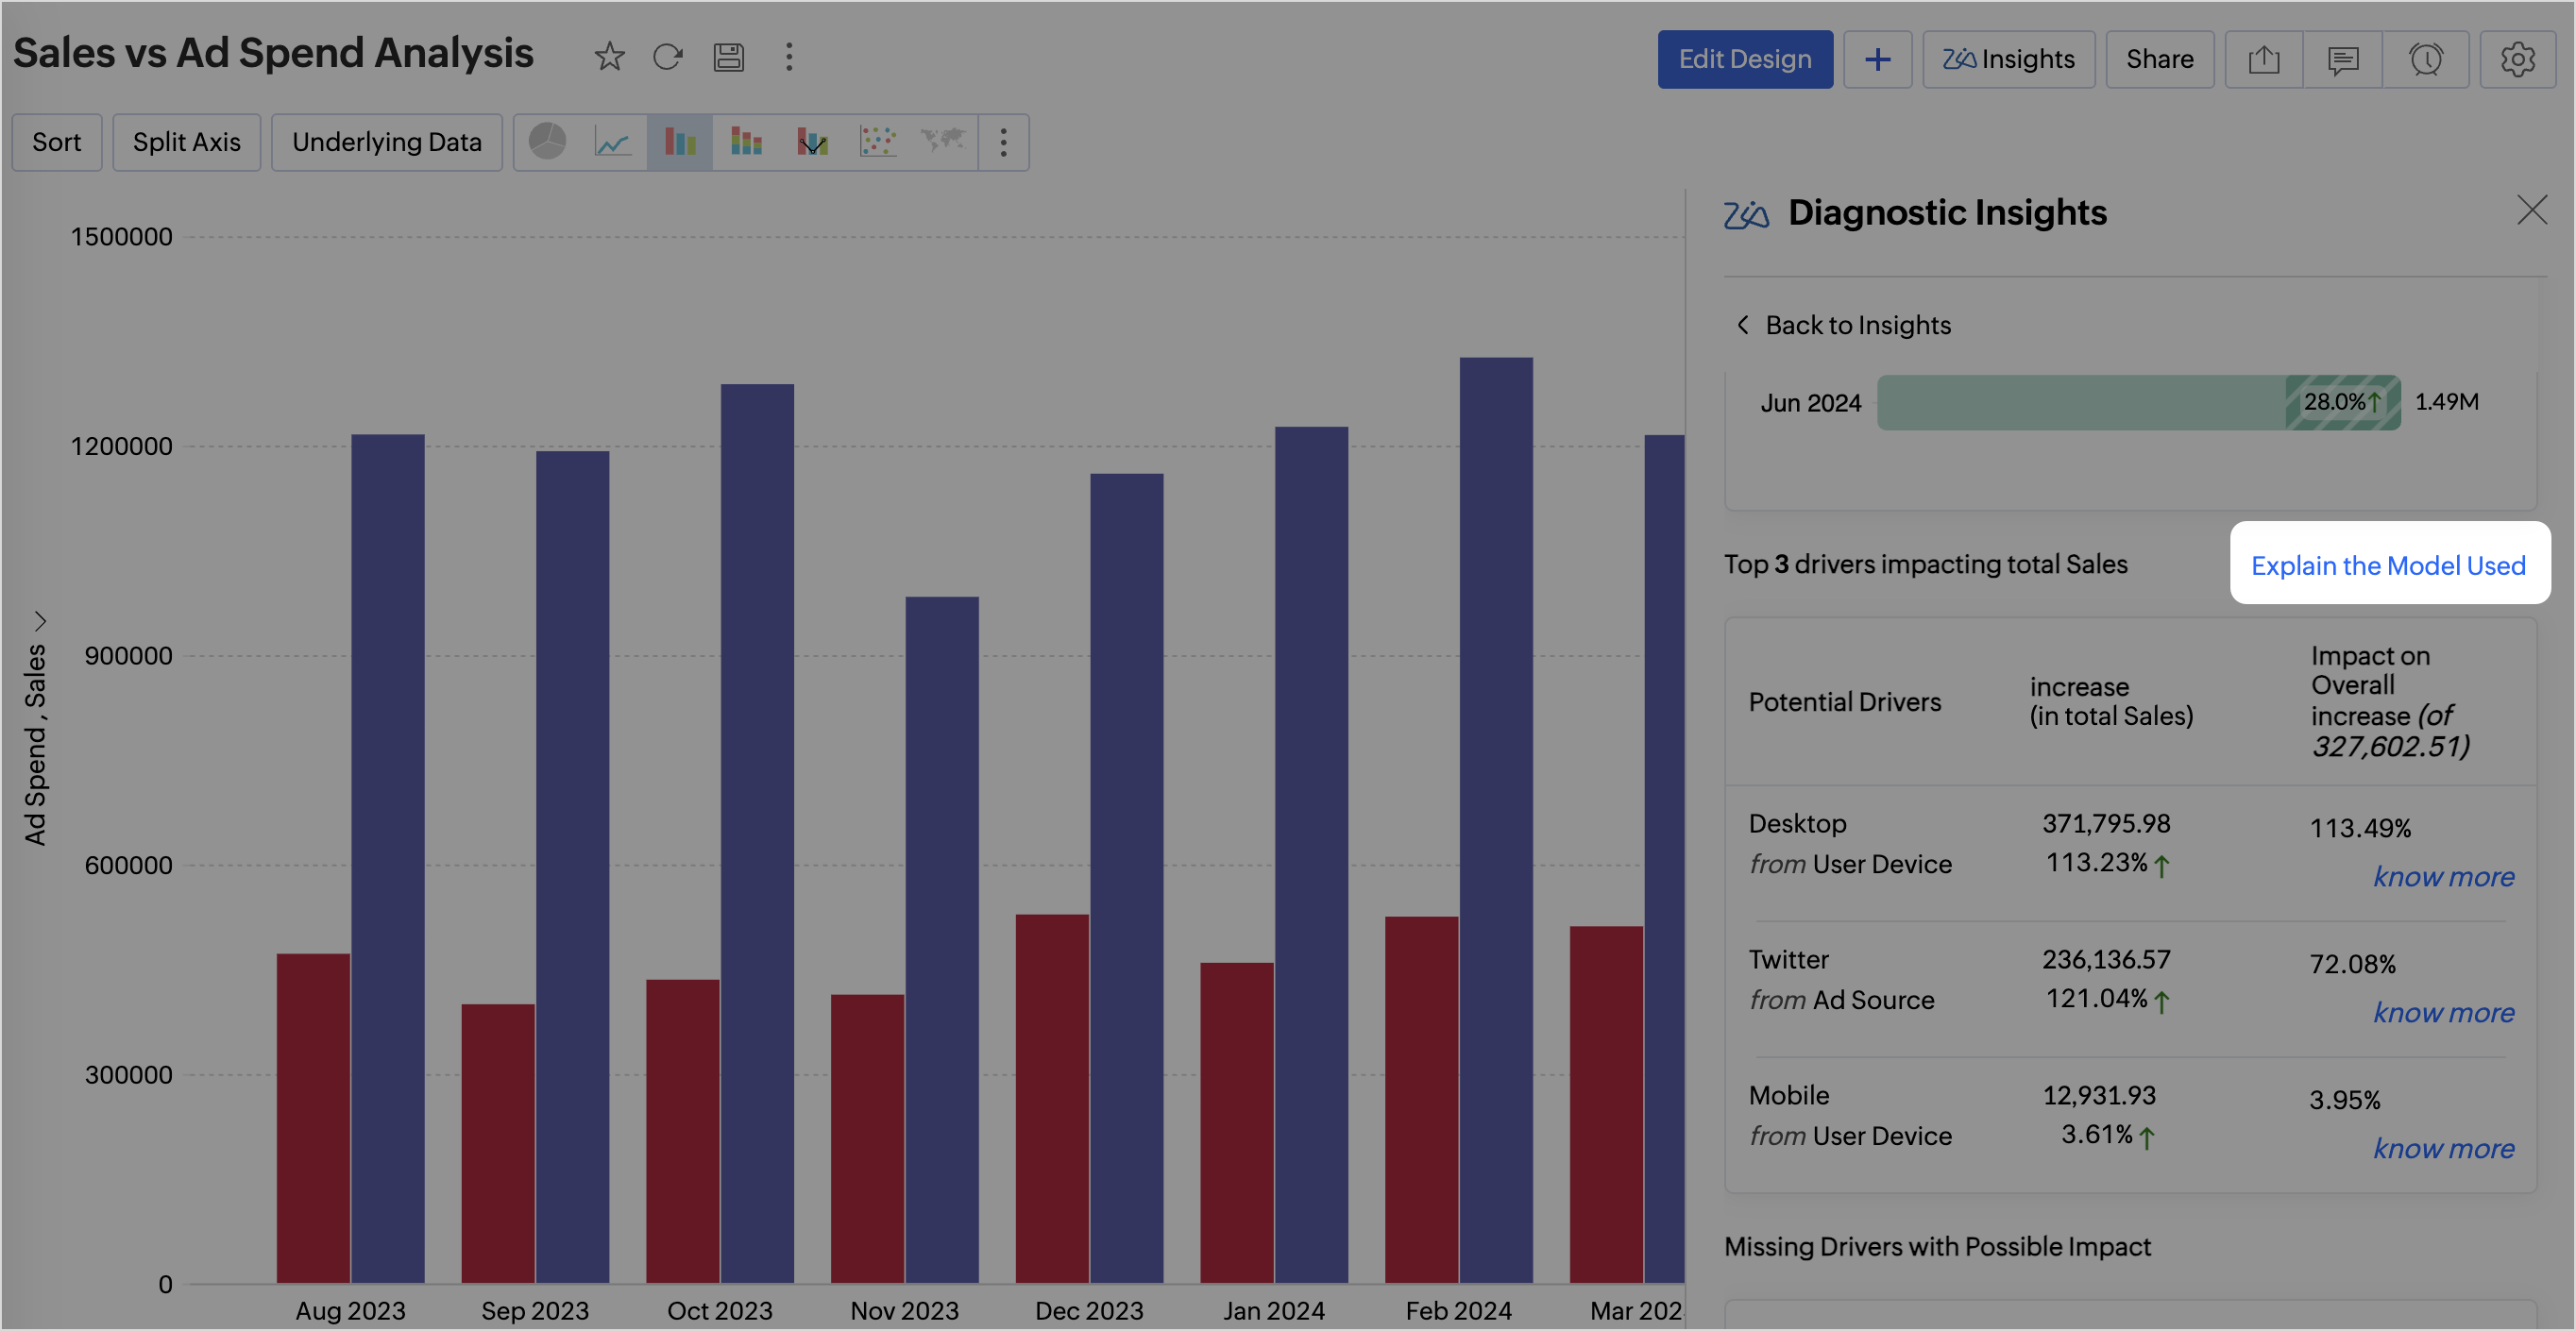
Potential Drivers (Key Drivers)
The Top (potential) drivers section answers the What and provides an overview of the diagnosis in the current state or condition of the target metric.
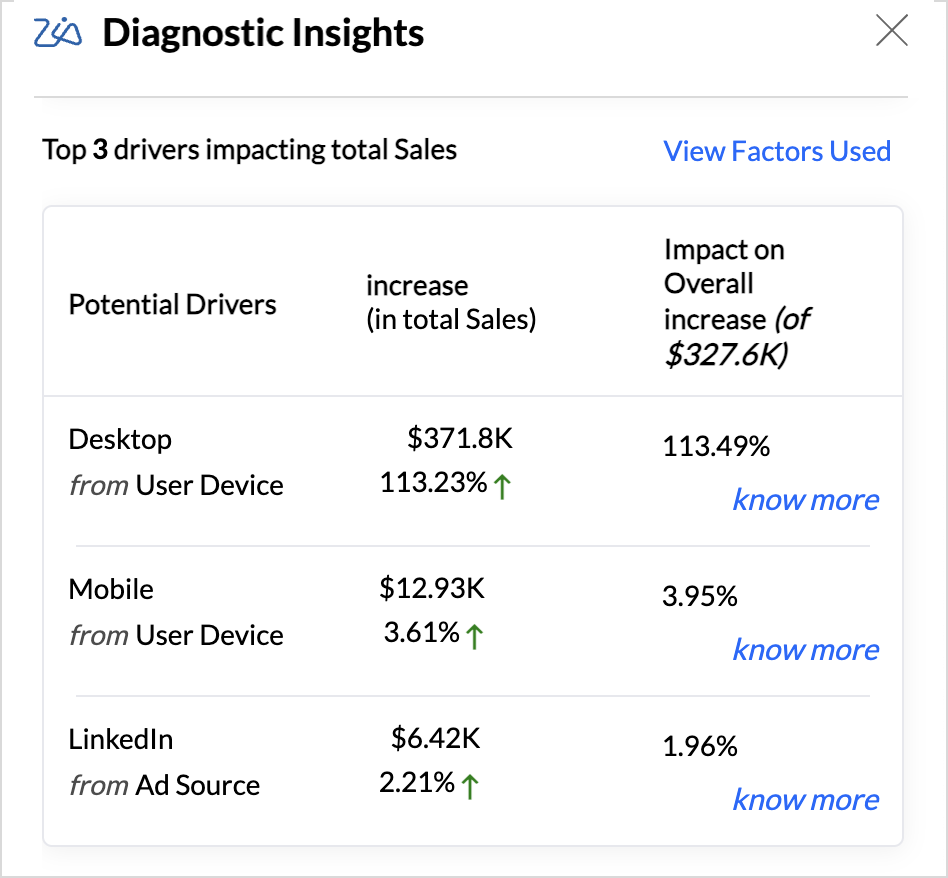
| Trend | The observed trend of the target metric, whether it's increasing or decreasing. |
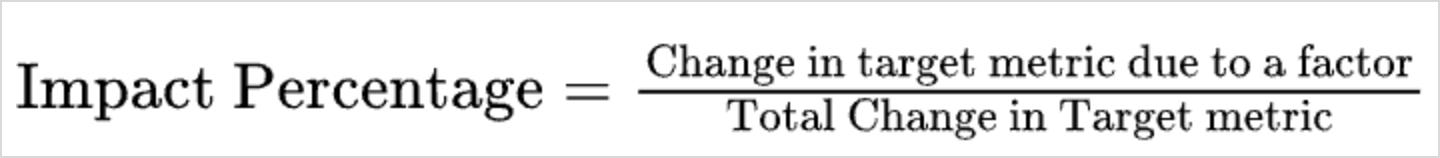
| Impact on Overall trend | A breakdown of the individual contribution of each driver to the target metric, including the percentage of impact on the overall rise or fall. Impact percentage calculates the effect of a specific factor on the target metric by calculating its contribution to the total change in the metric. It indicates how much of the overall variation can be attributed to that factor.
Example: Ad Spend is one of the influencing factors, and Sales is the target metric. Total sales for July 2024= $1000.00 and August 2024 = $1500.00.
|


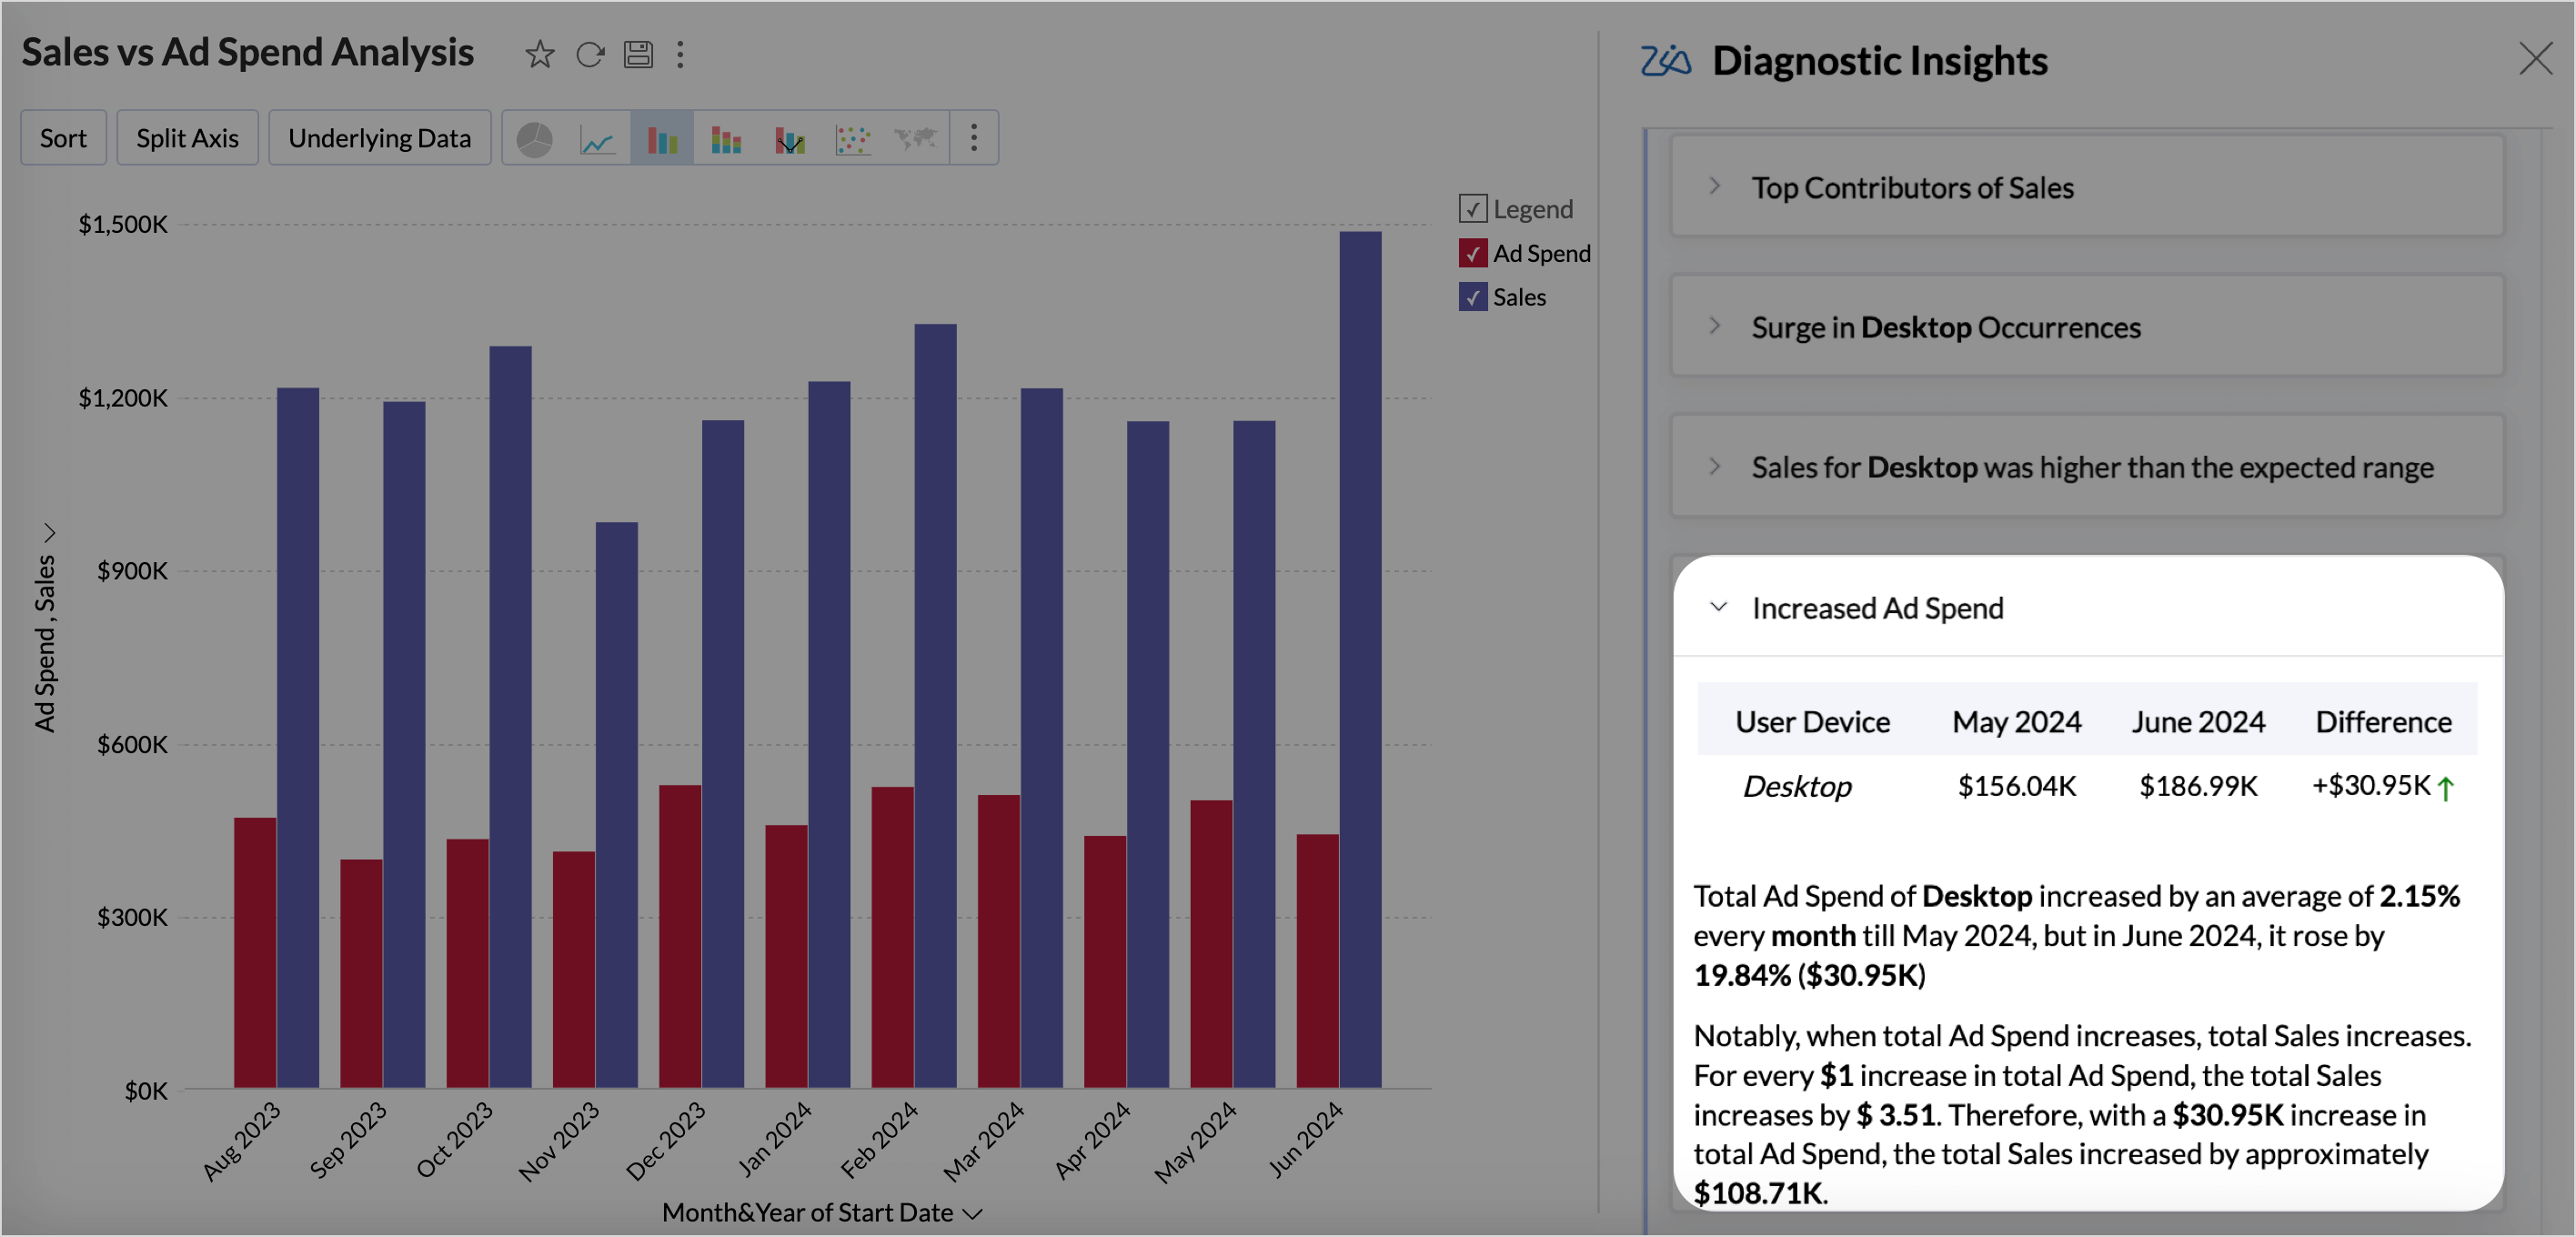
Possible Reasons
The Why section outlines all the potential reasons behind the observed trend, including detailed impact assessments and the various factors contributing to the current outcome. Click Know more to view the Possible Reasons. For a deeper understanding of the types of insights provided in Key Driver Analysis, refer to the Diagnostic Insights - Explanations section.
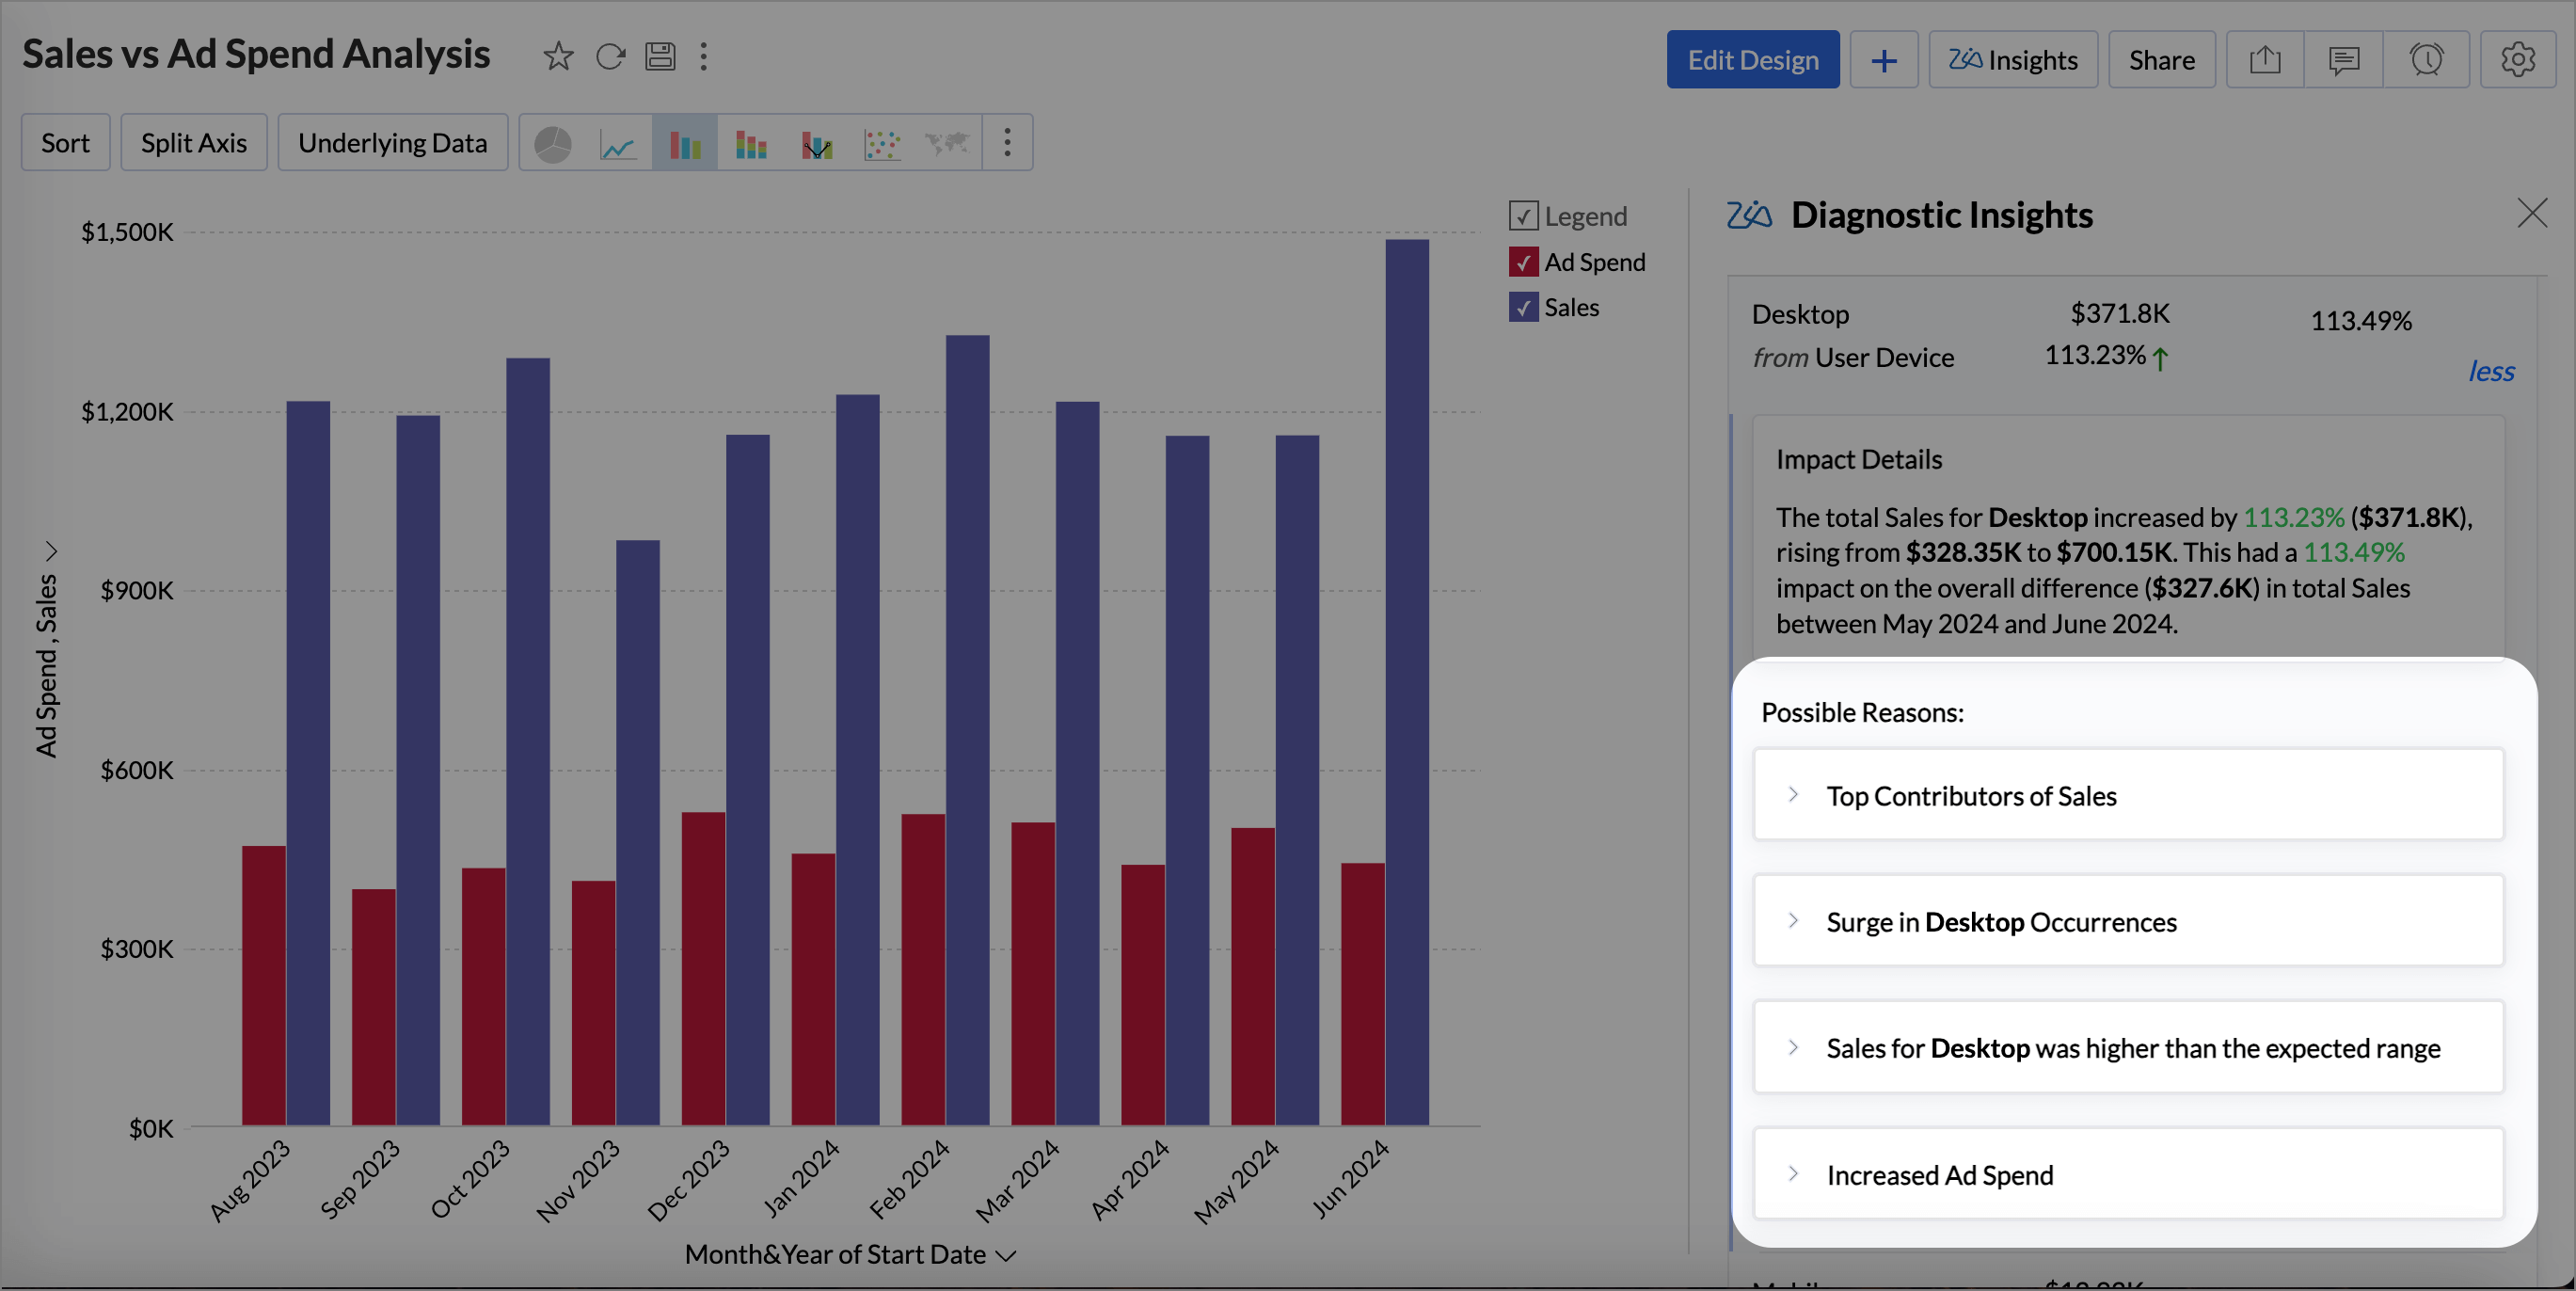
The Possible Reasons section lists the following details.
| Impact Details | Impact denotes the influence or contribution that a particular factor (driver) has on the target metric. It quantifies how much a specific factor affects the outcome being analyzed. |
| Possible Reasons | The possible reasons lists all the reasons that may have contributed to the observed trends in the target metric, such as top contributors or top off setters, number of occurrences, anomalies, and correlation (relationship) between the target metric and the target. |
Missing Drivers
Missing Drivers in Key Driver Analysis are factors that had no measurable impact in the previous period but began contributing positively or negatively in the current period. These drivers highlight the emerging influences that have shifted from being negligible to having a meaningful effect on the target metric.
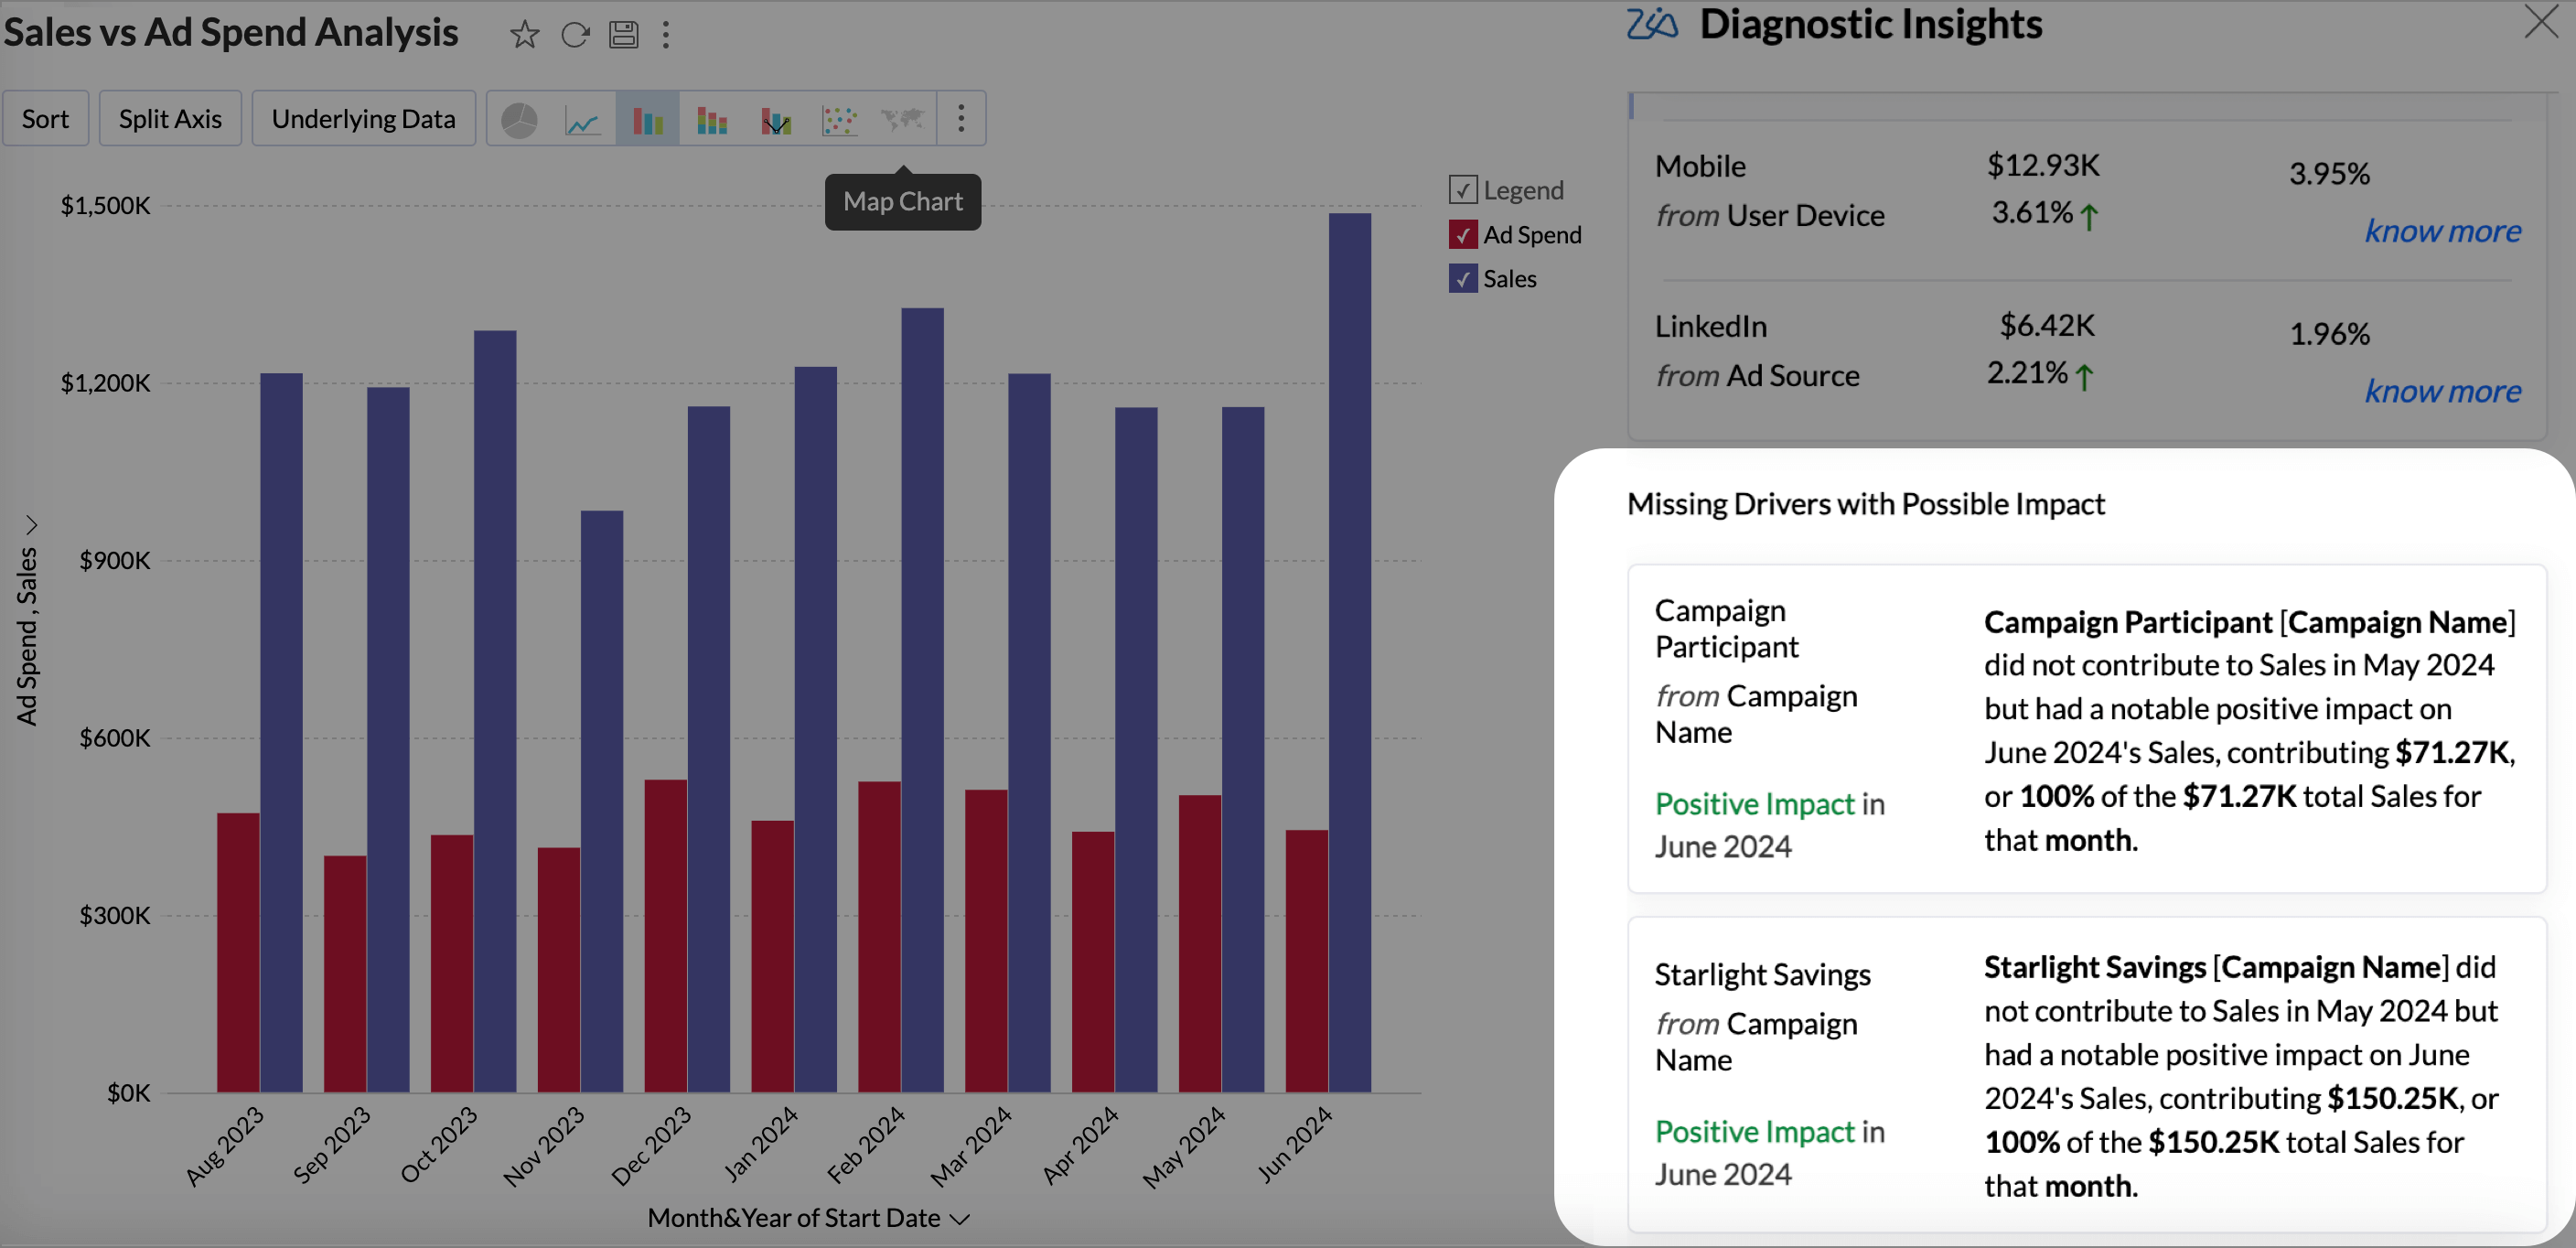
Zia Insights takes into consideration the drivers or factors that could affect the target metric and gives the type of impact it exerts on the target metric.
- Positive Impact: A factor is said to have a positive impact if it had no contribution in the previous period but has positively contributed in the current period, driving overall growth.
- Negative Impact: A factor is said to have a negative impact if it had no impact in the previous period but is now causing a decline in the outcome of the target metric.
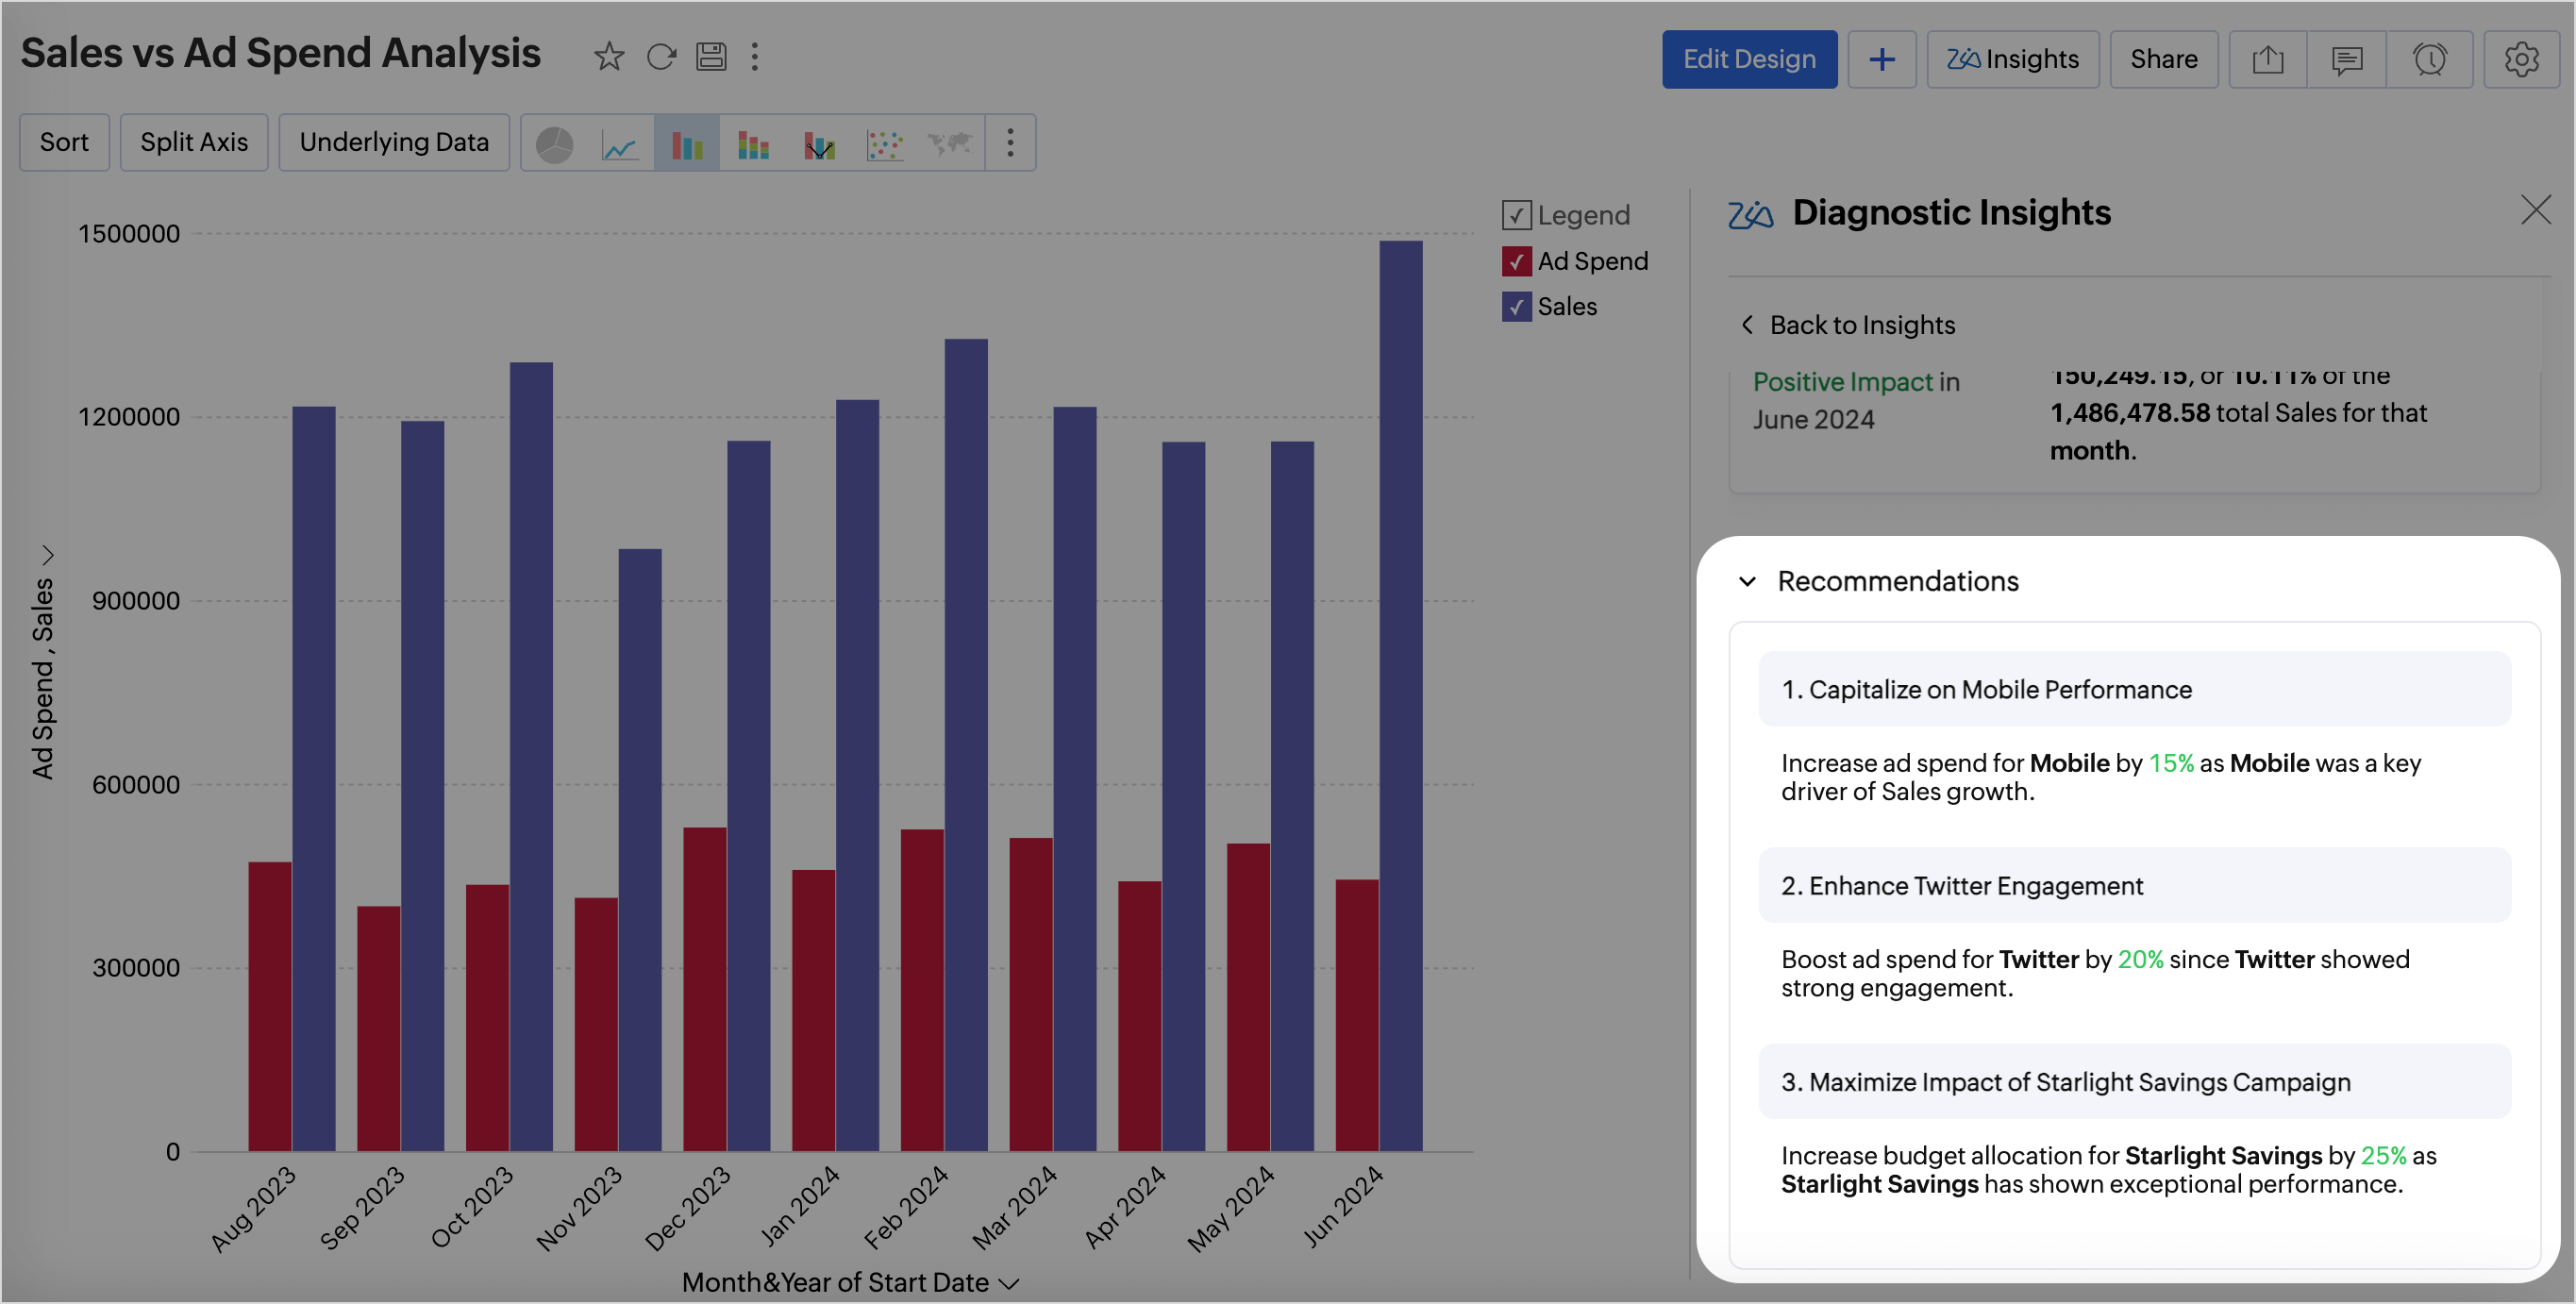
Prescriptive Insights - Recommendations
Prescriptive insights go beyond descriptive and predictive insights by recommending specific actions to achieve desired outcomes. Zia Insights provides the best course of action as recommendations to improve performance or solve a problem. These recommendations are generated using OpenAI. The metadata of the involved columns is shared with OpenAI for this purpose.
Diagnostic Insights - Explanations (Types)
Key Drivers - Top Contributors or Offsetters
Key Drivers are the top factors that either positively or negatively influence the outcome of the target metric, leading to its increase or decrease in value. This helps understand the causes of what is driving the outcome.
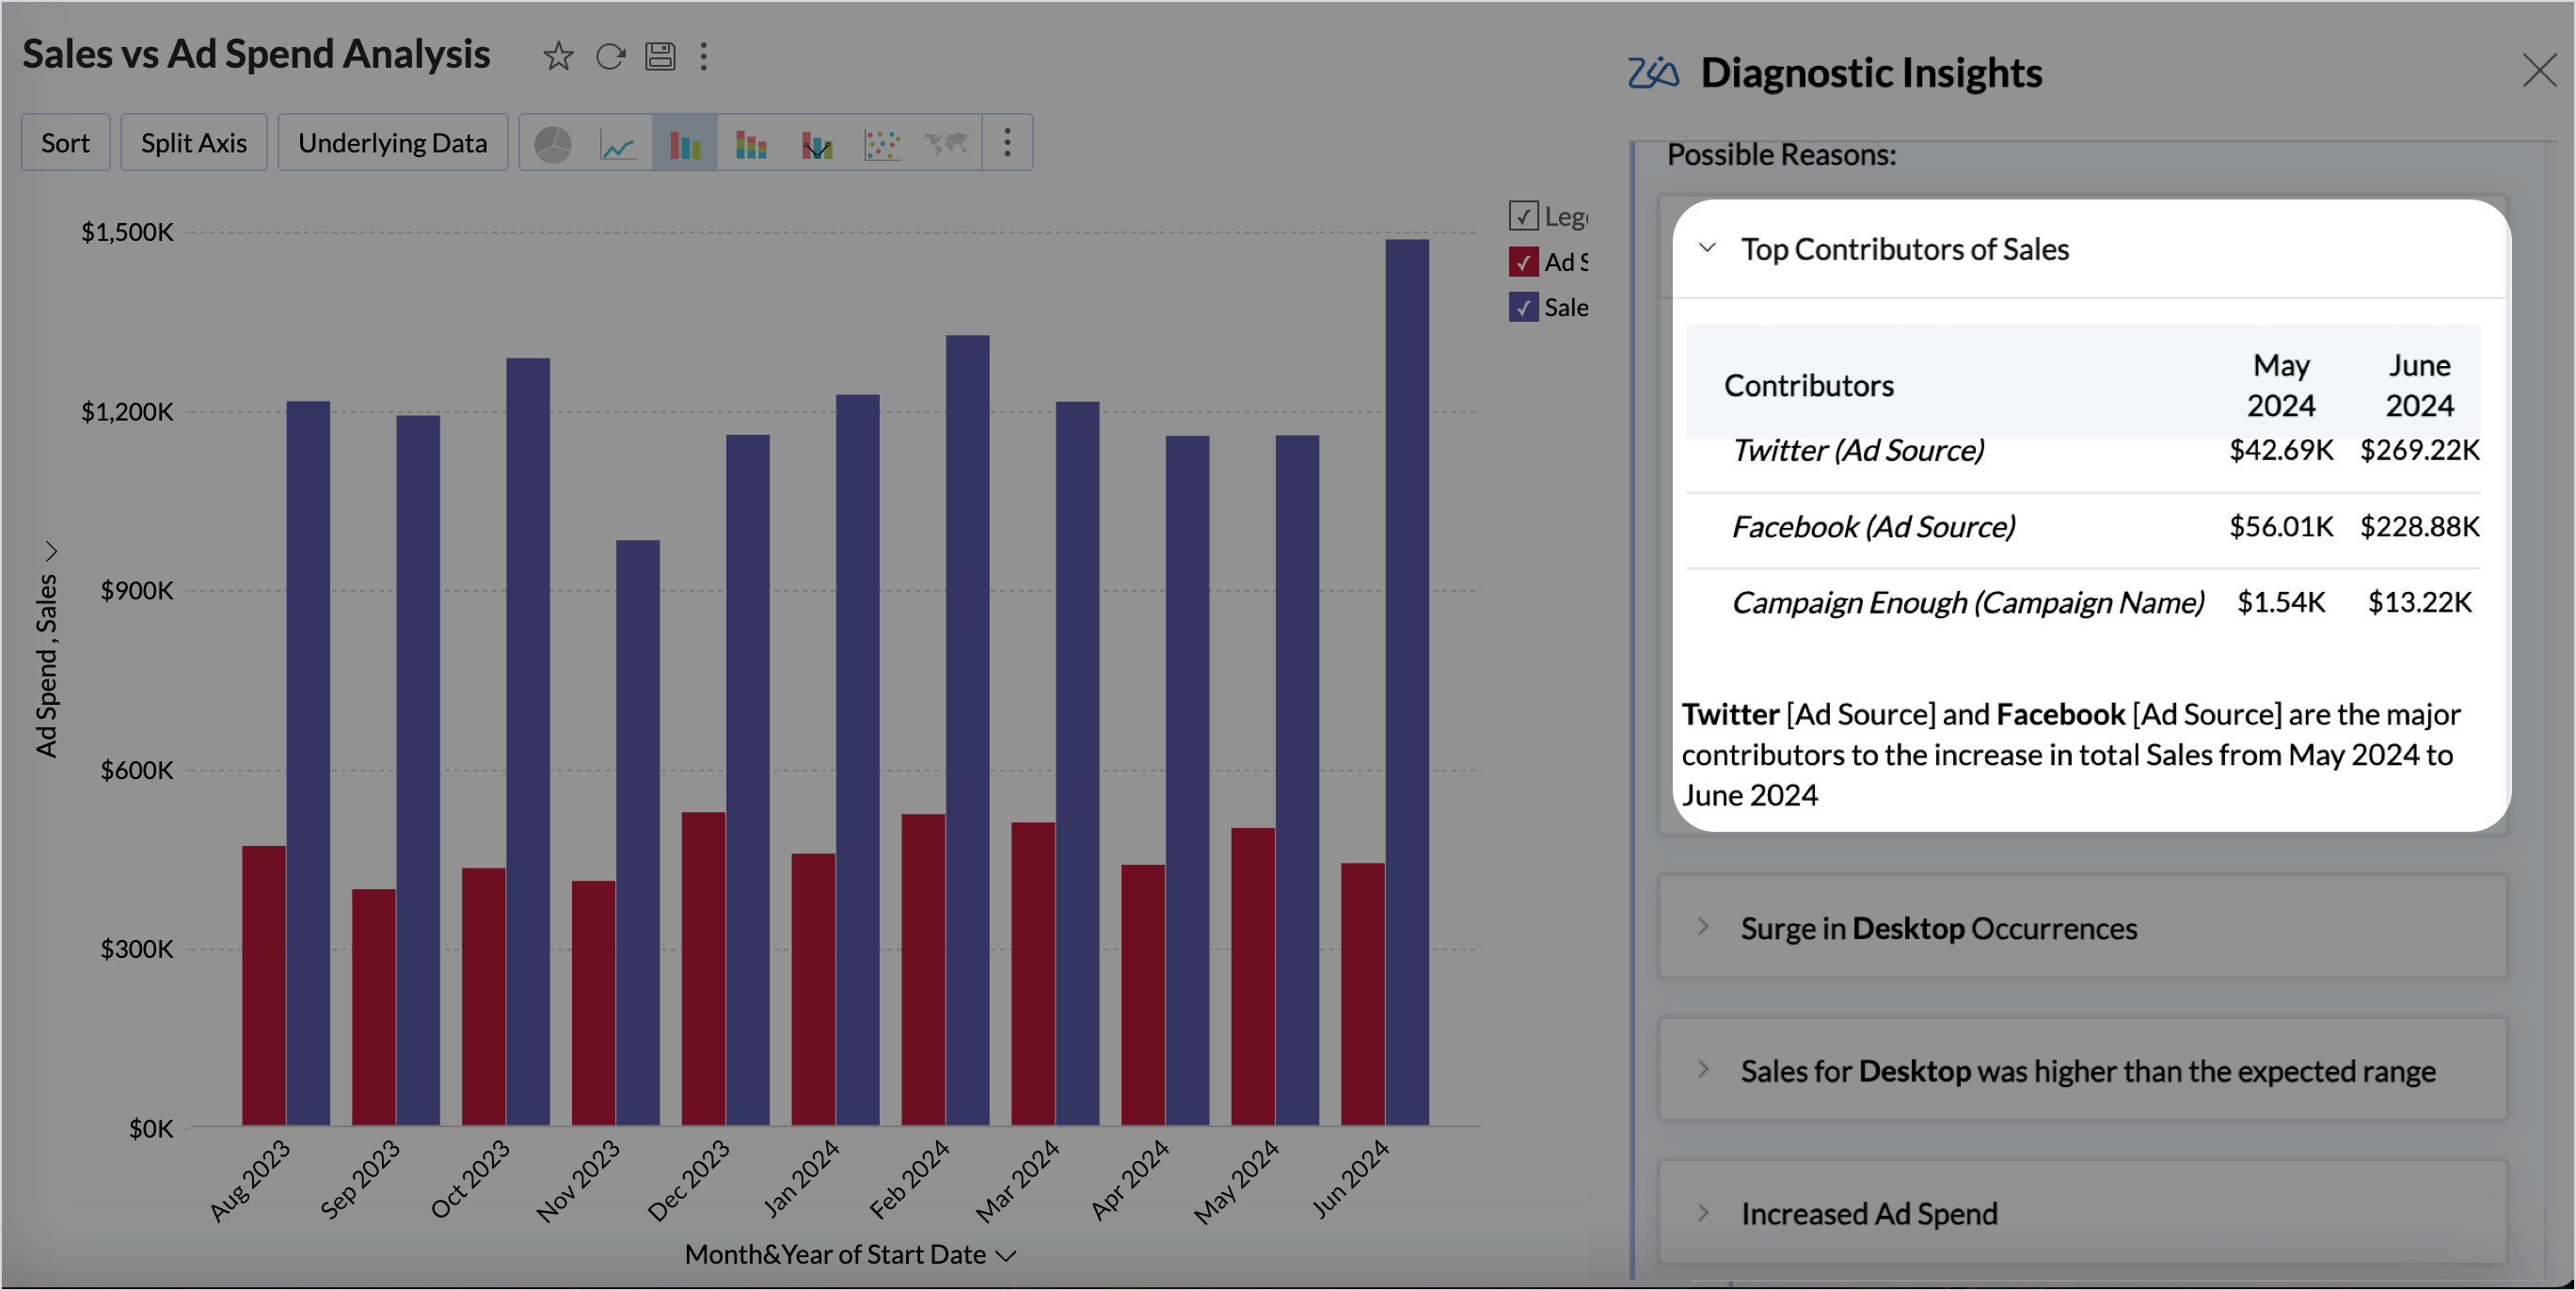
Based on the influence of the factors on the target metric, Top contributors or top off-setters insights are displayed.
- Top contributors are the factors that positively influence the target metric leading to the increase in value. For instance, a 20% increase in marketing spend may result in a 15% increase in sales, showing that marketing efforts are positively influencing sales growth.
- Top off setters are factors that negatively impact the target metric, causing a decrease in its value. For example, a 10% increase in product returns could lead to a 5% decrease in total sales, illustrating that returns are hindering overall sales performance.
Anomalies
Anomaly Insights detect unusual spikes or drops in the target metric that deviate from expected trends.It offers a clear comparison between the expected and observed values of the target metric, emphasizing the deviation percentage to highlight the extent of the difference.
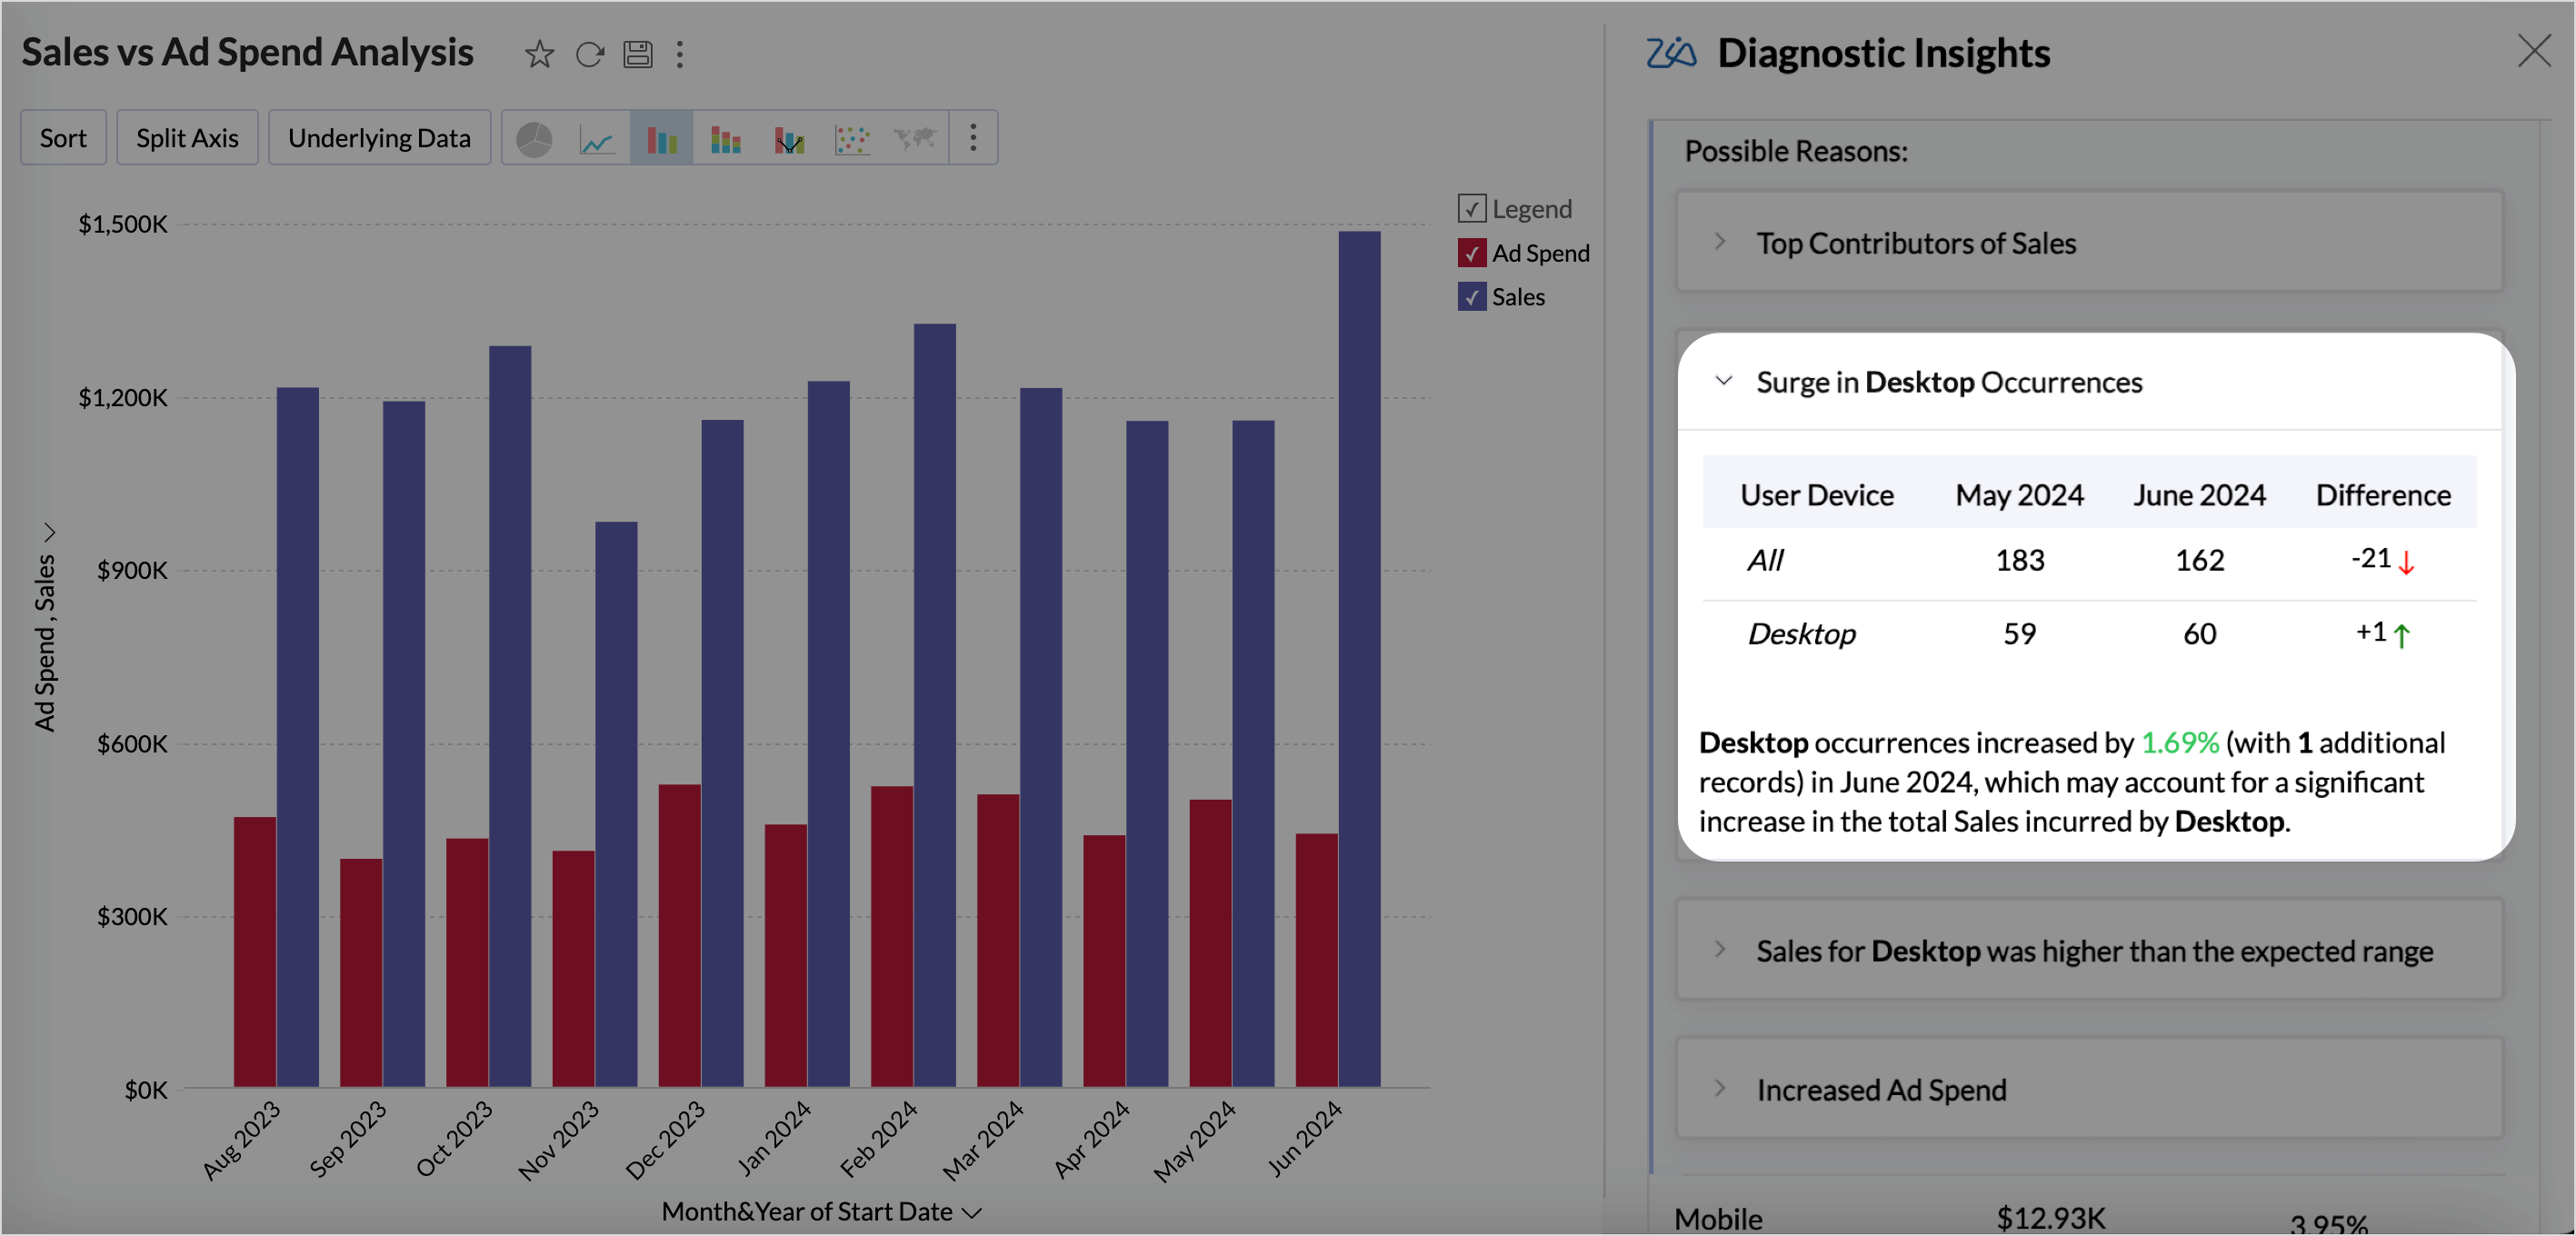
Occurrences
Occurrence analysis measures how often specific drivers appear in relation to high or low outcomes in the target metric. It also helps determine how a driver correlates with changes in the target metric. This helps in understanding the significance and impact of each driver over time or across different segments.
Trends and Patterns
The analysis of trends and relationships between the target metric and influencing measures indicates whether there is an increasing or decreasing trend. It also determines the type of correlation, whether direct or indirect, and provides prescriptive recommendations to sustain or improve the observed trend.
Evaluating the Key Driver Analysis
This section details the model used for identifying the key drivers and to evaluate the quality of the analysis. Click Explain the models used to view the details.
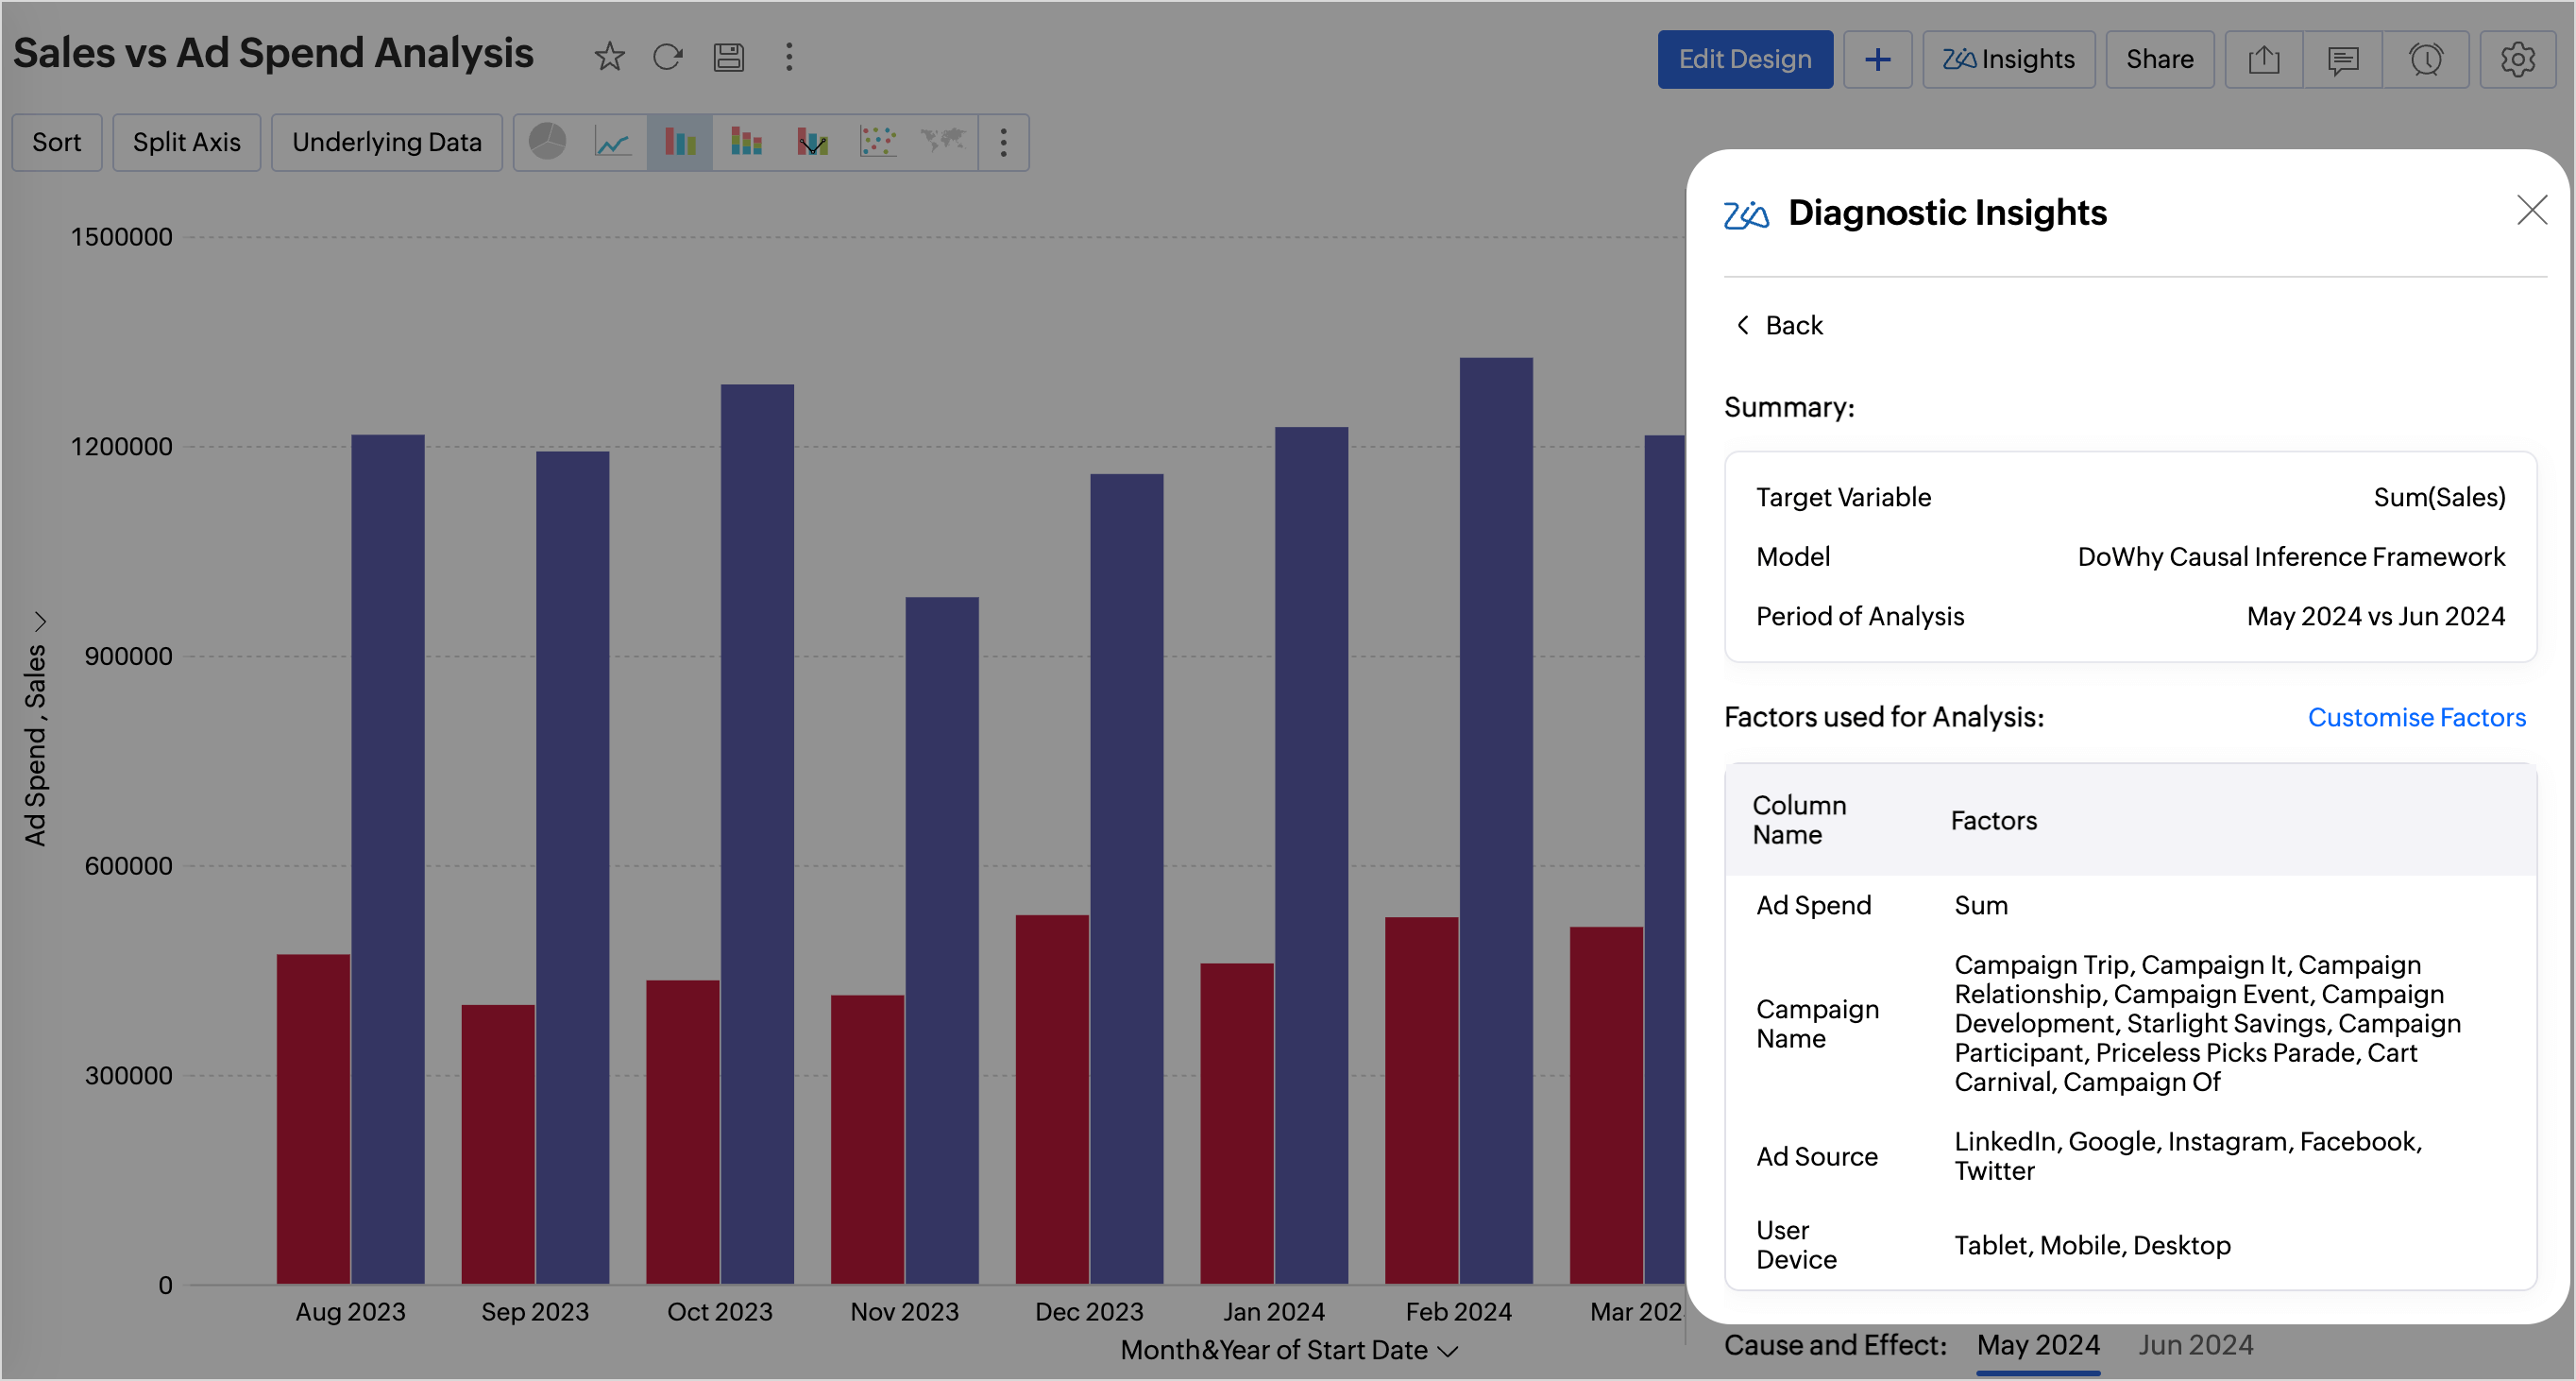
Summary
The Summary section gives an overview about the Target Variable, Model used for analysis, and the period of analysis.
Factors Used for Analysis
This section lists all the factors used for conducting the key driver analysis.
Cause and Effect
The Cause and Effect value in key driver analysis gives the strength of the relationship between the potential drivers and the target variable, indicating how much influence the factors have on the target metric. Zoho Analytics uses the Backdoor Criterion for causal path identification and Linear regression for causal effect estimation.
Evaluation Metrics
Evaluation metrics help assess the performance and the accuracy of the causal inference models.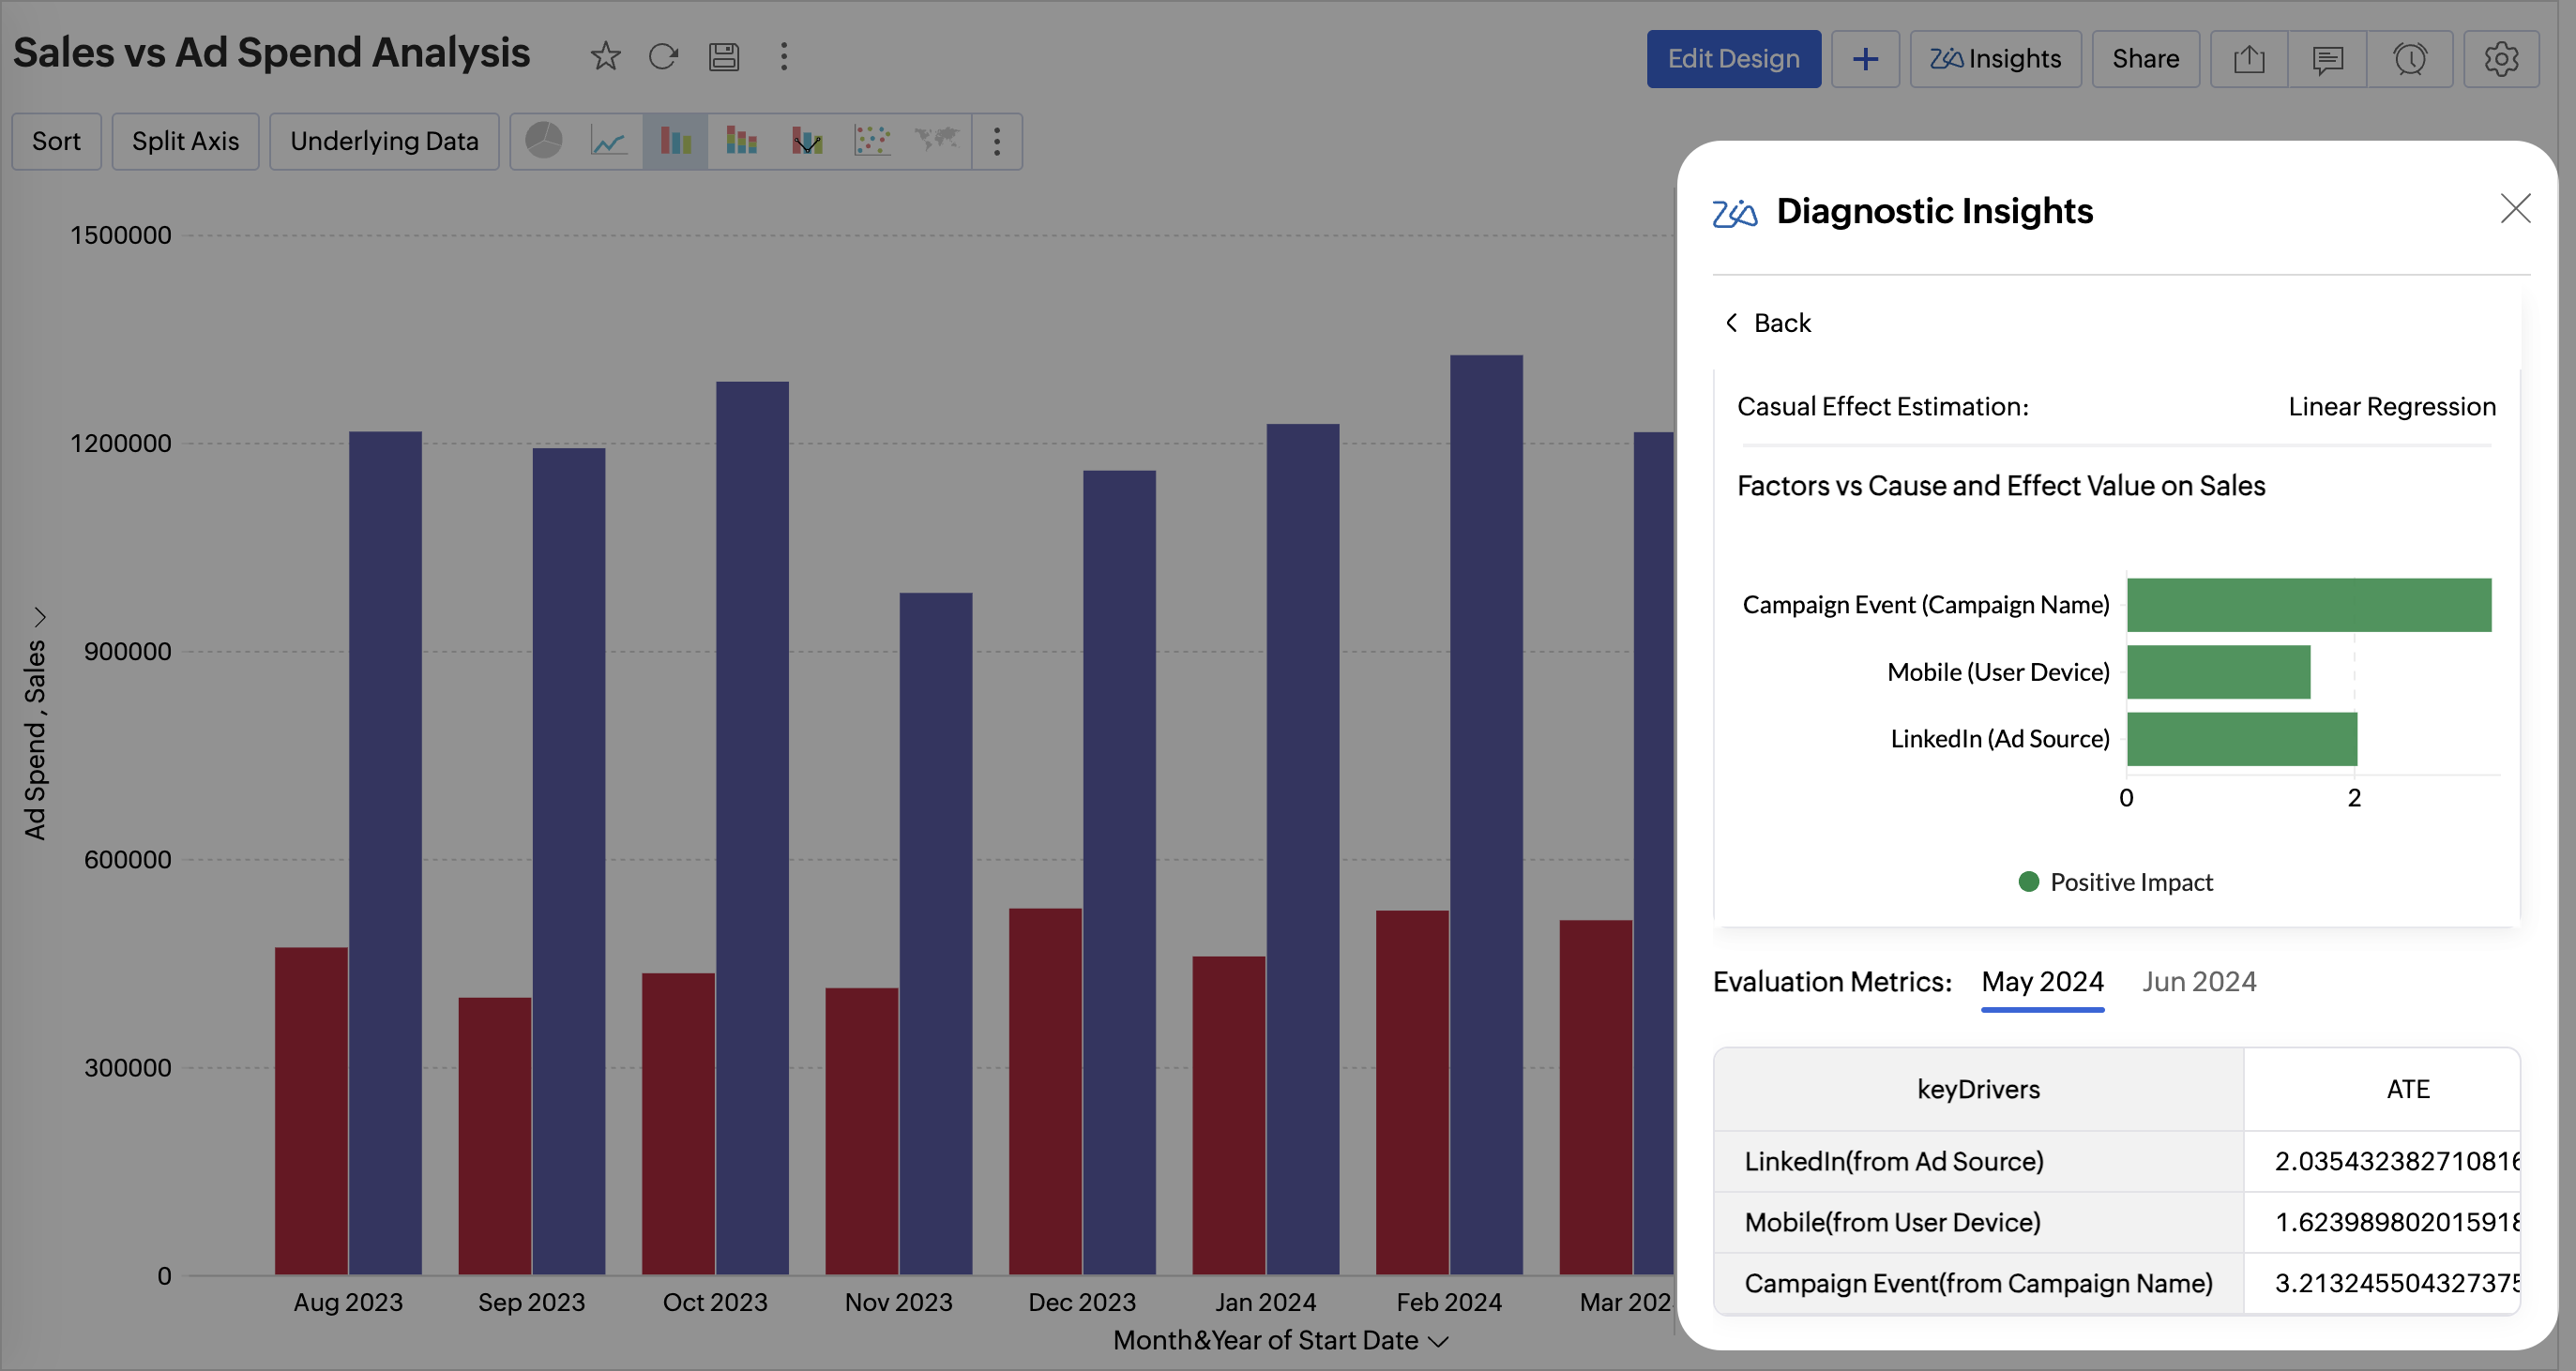
| Metric | Explanation |
| Average Treatment Effect( ATE) | ATE is a statistical measure that calculates the impact of key drivers on an outcome It quantifies how much the outcome would change, on average, if a specific driver were altered. |
| Edge Weight | Edge Weight measures the correlation, the strength, and direction between the target metric and key drivers. |
| P-value | P-value is a statistical value used to validate a hypothesis against observed data. It measures the probability of obtaining the observed results, assuming that the null hypothesis is true. The lower the p-value, the greater the statistical significance of the observed difference. |
| Confidence Interval | A confidence interval, in statistics, refers to the probability that a population parameter will fall between a set of values for a certain proportion of times A 95% confidence interval means that if we repeat the experiment many times, 95% of the time, the true value will fall within this range. |
| R-squared | R-squared is a statistical measure that indicates how much of the variation of a dependent variable is explained by an independent variable in a regression model. |
| Adjusted R- Squared | Adjusted R-squared measures how well a regression model explains the variability in the data, adjusting for the number of predictors. It prevents overestimation of model performance by penalizing unnecessary variables. |
| F-Statistic | The F-statistic tests whether the overall model is statistically significant. A higher F-statistic indicates that the model performs significantly better than a model that predicts the mean outcome. |
| Bayesian Information Criterion (BIC) | Bayesian Information Criterion (BIC) is a statistical metric used to evaluate the goodness of fit of a model while penalizing for model complexity to avoid overfitting. |
| Akaike Information Criterion | The Akaike Information Criterion (AIC) is a metric used to compare different statistical models and determine which one best balances goodness of fit and complexity. |
Explain Data - Zia Insights
The Explain Data - Zia Insights feature provides information related to the selected data point in the report. This helps in identifying significant changes or anomalies in the data.
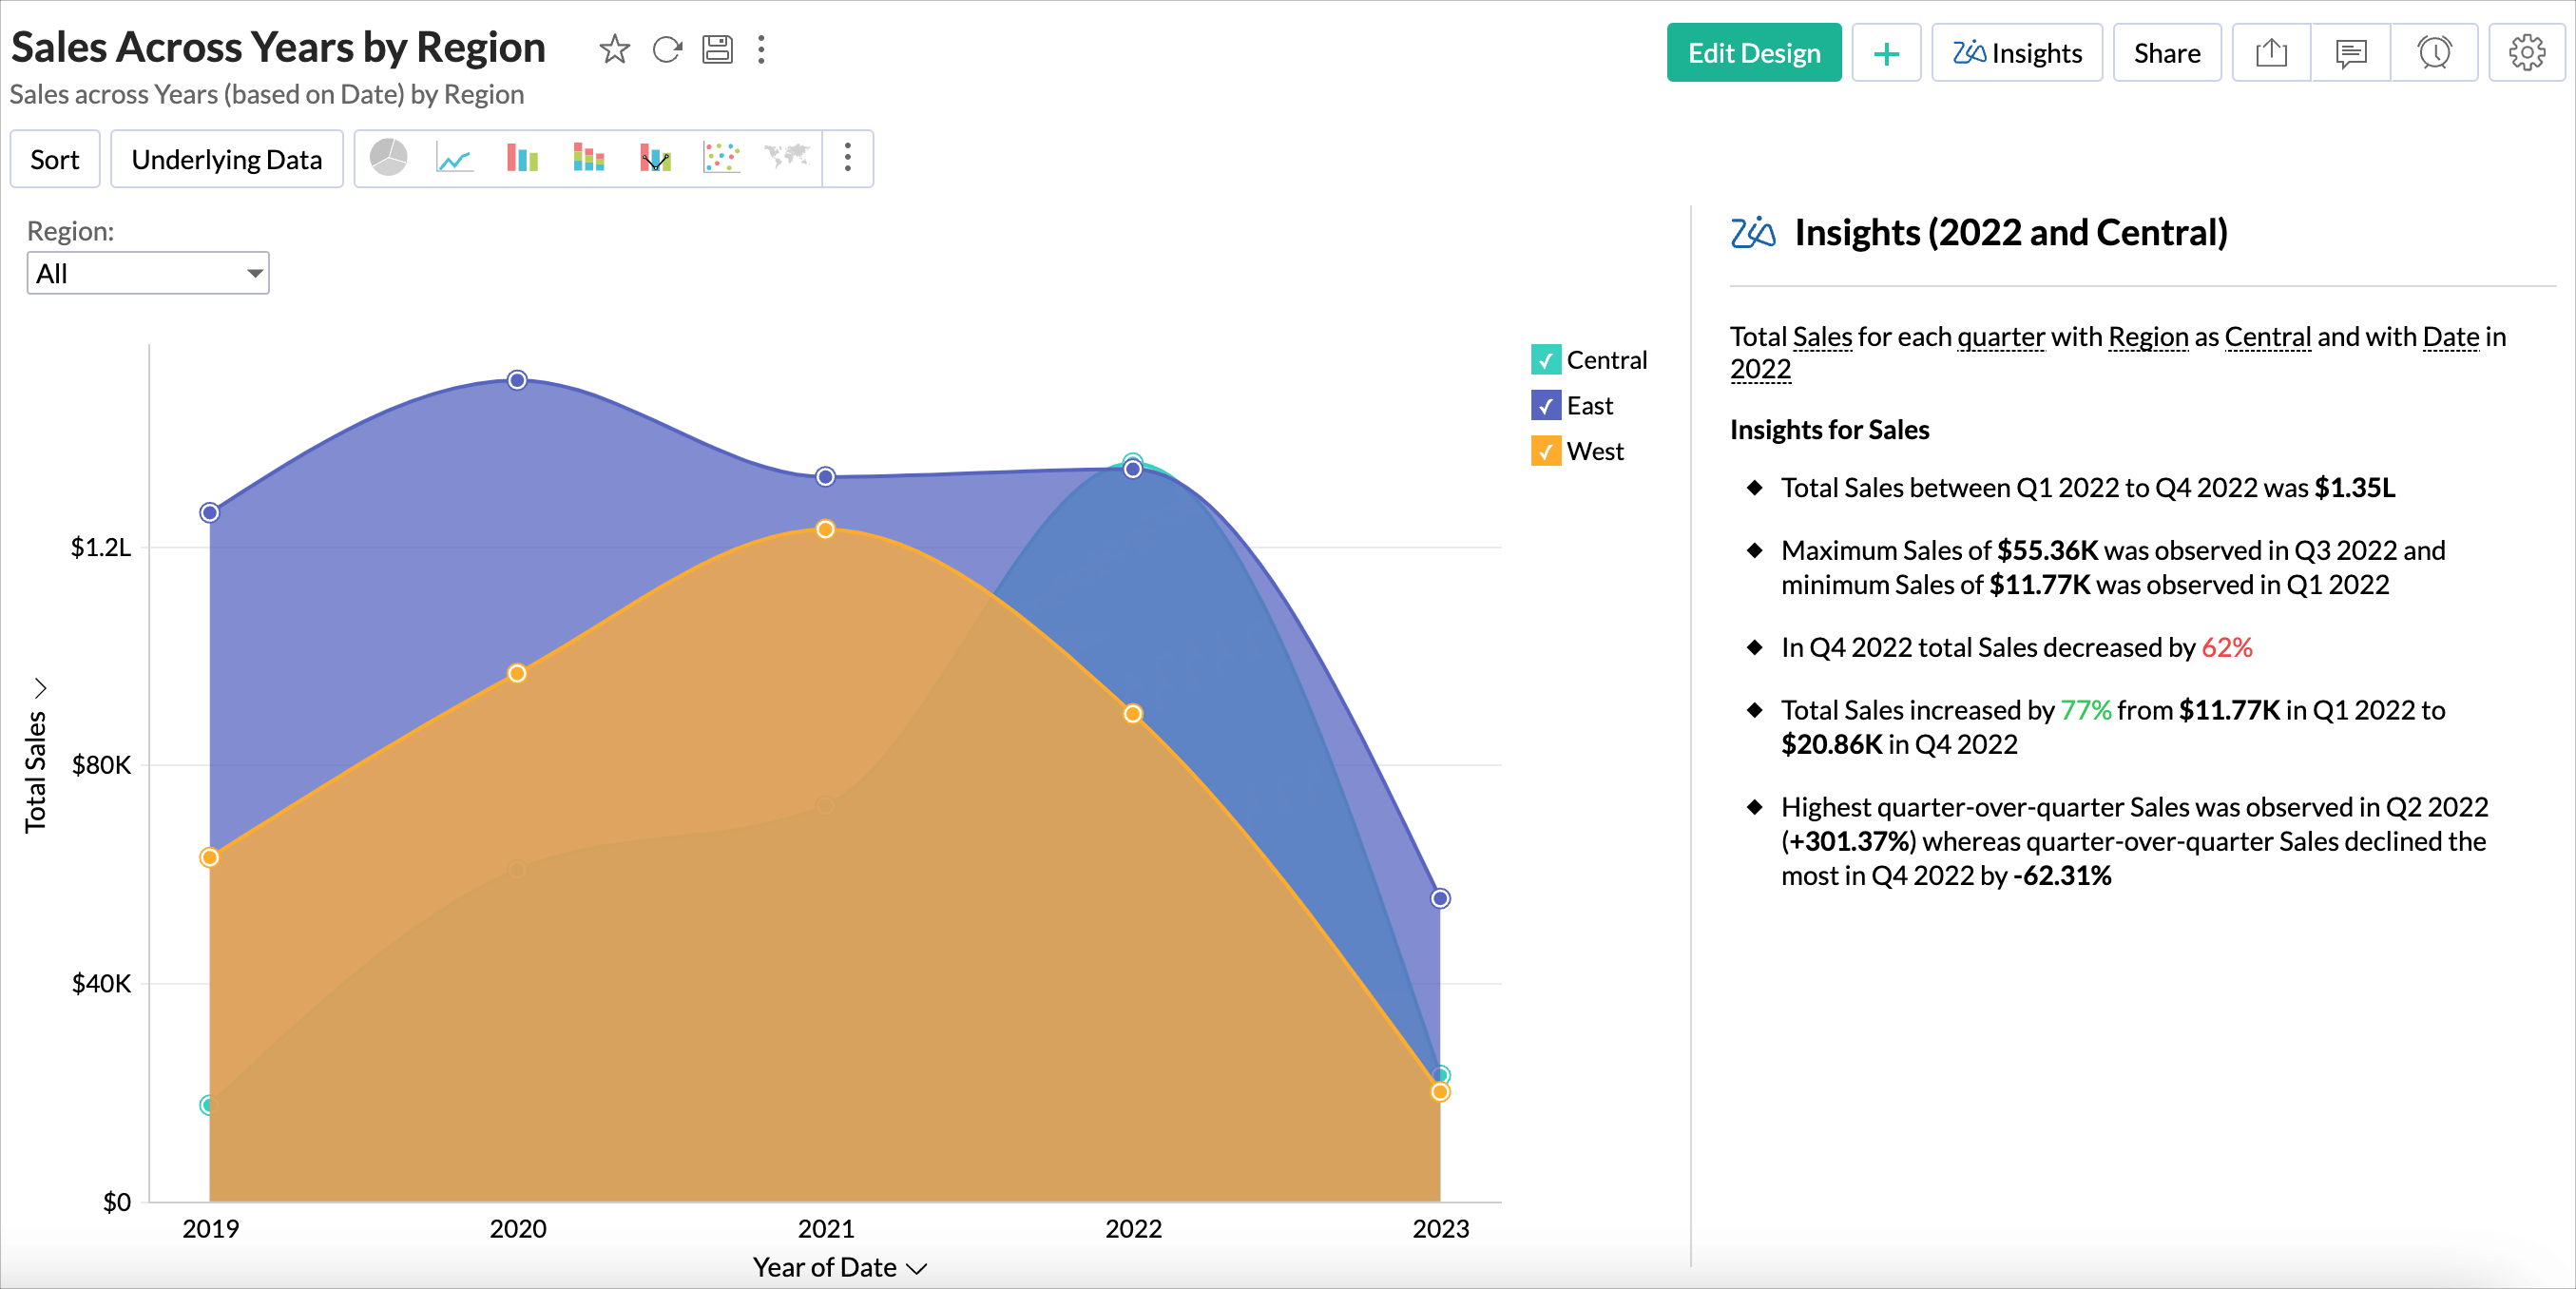
For example, for a chart that displays the sales across the years by region, enabling Explain Data - Zia Insights for the year 2022 will display insights on sales based on the quarterly breakdown of sales for that year.
Invoking Explain Data - Zia Insights
- Open the report in view mode.
- Click any data point in the report and select Explain Data - Zia Insights.
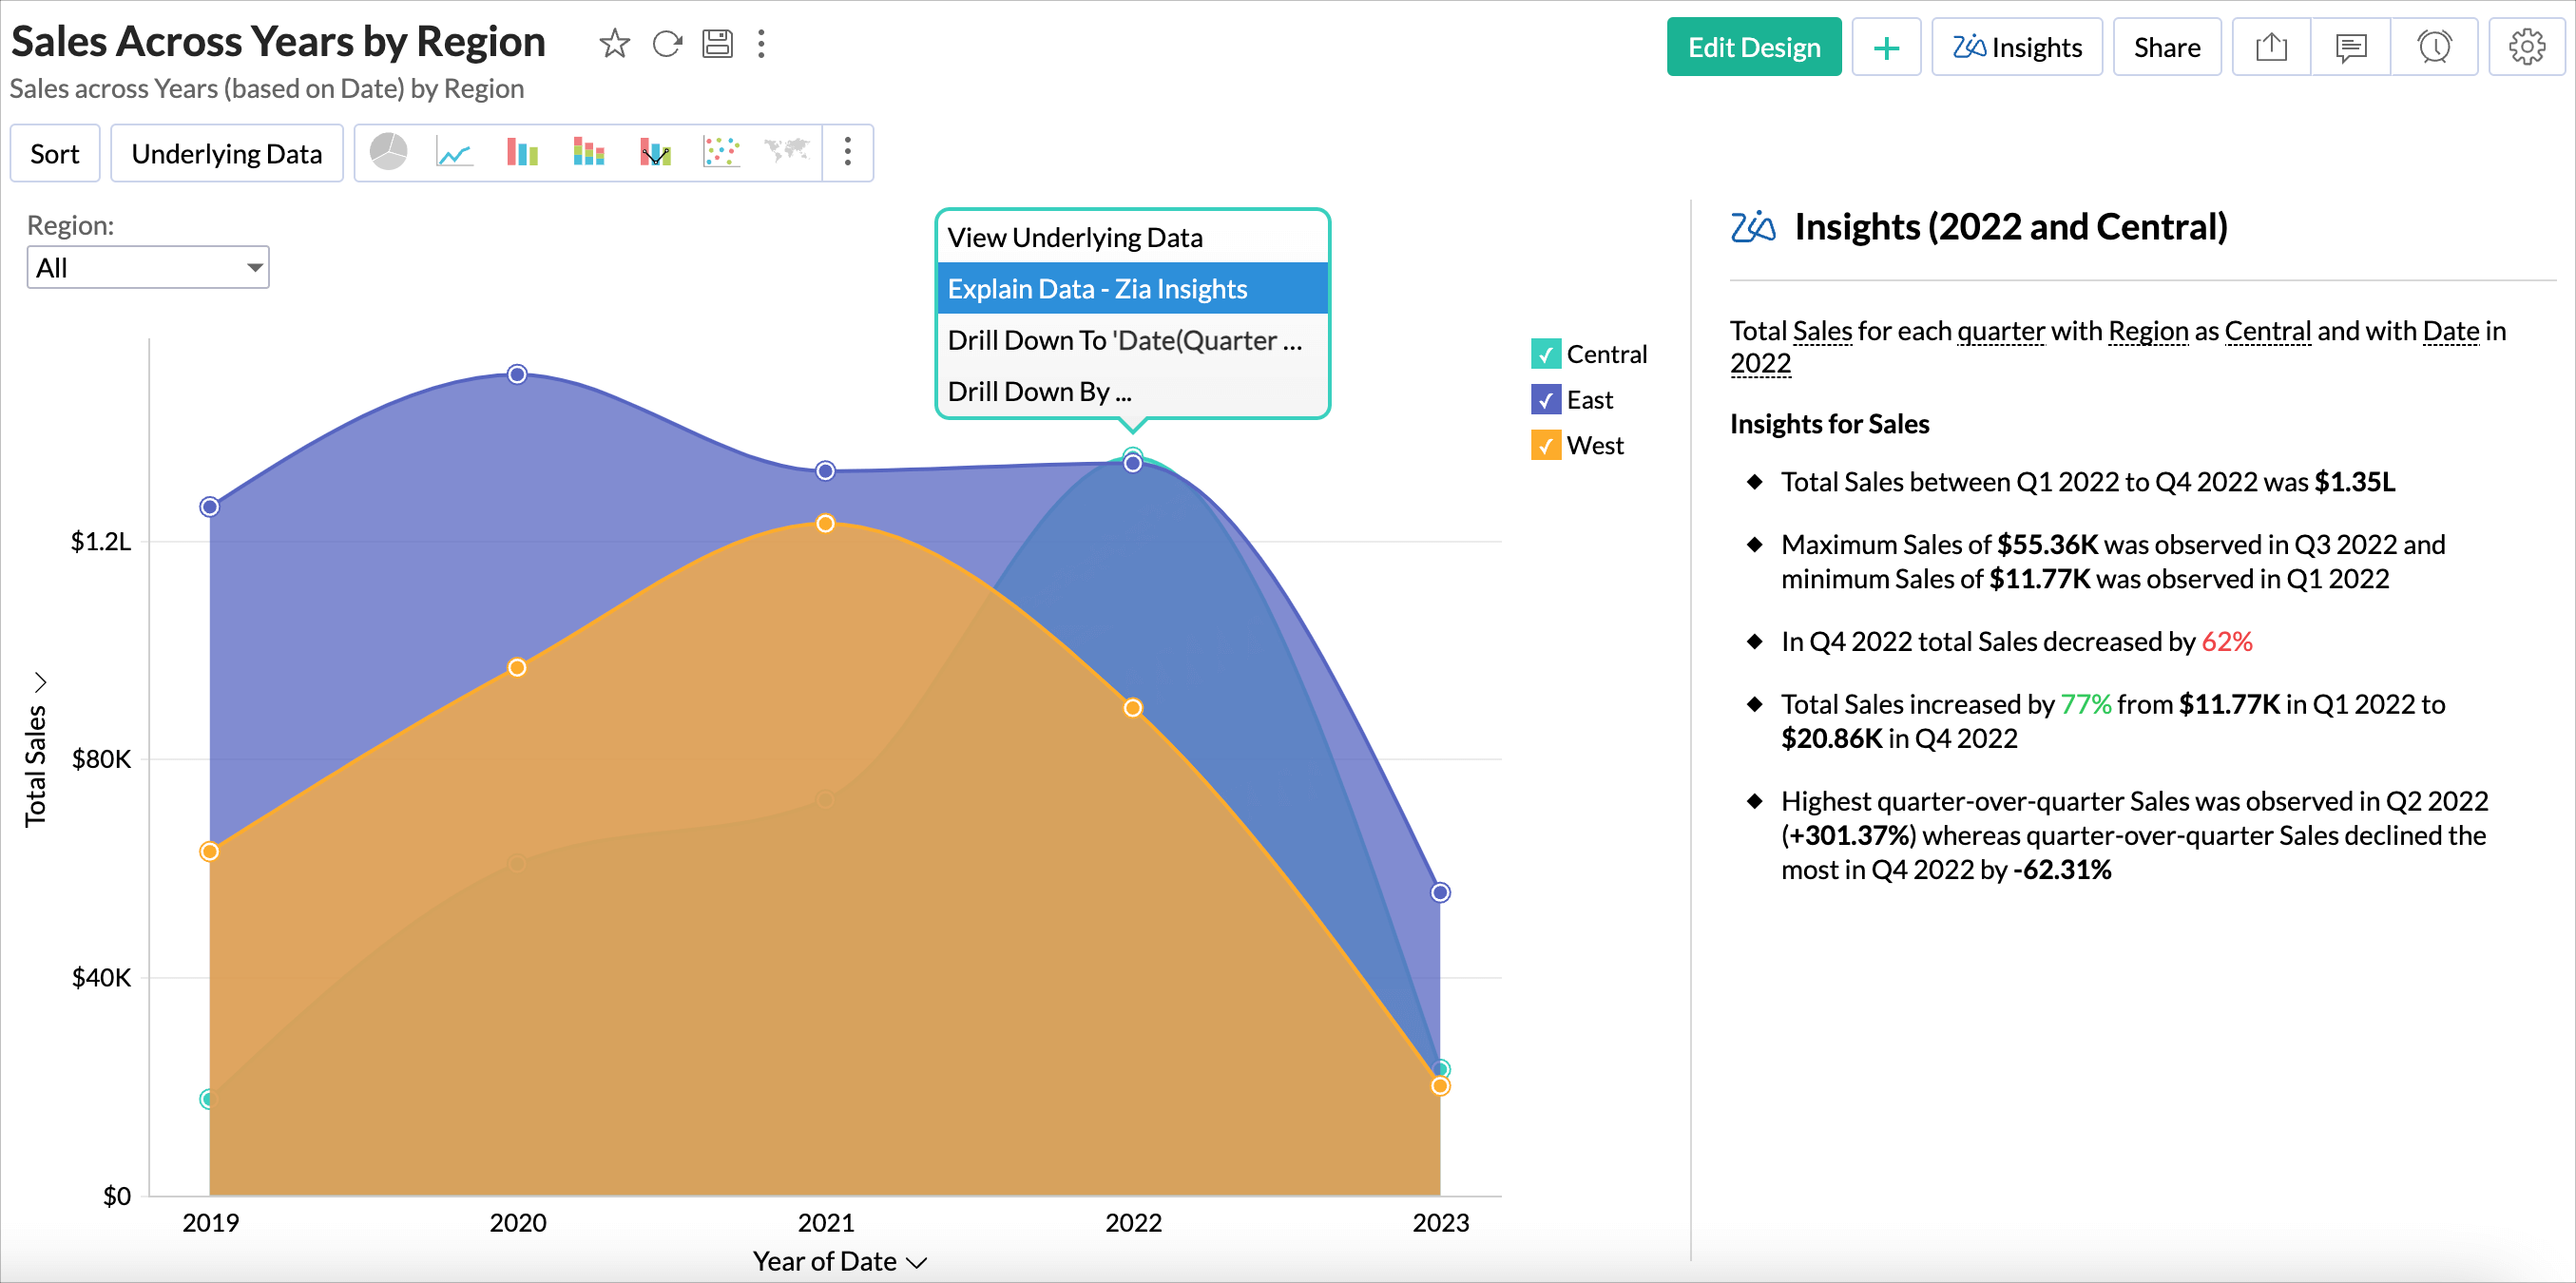
- Insights for the selected data point will be displayed in the right.
Explanations
When a data point is selected, insights are provided in the following three ways to help understand its significance.
Insights specific to the Data Point
Insights specific to a data point analyze its trends, identifying whether it is increasing, decreasing, or stable over time. They also highlight the maximum and minimum recorded values, helping to understand its range. Outliers are detected to flag unexpected spikes or drops, while seasonality insights reveal recurring patterns influenced by external factors.
Data Point Compared with Overall Value
This insight compares the selected data point against the total value. It helps determine its contribution to the overall metric and whether it is above or below the overall trend.
Example: If the selected Ad Spend for Product A is $50,000 and the total ad spend is $500,000, then Product A accounts for 10% of the overall spend.
Data Point Compared with Peer Values
This insight compares the selected data point with other similar data points (peers) within the same dimension. It helps assess whether the selected data point is performing better, worse, or similarly compared to its peers.
Example: If the selected Ad Spend for Product A is $50,000, while Product B has $40,000 and Product C has $60,000, this comparison shows how Product A ranks within its category.
| Category | Insights | Description |
| Insights Based on Selected Data Point | Trend | Identifies whether the data point follows an increasing, decreasing, or stable trend. |
| Seasonality | Detects recurring cycles in the data point over a time frame. | |
| Surge and Decline | Highlights significant increases or decreases in the data point. | |
| Outlier | Determines whether the data point is an anomaly affecting overall trends. | |
| Growth Rate Analysis | Examines the percentage change in the data point over time. | |
| Data Point Compared with Overall Value | Focused Category vs Overall Aggregate Insight | Compares the selected data point’s total value to the overall total. |
| Comparative MinMax | Highlights the highest and lowest values of the data point versus overall values. | |
| Threshold | Checks whether the data point falls below or exceeds a predefined threshold. | |
| Driving Column Contribution | Compares the data point’s contribution within a category versus the overall contribution. | |
| Data Point Compared with Peer Values | Rank of Chosen Category Among Peers | Shows how the data point ranks among its peers. |
| Correlation with Peers | Identifies relationships between the data point and other similar data points. | |
| Trend observed compared with peers | Determines whether the data point’s trend follows or diverges from similar data points. |