Charts and reports
Make every project a success. Use multiple types of charts to easily plan your projects and manage your team, track your project progress accurately with detailed reports, and get deep insights into how work is moving forward.
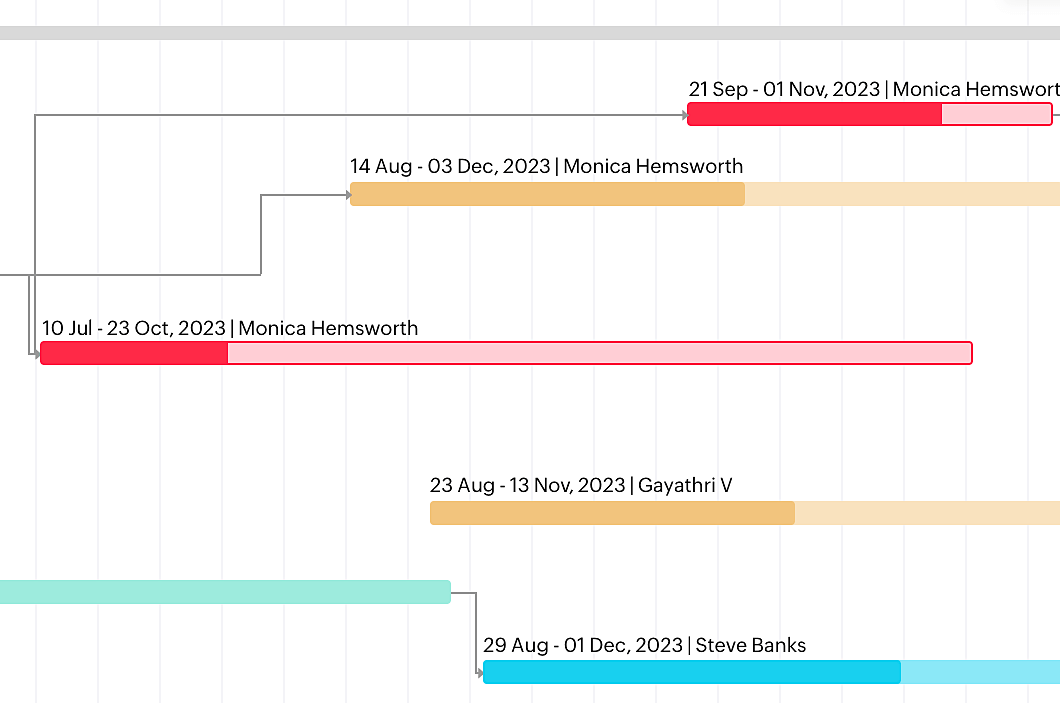
Gantt Charts
Plan your work thoroughly with the help of Gantt charts, create dependencies between related tasks, reschedule tasks easily, and track progress closely. The Gantt also shows you the critical tasks in your project and helps you set multiple baselines to ensure that you stay on track every time.
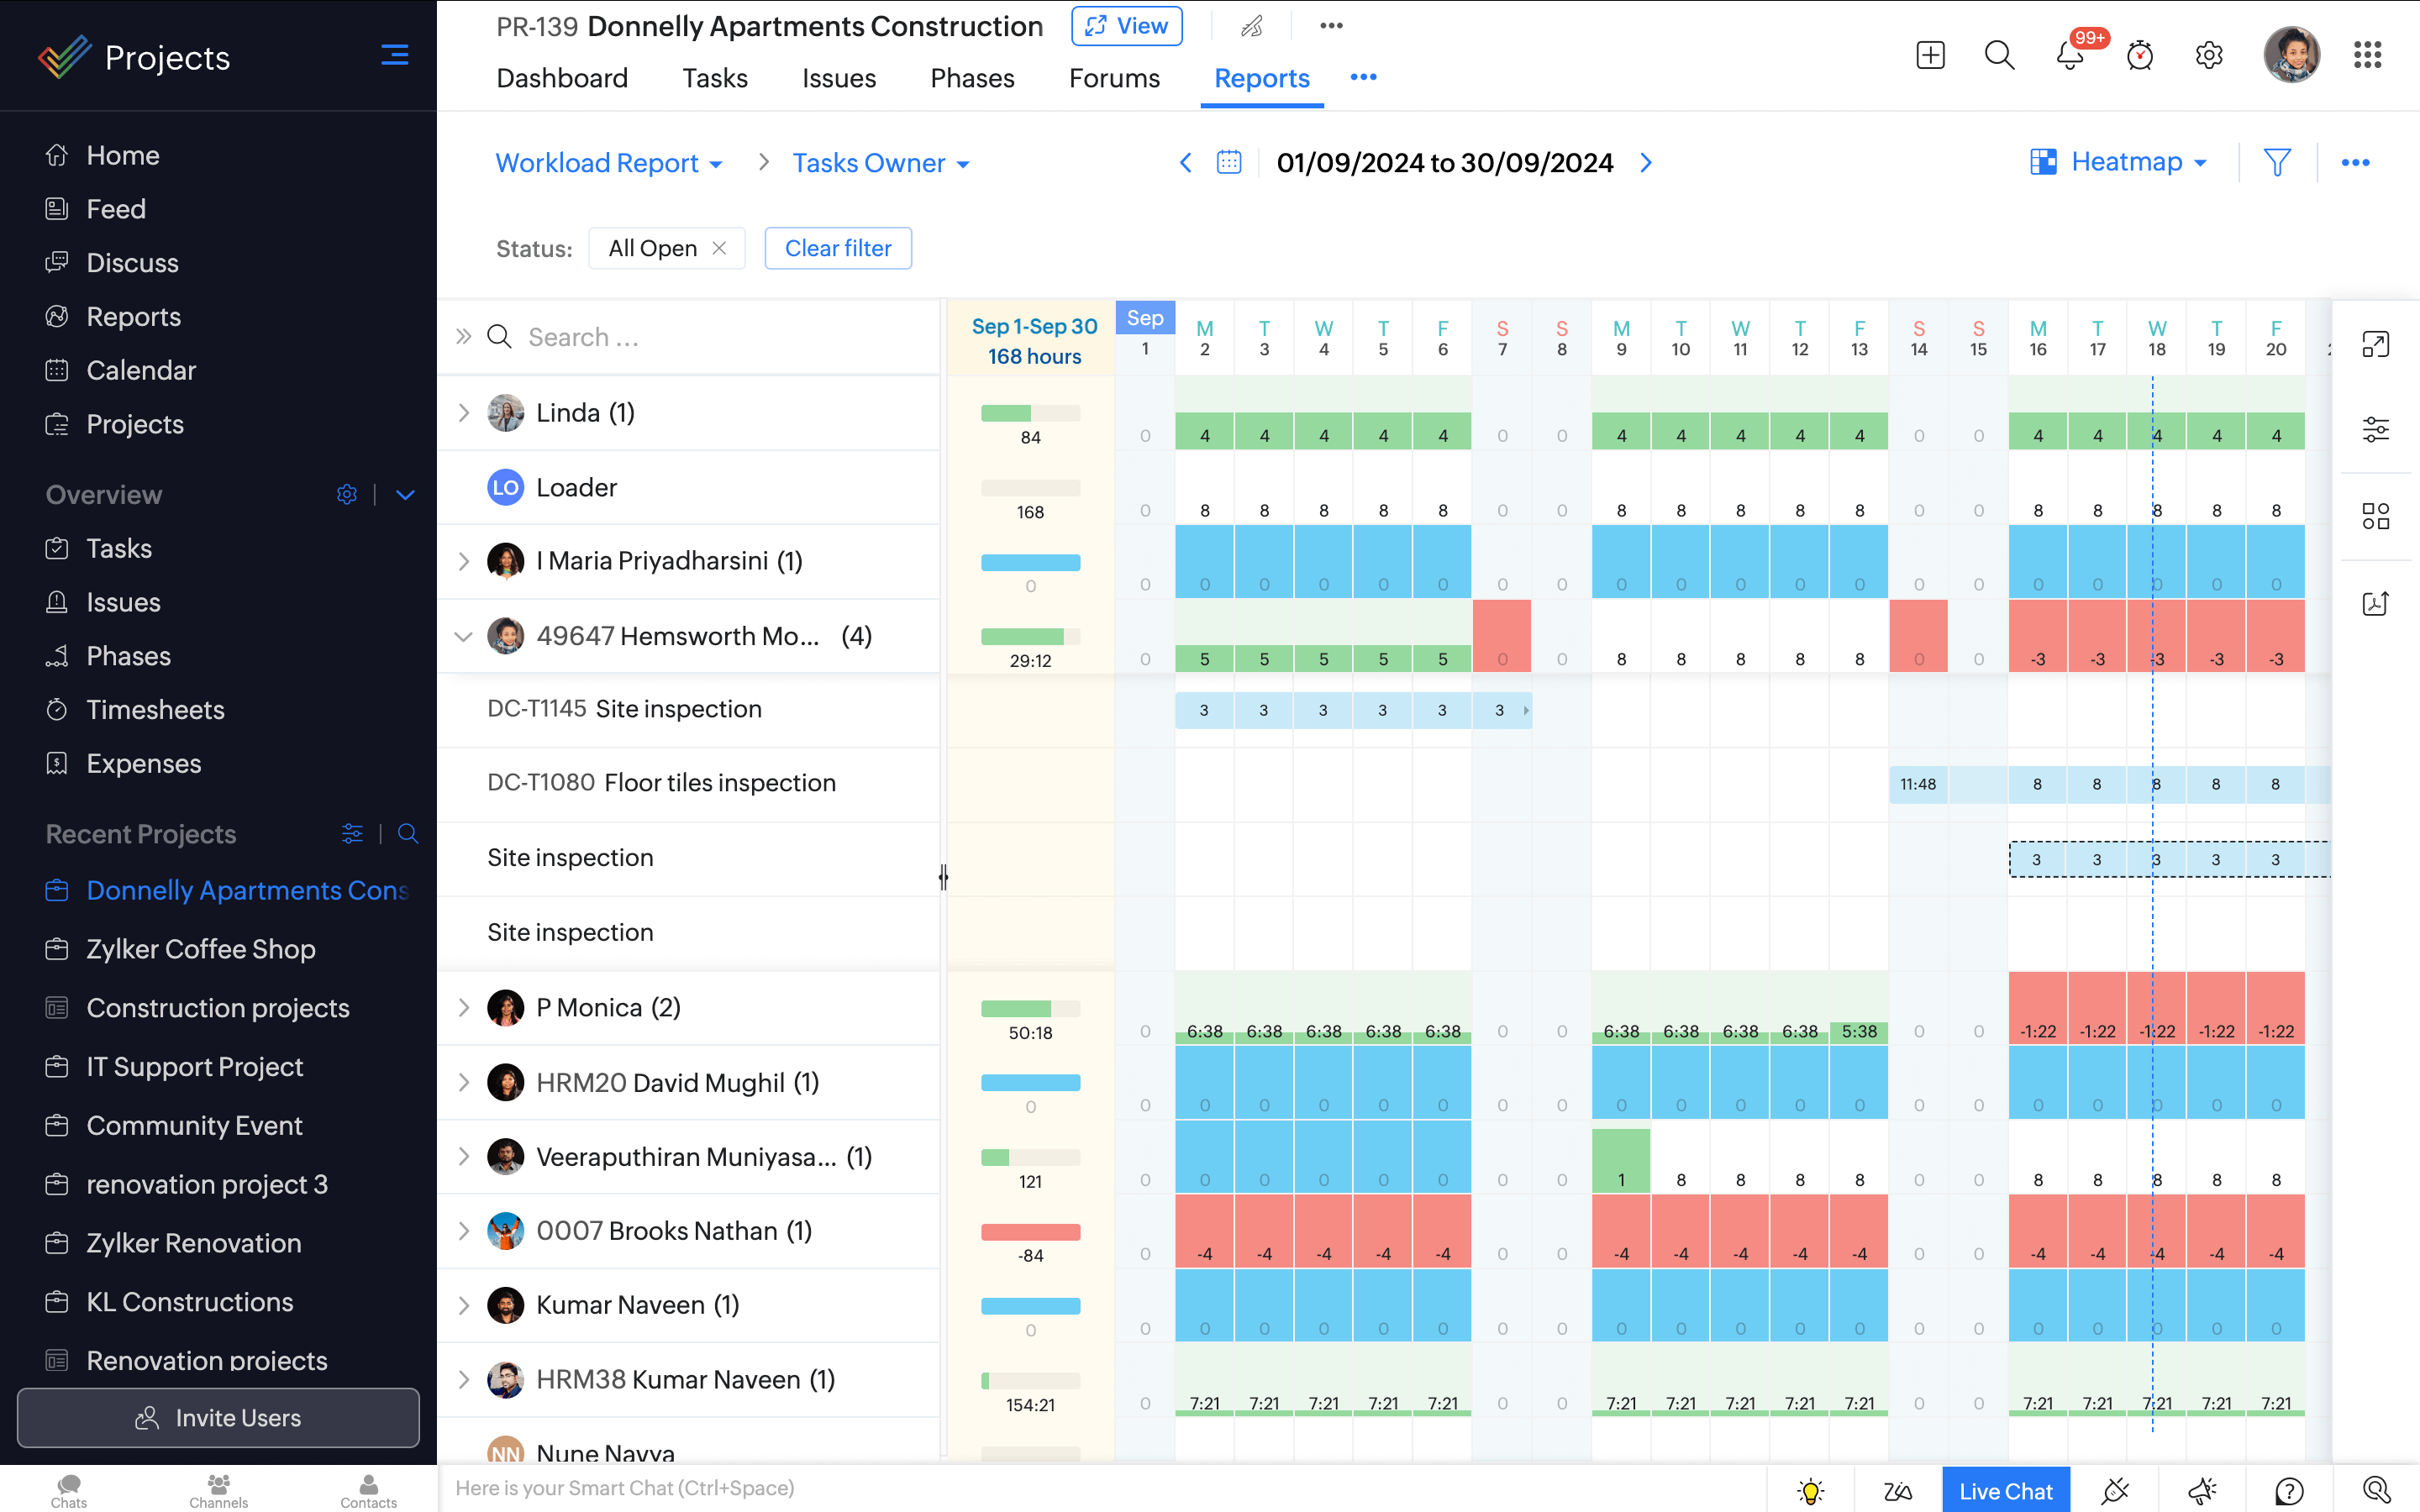
Workload Report
Manage your team's workload by distributing work evenly amongst your team members. Know who among your team is overloaded with work or free enough to take up additional tasks. Add new tasks right here, know your team's availability, and assign or reschedule work to the right people.
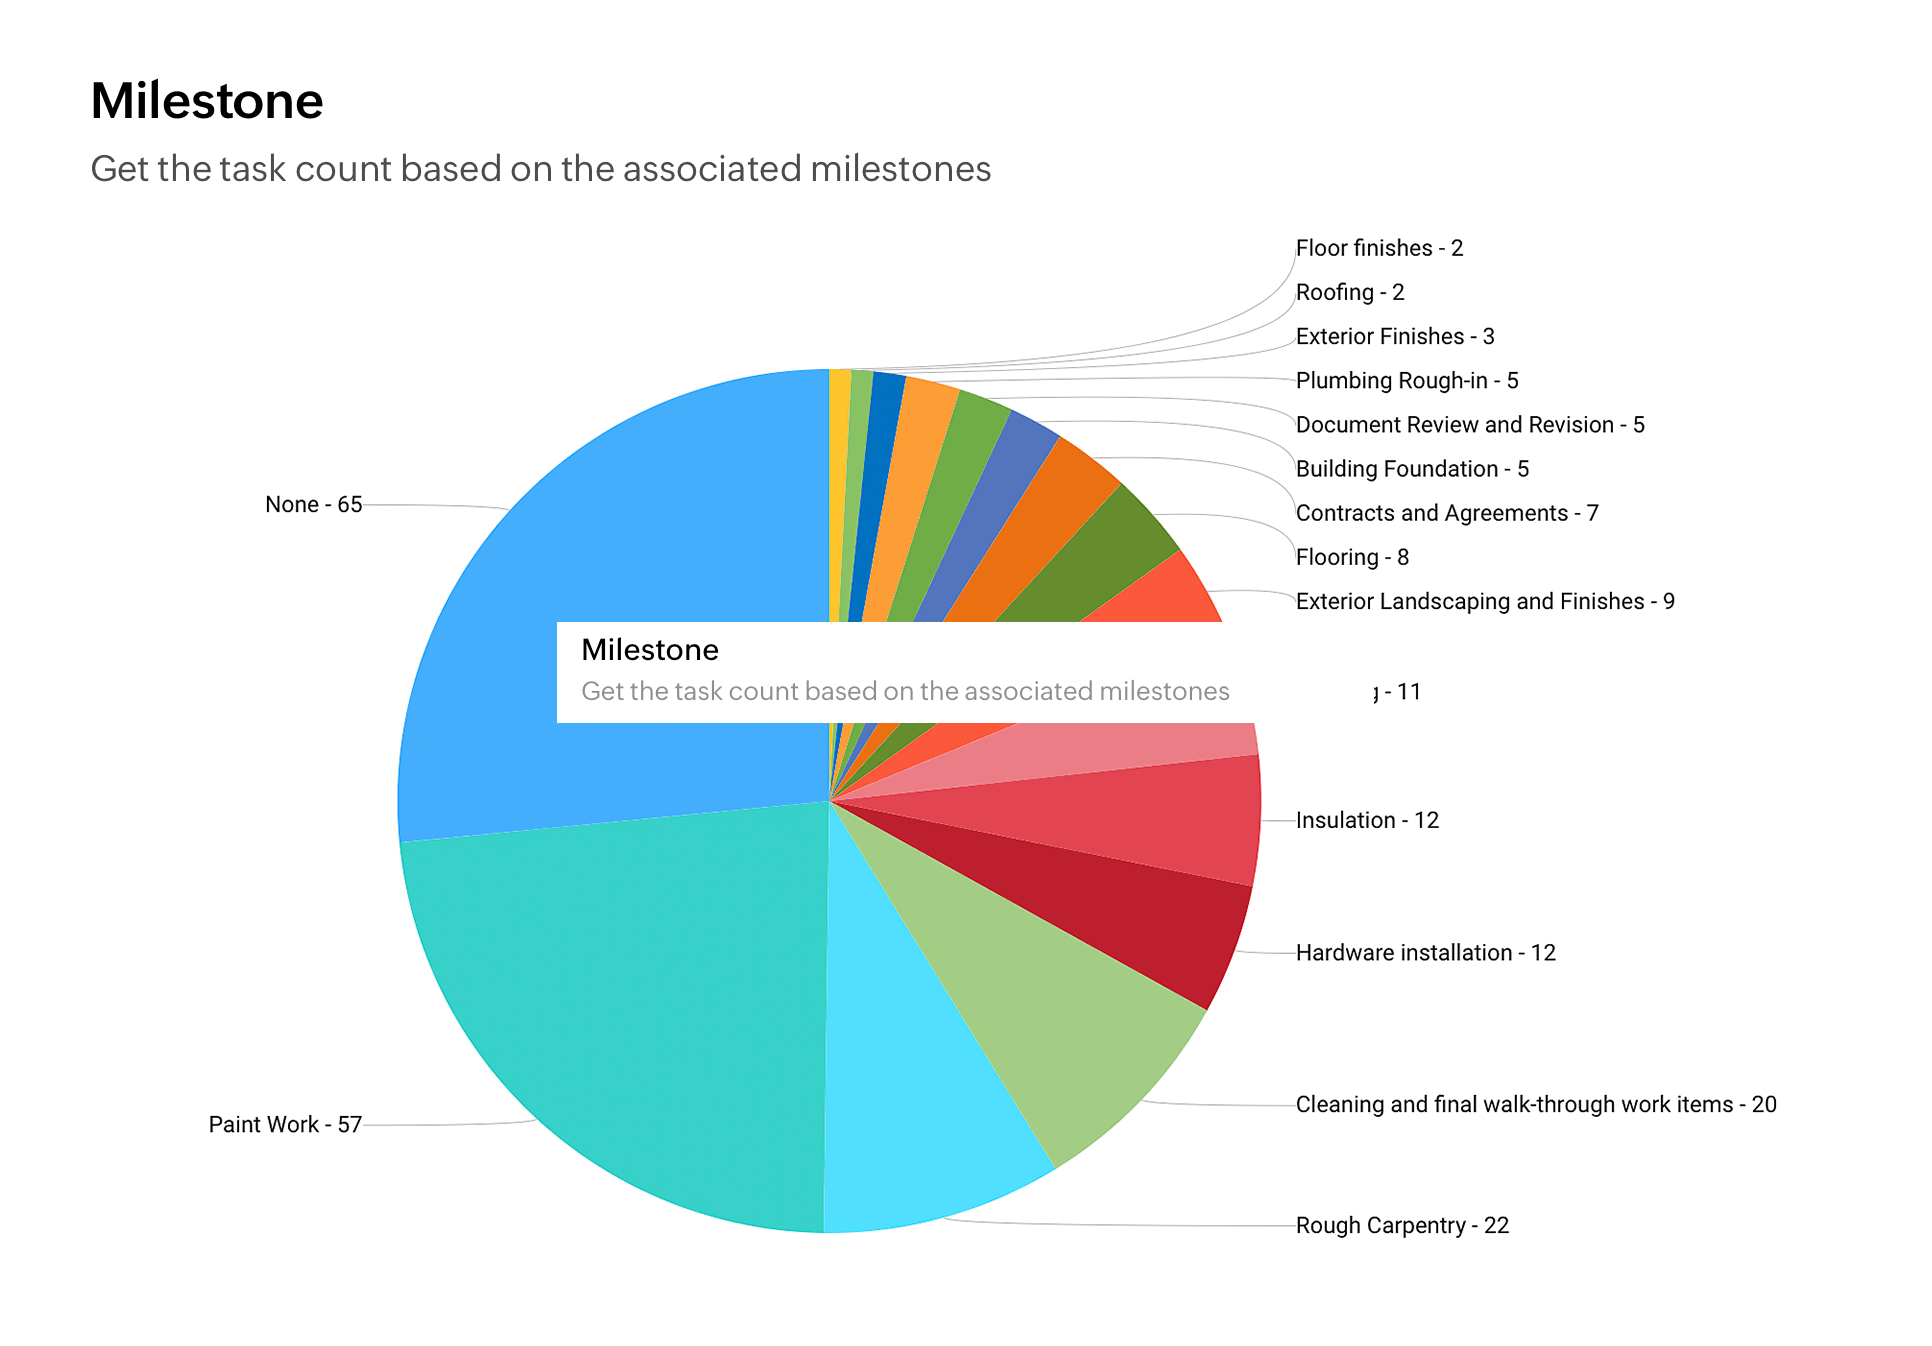
Reports
Visualize your data with the help of basic and advanced reports and get deep insights about your project, work items, and timesheets. Create custom reports for every metric by choosing chart type, criteria and plot options. Employ average, summation, minimum or maximum to precisely envision project KPIs.
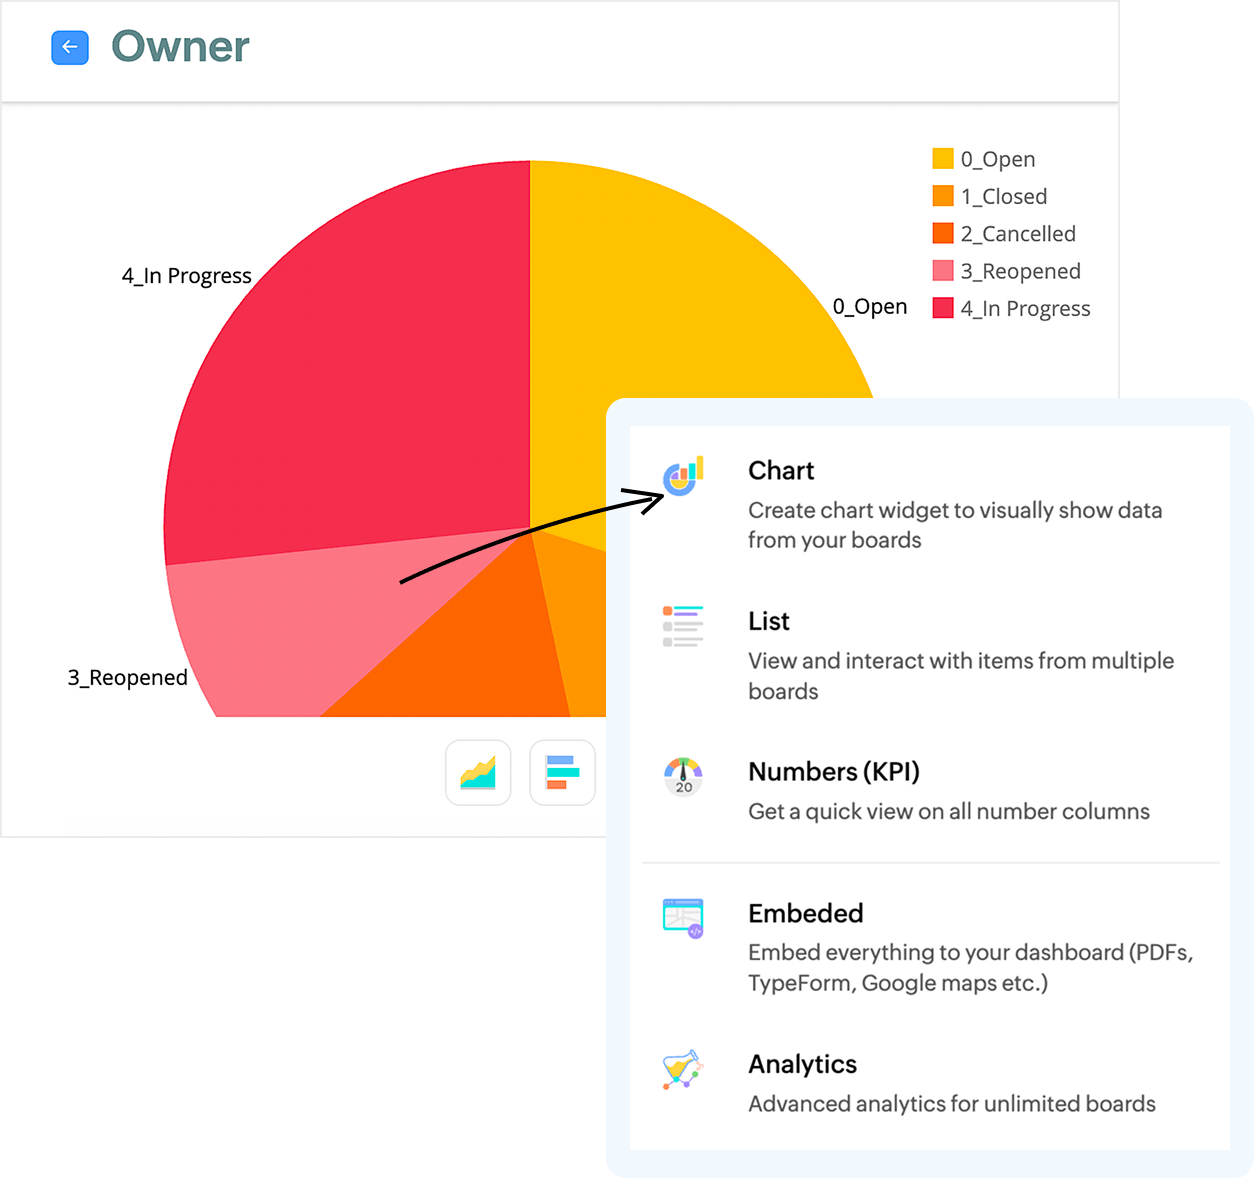
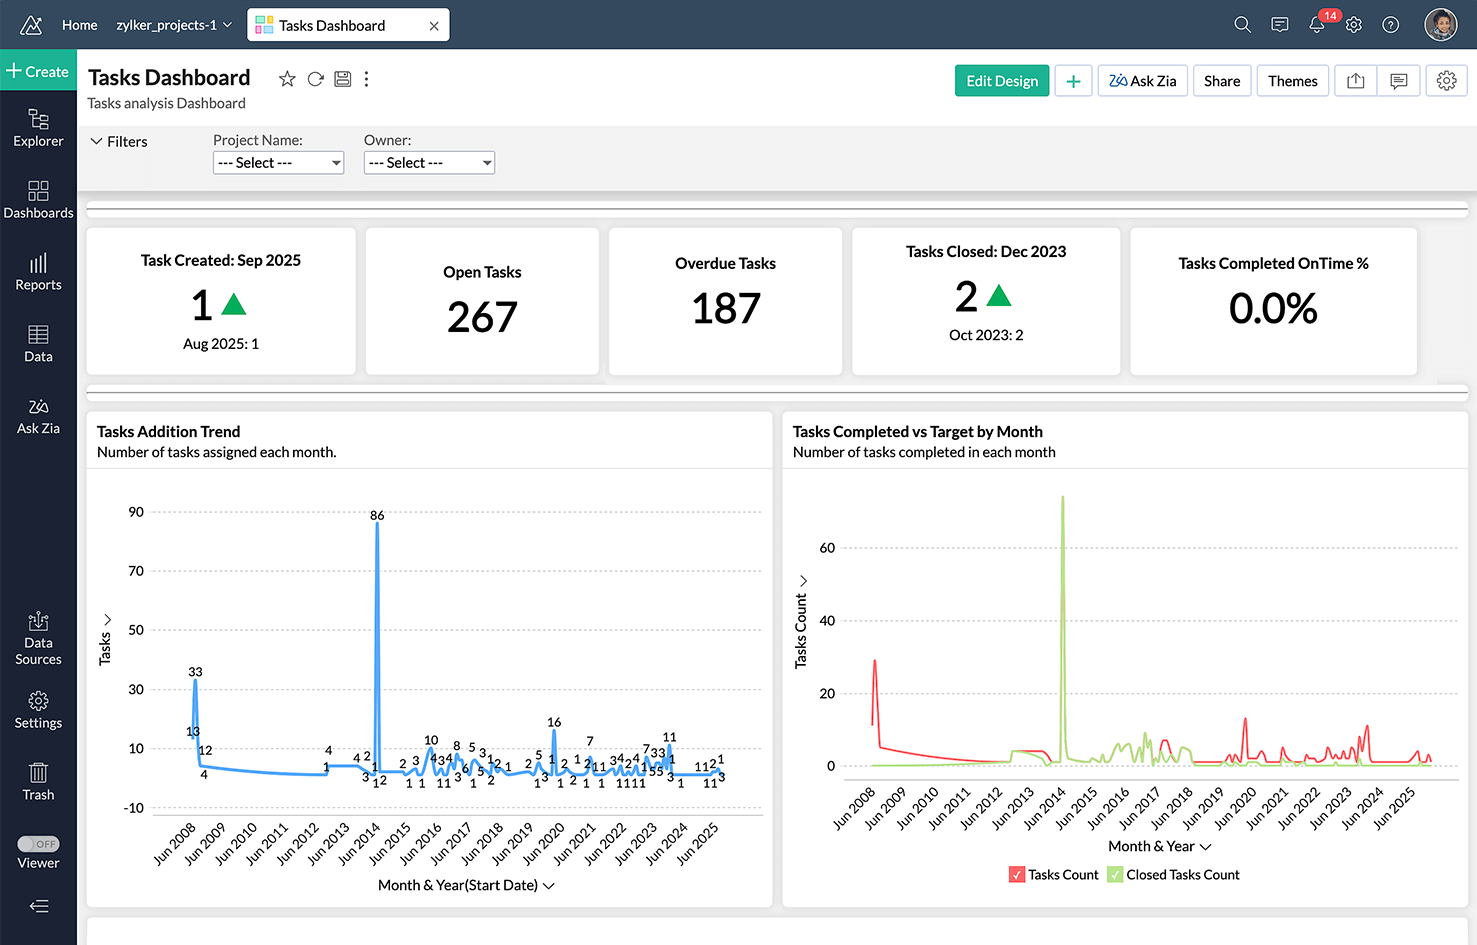
Dashboards
Build personal, project-level and team-level dashboards by grouping widgets, graphs and KPIs, to present data exactly the way you want. Bring transparency and accountability to work by ensuring that every team member has access to the actual numbers.
Zoho Analytics Integration
In addition to the existing reports in Zoho Projects, you can integrate with Zoho Analytics to get 50+ additional charts and reports. Design and view custom reports, embed reports across websites and blogs, and share, export, or print them.