
Analyze smarter with Zoho Survey
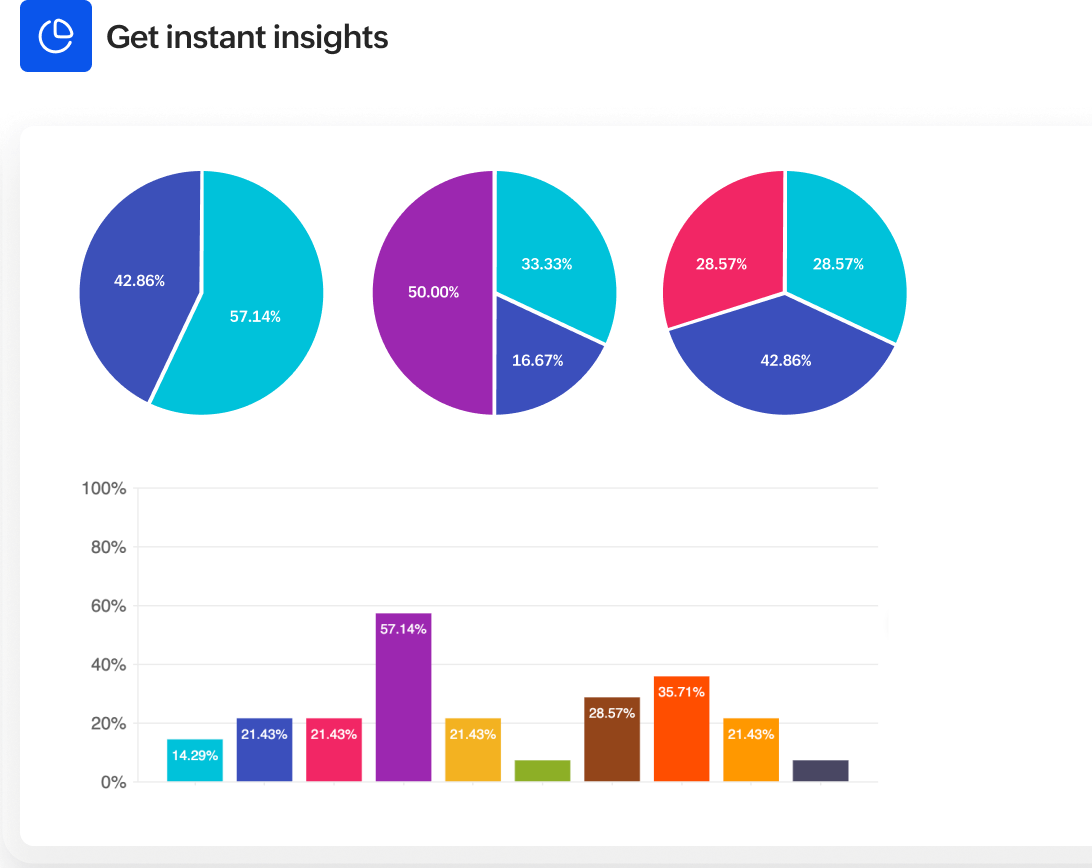
Dashboards give you a real-time visual summary of your survey responses. You can use charts and graphs to spot trends quickly, such as the most common product preferences or average customer satisfaction levels, without having to go through all the individual response
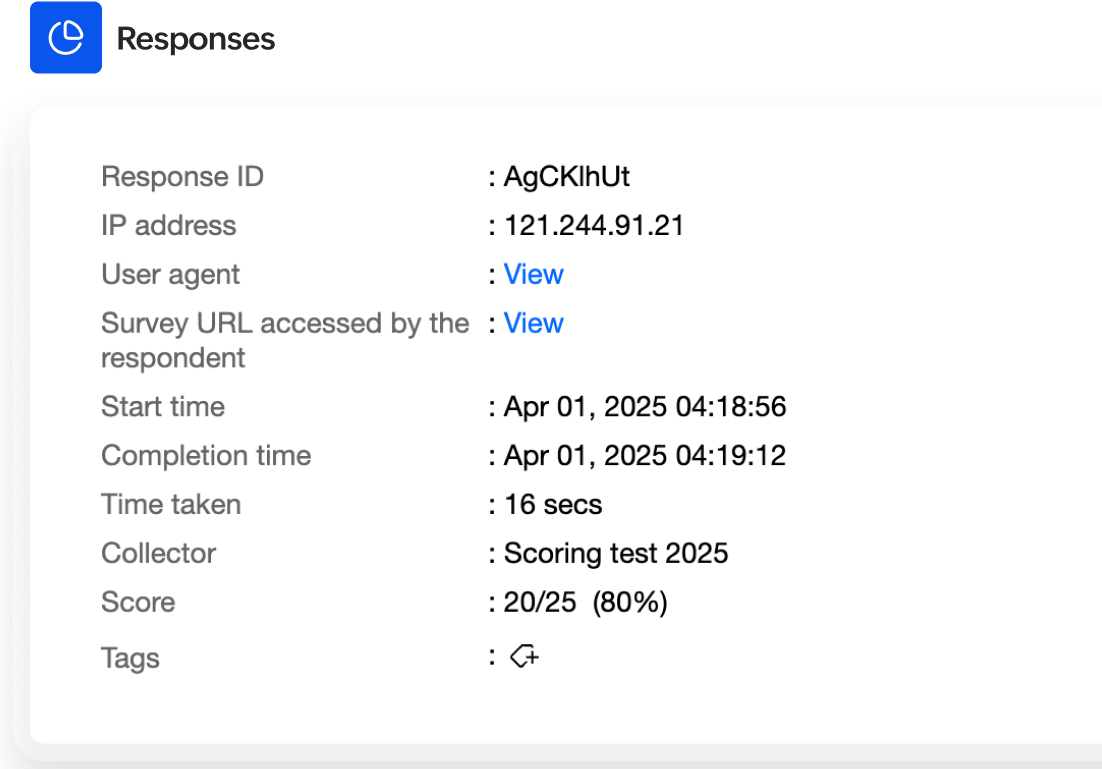
You can view all the answers given by a single survey participant. This helps you analyze personal opinions in detail and develop insights into different segments of your audience.
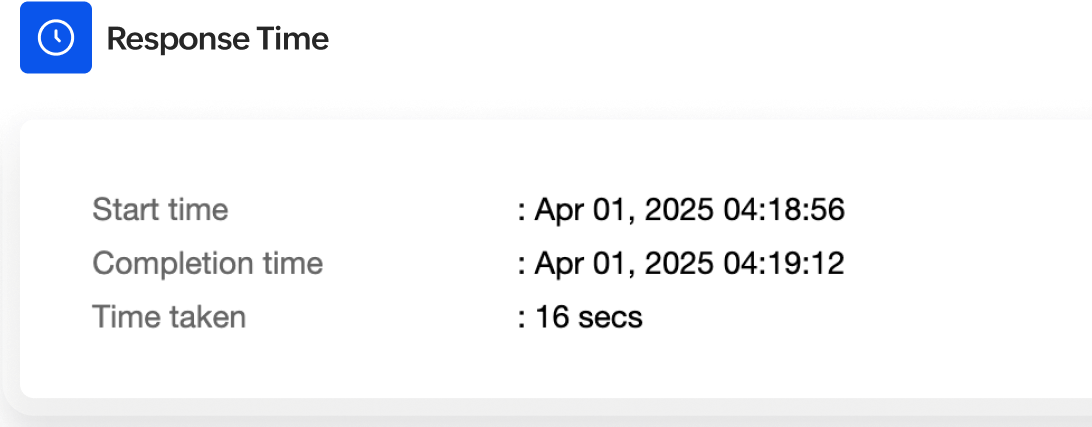
You can find out how long a participant took to complete a question or the entire survey, which helps you analyze the effects of any inattentive or rushed responses by identifying any unusually short completion times.
Analyze responses to detect positive, negative, or neutral feedback, helping you gauge overall sentiment.
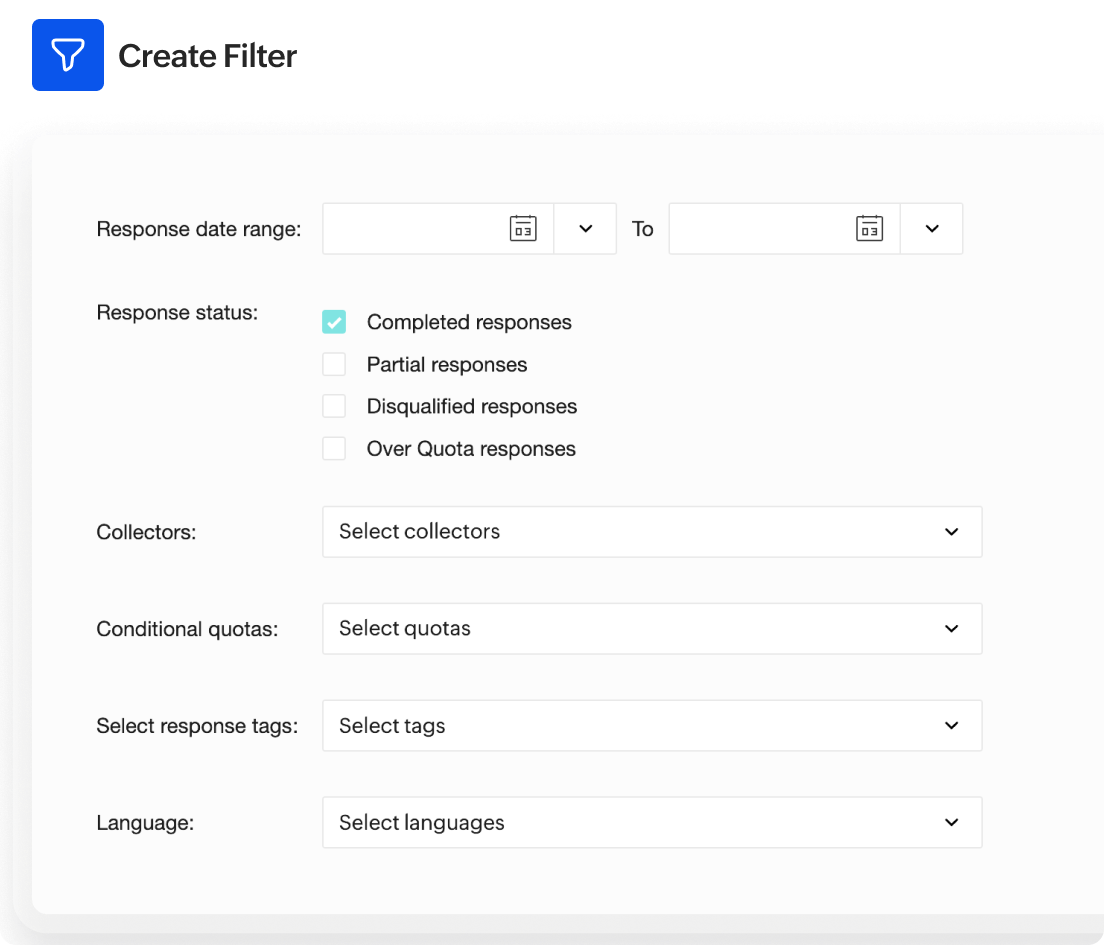
Filter survey responses based on completion status, or create and customize filters according to your specific requirements. You can customize filters by date range, language, logic conditions, collectors, and more.
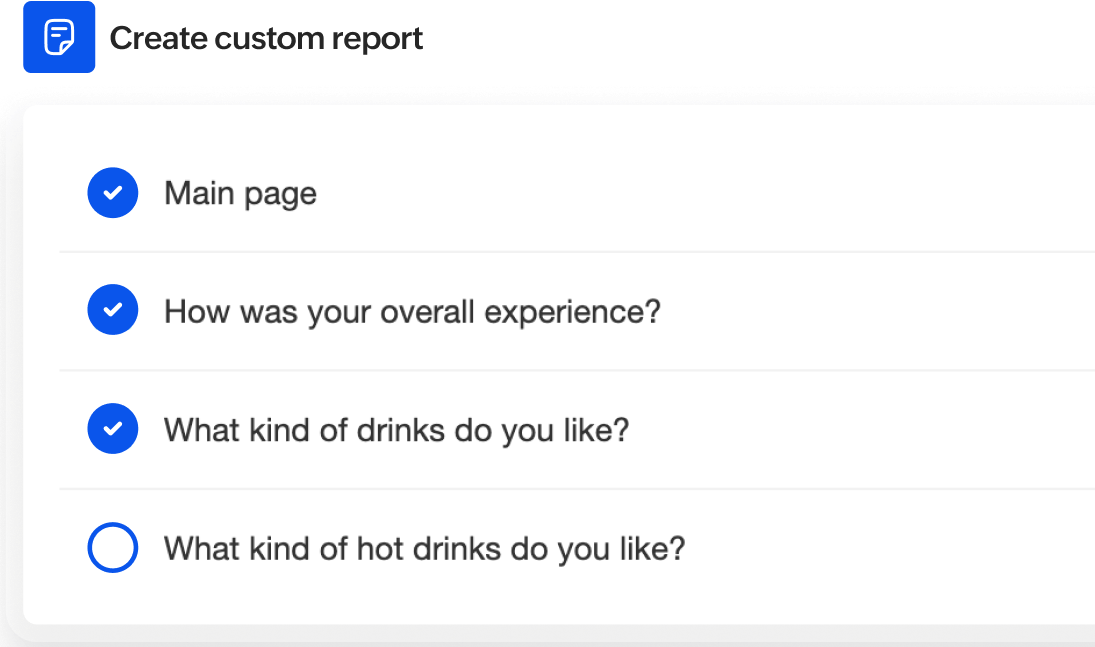
Build your own report by choosing which questions, filters, and data views (charts, tables, etc.) you want and analyze the responses as you desire.
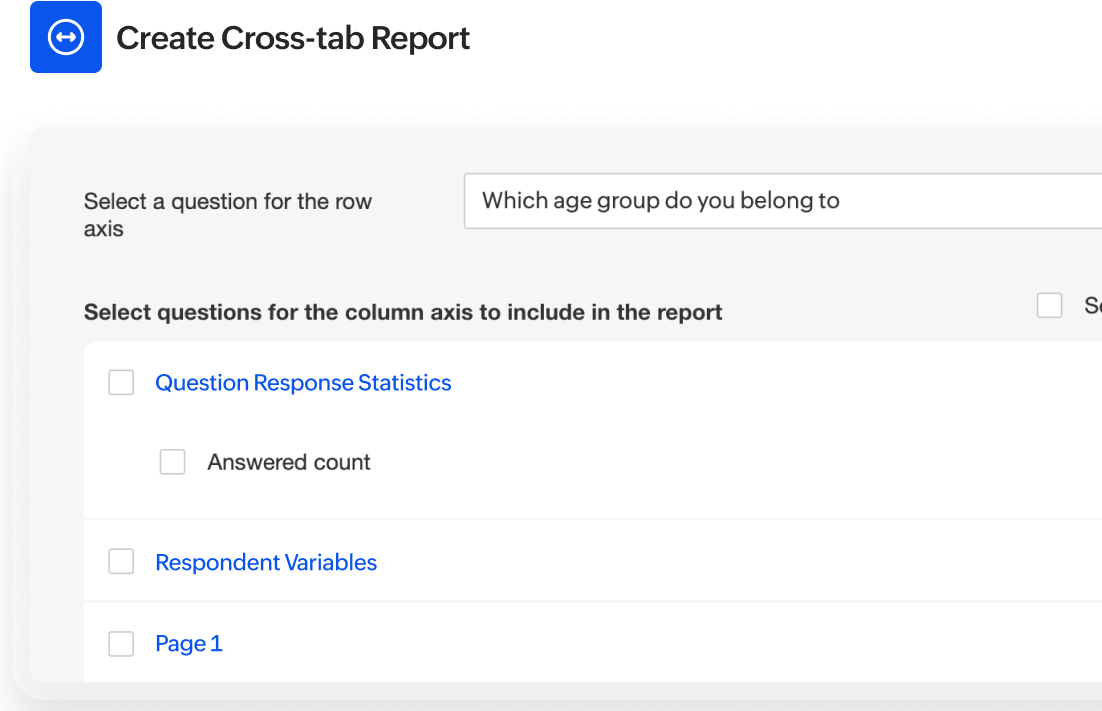
You can select two questions and see how the answers stack up against each other. Make it even more tailored by adding filters and variables to dive deeper and get the insights you need.
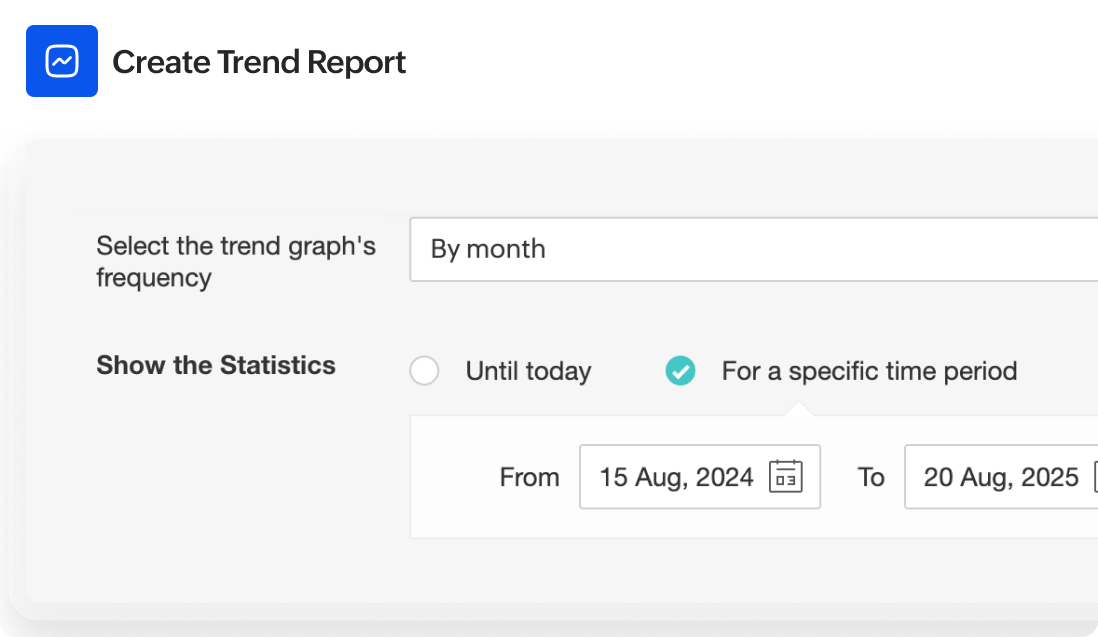
Track how responses have changed over a specific period. This helps you to understand shifts in sentiment or opinion, so you can easily spot trends and measure the impact of changes or events over time.
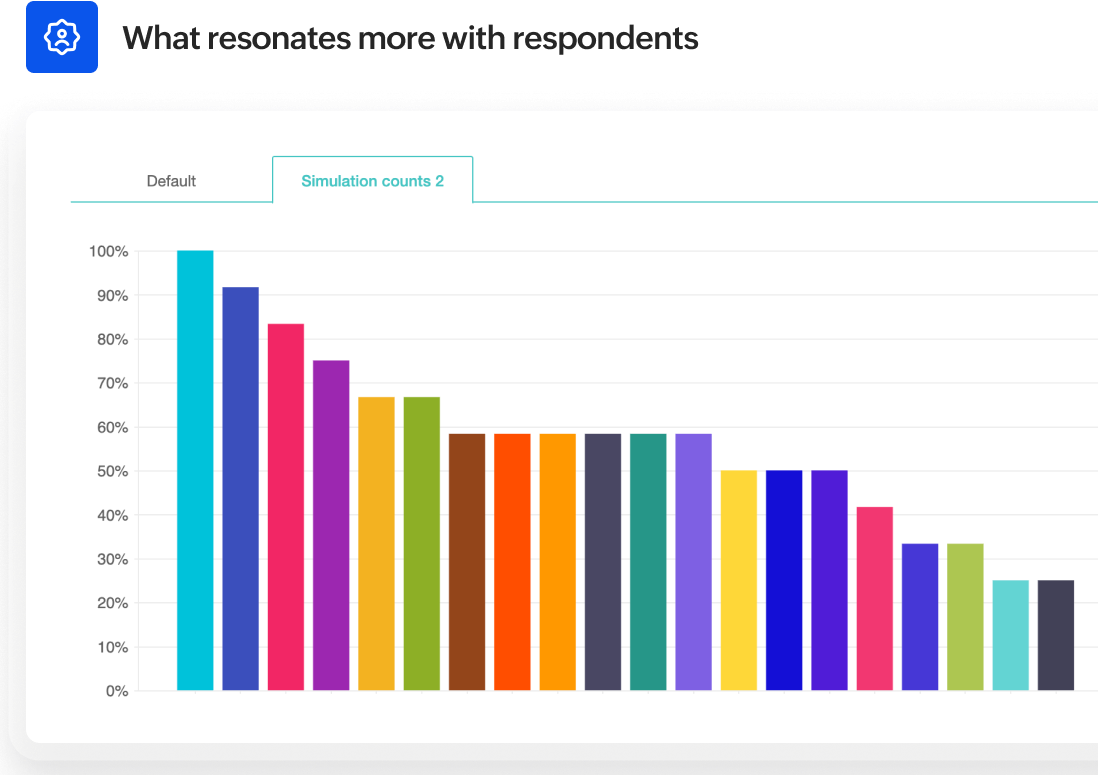
Total unduplicated reach and frequency (TURF) analysis helps you determine the optimal combination of options respondents have chosen in your survey. It analyzes which combination of survey choices, features, or attributes will appeal to the largest number of respondents, without overlap. It's perfect for understanding which options, when offered together, will attract the broadest audience.
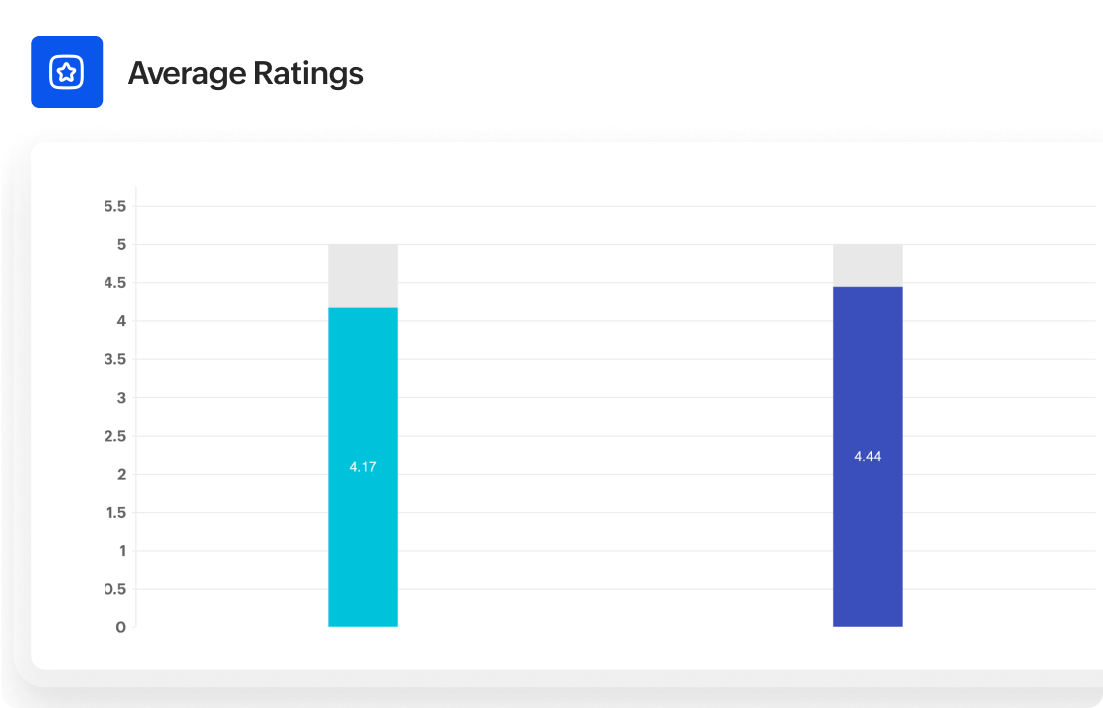
Check the average score from questions where respondents have rated something. This number shows the general opinion of all your survey participants in a simple way.
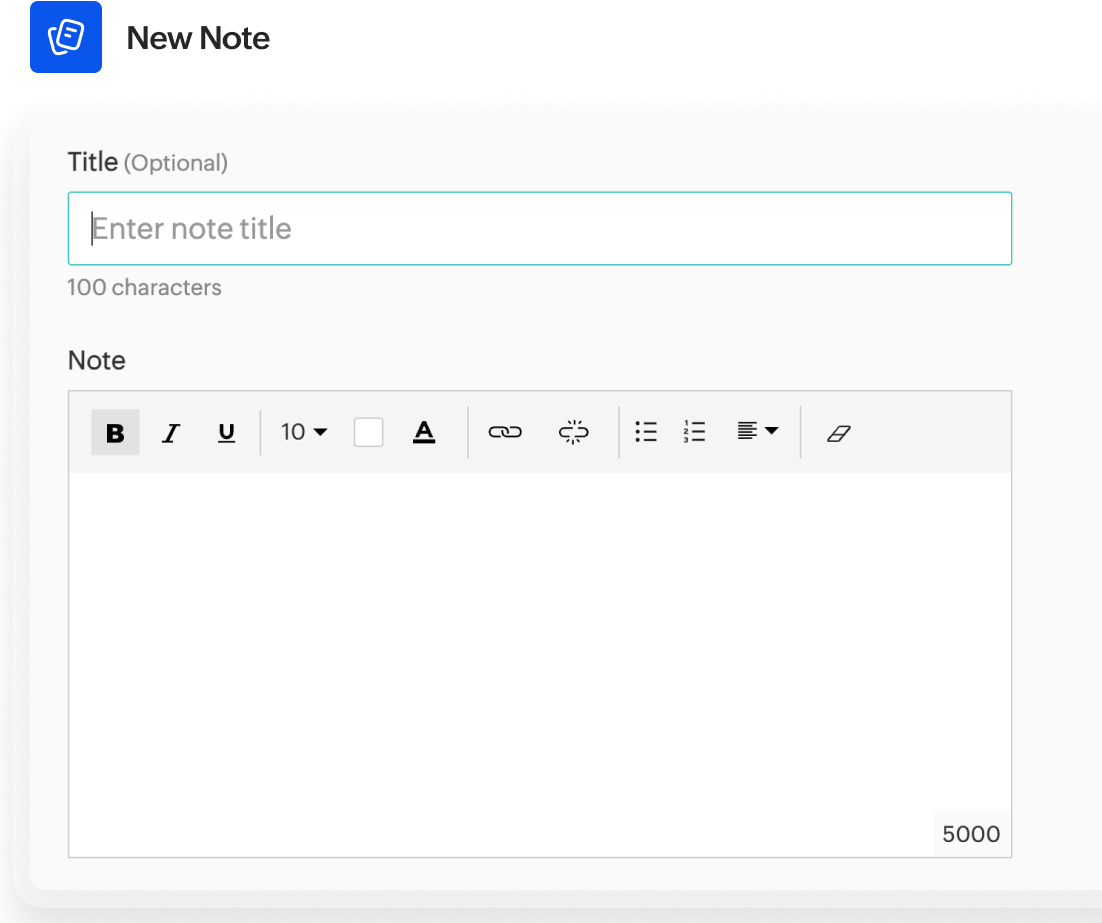
You can add comments directly within your survey reports. You can easily jot down observations and share insights so that you or your team can refer to them later.
Frequently asked questions
In Zoho Survey, after your survey gets responses, you can go to the Reports section of your survey. There, you will see different ways to view your results online, like summaries and individual responses.
Yes, Zoho Survey lets you export your survey reports in PDFs or as spreadsheets, and integrates with Zoho Sheet so you can easily save and share survey reports.
Absolutely! Zoho Survey has built-in tools to generate various charts and graphs automatically (bar charts, pie charts, etc.) to visualize your survey data within the reports. You can often customize these as well.
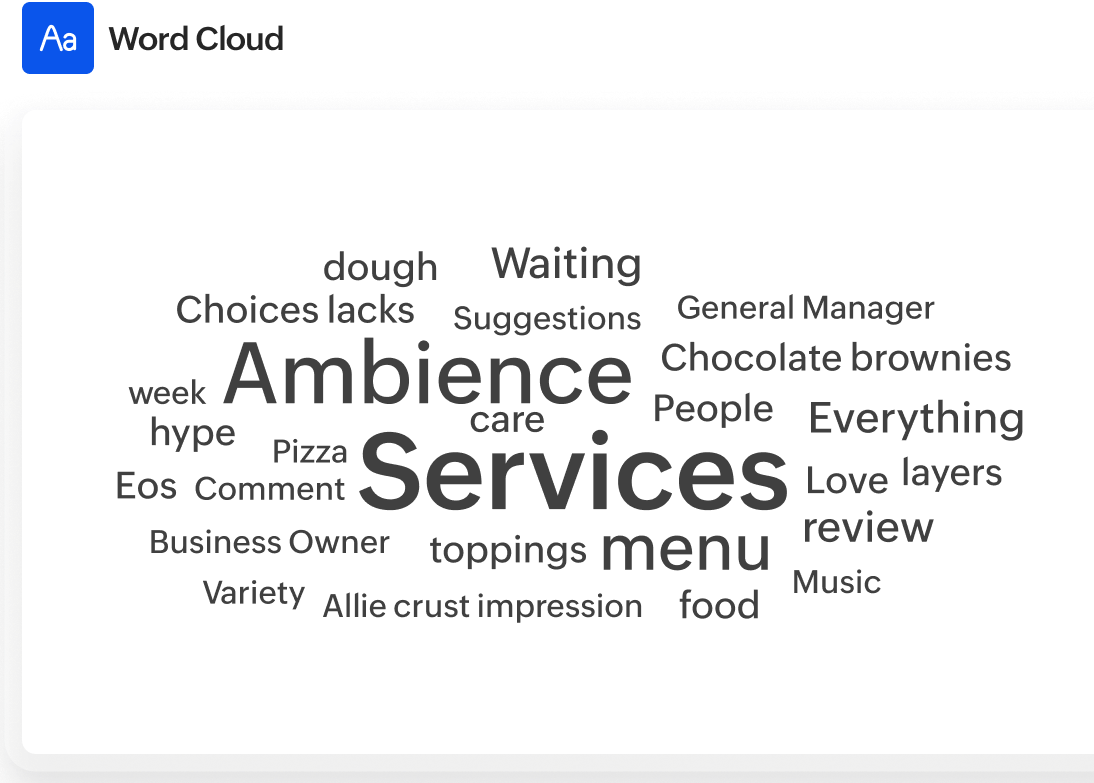
Zoho Survey provides tools for analyzing text responses, such as word clouds and sentiment analysis.