Customer effort score (CES) survey
CES is a key metric that measures how easy it is for customers to interact with your business. It focuses on the customer’s journey and assesses the level of effort they must exert to accomplish their goals, whether it’s making a purchase, resolving an issue, or finding information.
Essentially, it’s a measure of convenience. The lower the effort a customer has to put in, the higher your CES score, which indicates a positive customer experience.
Try this template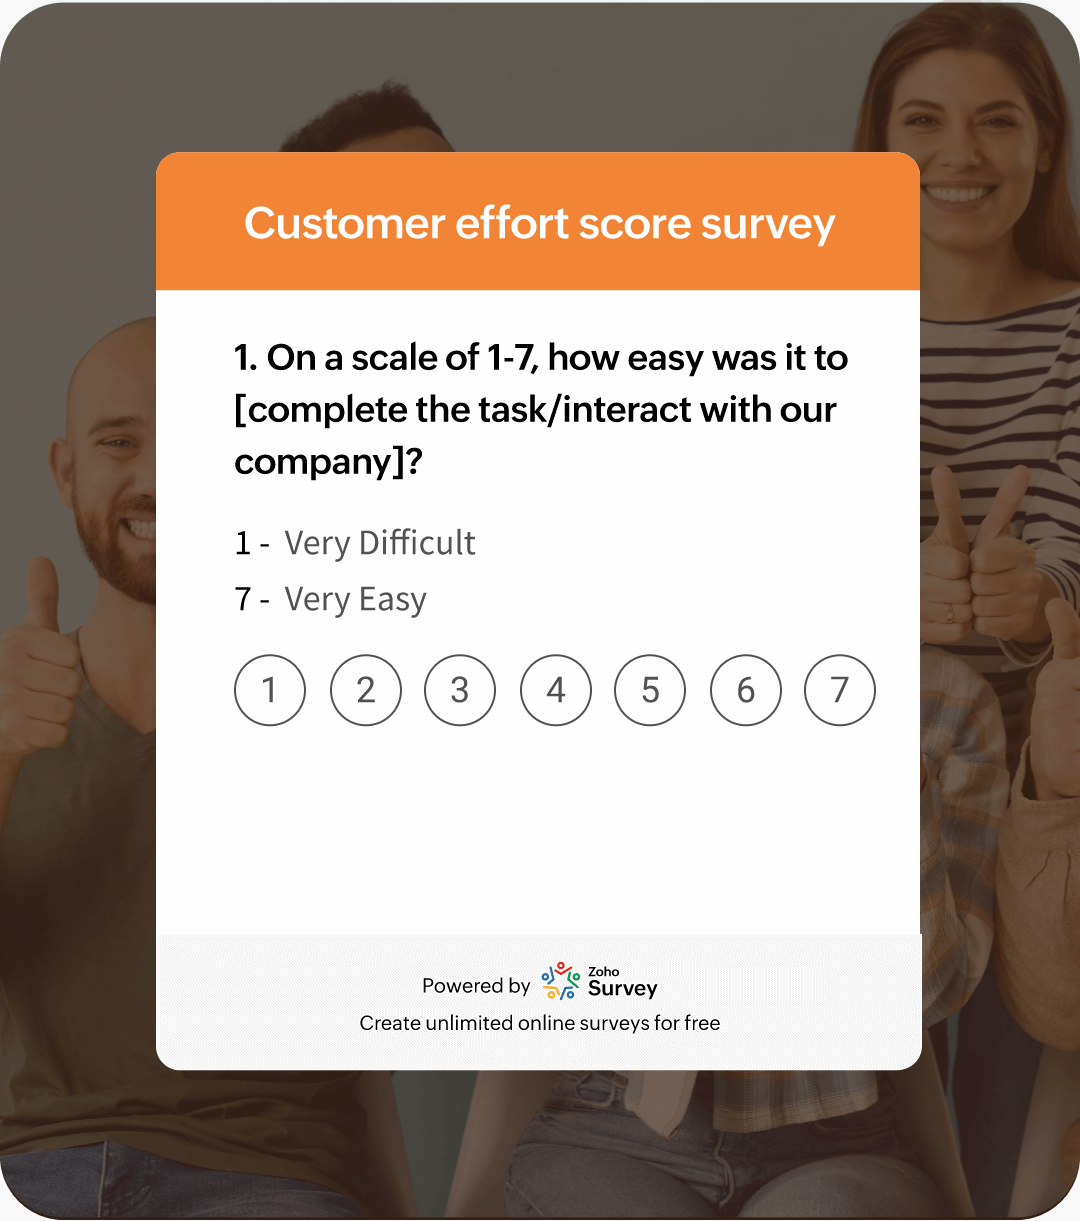
Customer effort score (CES) survey
5
2,700+
1min
Uncover hidden gems in your customer data
Protect your reputation
A single frustrating customer experience can lead to a cascade of negative reviews and social media posts. By measuring CES, you can identify the specific areas where customers are encountering difficulties. Addressing these issues proactively can prevent damage to your brand reputation and protect your hard-earned goodwill.
Cut costs
Every support ticket represents a cost to your business. By pinpointing the exact reasons behind customer frustration through CES, you can implement targeted solutions. This might involve improving product design, enhancing training for customer support teams, or streamlining online processes. By reducing the number of support interactions, you can significantly lower operational costs.
Empower your customers
By analyzing CES data, you can identify where customers are struggling to find answers or complete tasks on their own. This insight can be used to enhance self-service tools, provide clearer instructions, and create more intuitive user interfaces. Empowering customers to solve their problems independently not only improves satisfaction but also frees up your support team to handle more complex issues.
Predict customer churn
Customers who have difficulty interacting with a business are more likely to churn. By tracking CES over time, you can identify trends and predict customer churn. By addressing issues proactively, you can reduce customer attrition and increase customer lifetime value. Additionally, customers who have positive experiences are more likely to make repeat purchases and recommend your business to others.
How Zoho Survey elevates CES survey creation

Keep your surveys concise
People are busy. Only ask essential questions.
Focus on specific interactions
Don’t ask about the entire journey in one question. Determine which customer interactions or touchpoints are most critical to measure and focus on areas with high customer volume or known pain points.
Choose a suitable rating scale
Opt for a scale that aligns with your target audience and industry standards. A 5-point or 7-point Likert scale is common.
Incentivize participation
Offer rewards, discounts, or other perks to boost response rates.
Try our free CES survey template
How to calculate CES
To calculate your CES, add up all the individual customer effort scores and divide the total by the number of survey respondents. This average represents the overall effort customers exerted when interacting with your business.
- Customer Effort Score
- =
- Sum of all customer responses Number of responses
- Sum of all customer responses : The total of all customer ratings.
- Number of responses : The total number of customers who completed the survey.
Example:
If 10 customers rated their experience on a scale of 1–7, with 1 being very difficult and 7 being very easy, and their responses were: 5, 7, 4, 6, 3, 7, 5, 6, 4, 5
Sum of responses = 52
Number of responses = 10
CES = 52 / 10 = 5.2
CES calculation with emoticons
If you opt for emoticons in your survey, converting them to numerical values is essential for calculation:
- Assign numerical values: Determine a numerical equivalent for each emoticon based on the level of effort it represents.
- Convert responses: Replace emoticons with their corresponding numerical values.
- Calculate CES: Apply the standard CES formula using the converted numerical data.
How Zoho Survey elevates CES survey creation


Rating scale questions
Tailored survey paths
Multi-channel feedback collection
Cross-tabbing for accurate role matching
Trend reports for improving retention
Have questions? We’ve got answers!
What should I ask in a CES survey?
The main question is, “How easy was it to interact with our company today?” You can also ask open-ended questions for more detailed feedback.
How do I know if my product research is effective?
Effective product research results have clear, actionable insights that guide your product development and strategy. Track outcomes like increased customer satisfaction or successful launches as indicators.
Why is product research important?
Product research reduces the risks associated with new product launch. It provides insights into customer preferences, enabling you to take wise decisions that increase the chances of your success.
How can I ensure that my survey results are reliable and representative of my target audience?
To ensure reliable results, start by reaching the right audience. You can use Zoho Survey's Audience Panel to purchase responses from your exact target demographic by specifying age, gender, location, and more. Combine this with clear, unbiased questions for reliable and representative results.