• 16K

    Customers

  • 3M

    Users

Transform your data into powerful reports and dashboards with a data visualization tool

Import and visualize data from 500+ data sources

Import and visualize data from multiple sources for in-depth analysis. Access data from: Cloud business apps, Databases & data lakes, Cloud drives, Local files, Web URLs.

Data visualization software with 500 data connectors

Create reports & dashboards with 50+ visualization types

Make use of a variety of data visualization tools, including charts, widgets, pivot tables, and tabular view components. With an intuitive drag-and-drop interface, create interactive data visualizations like reports and dashboards.

Data visualization tool

Share visualizations with your team and collaborate securely

Share reports and dashboards with colleagues to enhance teamwork. Start contextual comment threads for real-time collaboration on specific reports or dashboards. Set up access control, Embed reports and dashboards, Set up emails schedules, Export or print reports.

Data visualization tool for collaboration

Present your data visually with automated slideshow generation

Select the reports and dashboards you want to present, and Zoho Analytics will automatically generate a slideshow with interactive visualizations and Zia Insights narratives. No more copying and pasting report images—make your presentation as dynamic as you are.

Data visualization software chart types

Blend data from different sources for cross-functional analytics

Merge data from different sources to generate cross-functional reports and gain deeper insights into your business. For instance, combine sales data from your CRM with helpdesk data to create a "Sales vs. Tickets Raised" report.

Visualization software with data blending

Bring your data to life with AI data visualization

Zoho Analytics makes it easy to create stunning visualizations with the power of advanced AI capabilities

Ask Zia

Converse with Zia, our AI copilot, in plain language, and let Zia transform your query into actionable, insightful visualizations.

Zia Suggestions

Zia intelligently suggests contextual visualizations tailored to the data you’re exploring.

Auto-generation of reports & dashboards

Zia automatically creates professional-grade reports and dashboards from your data in just a few seconds.

Key features of our data visualization software

Here are some of the best features that you can access to create meaningful visualizations

Easy data integration

Connect, import, and integrate your data from spreadsheets to cloud databases.

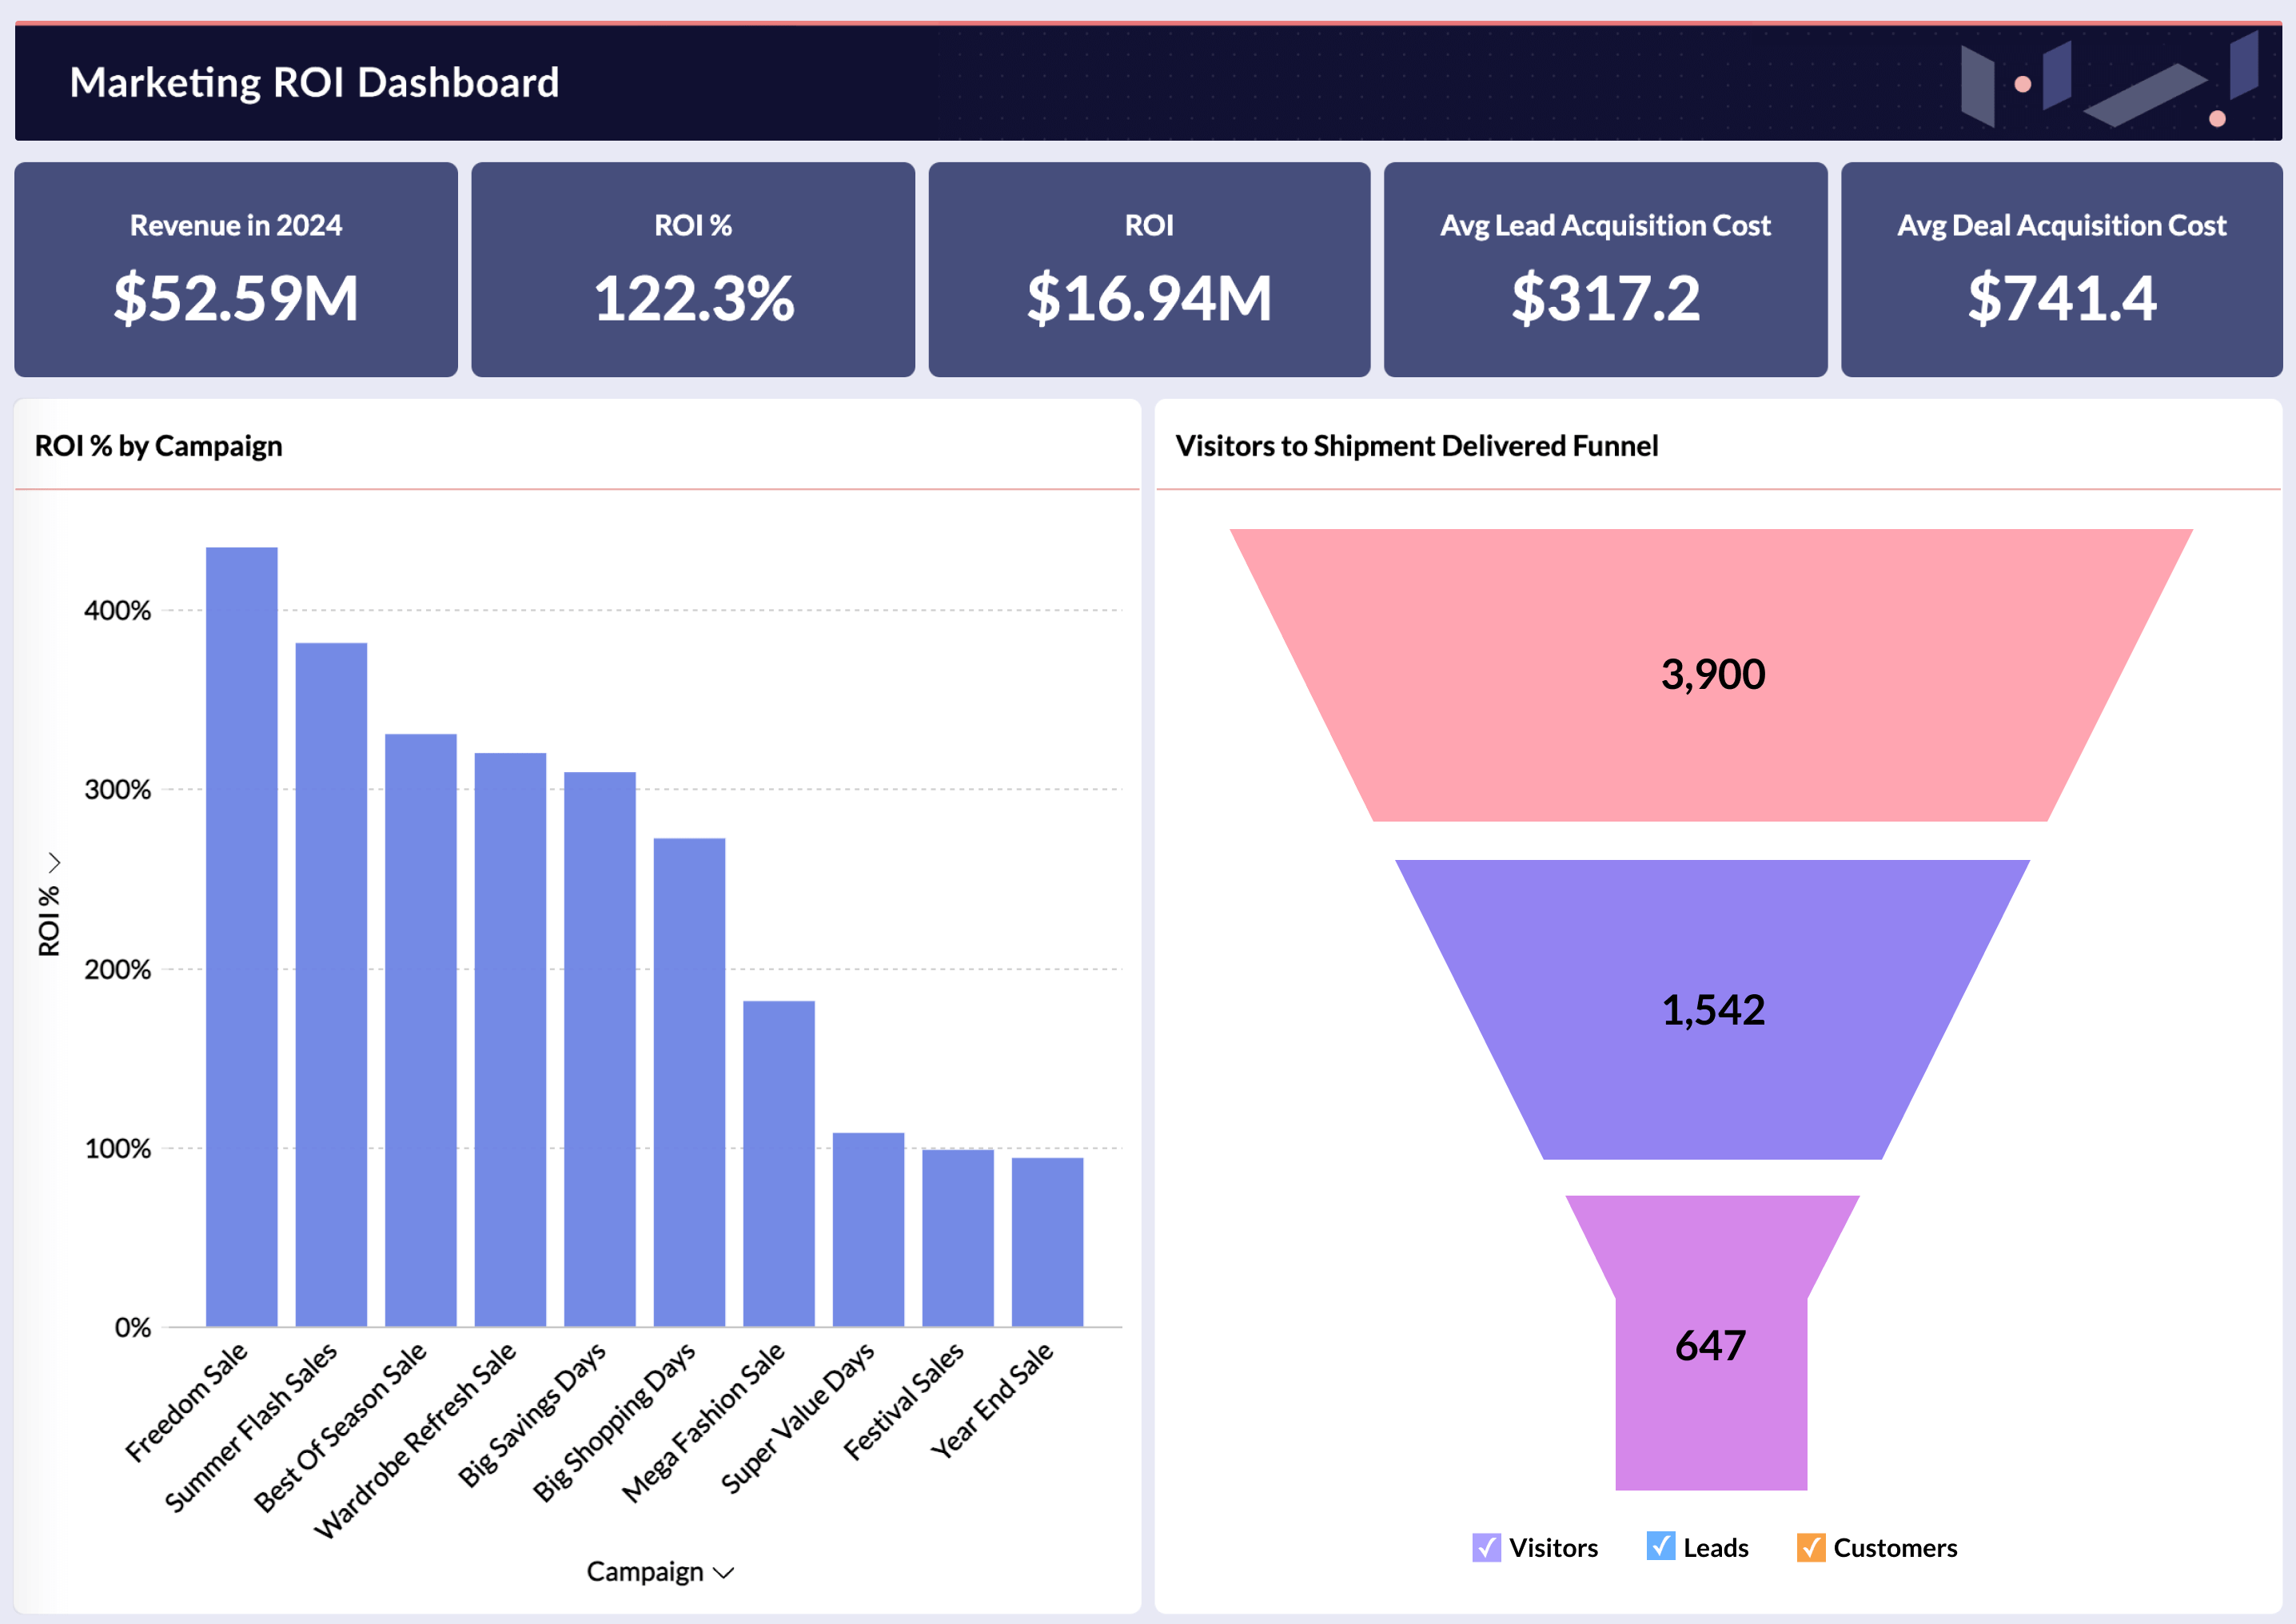
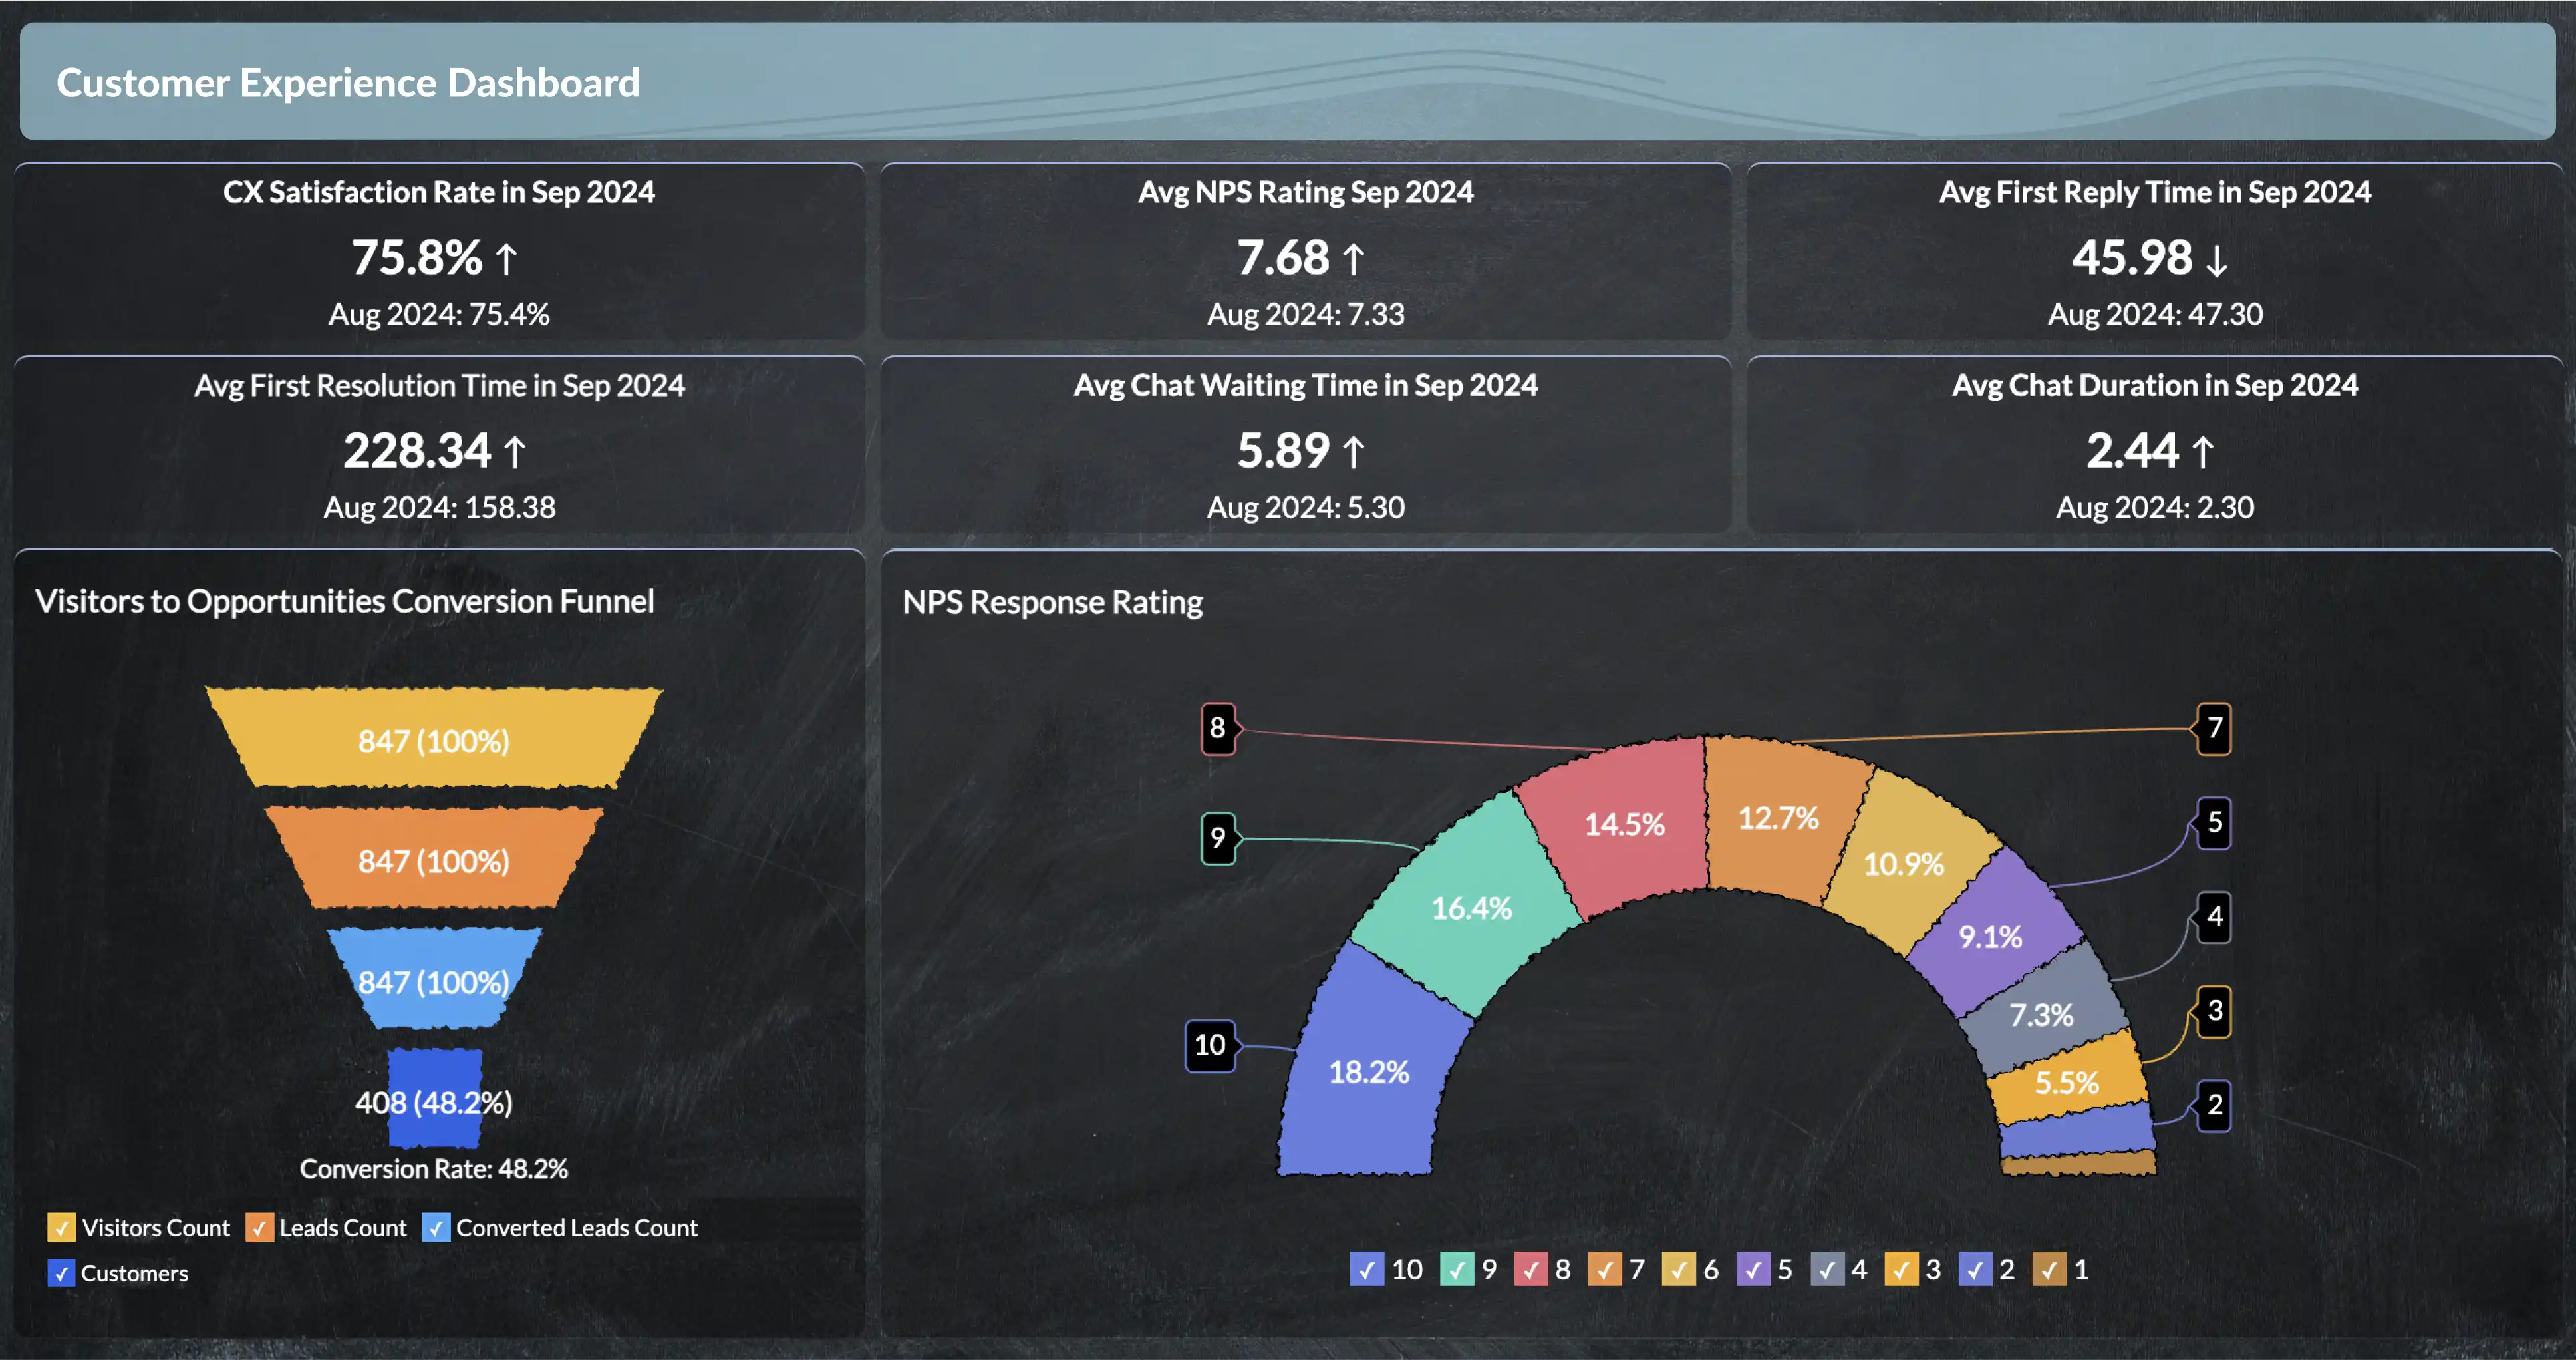
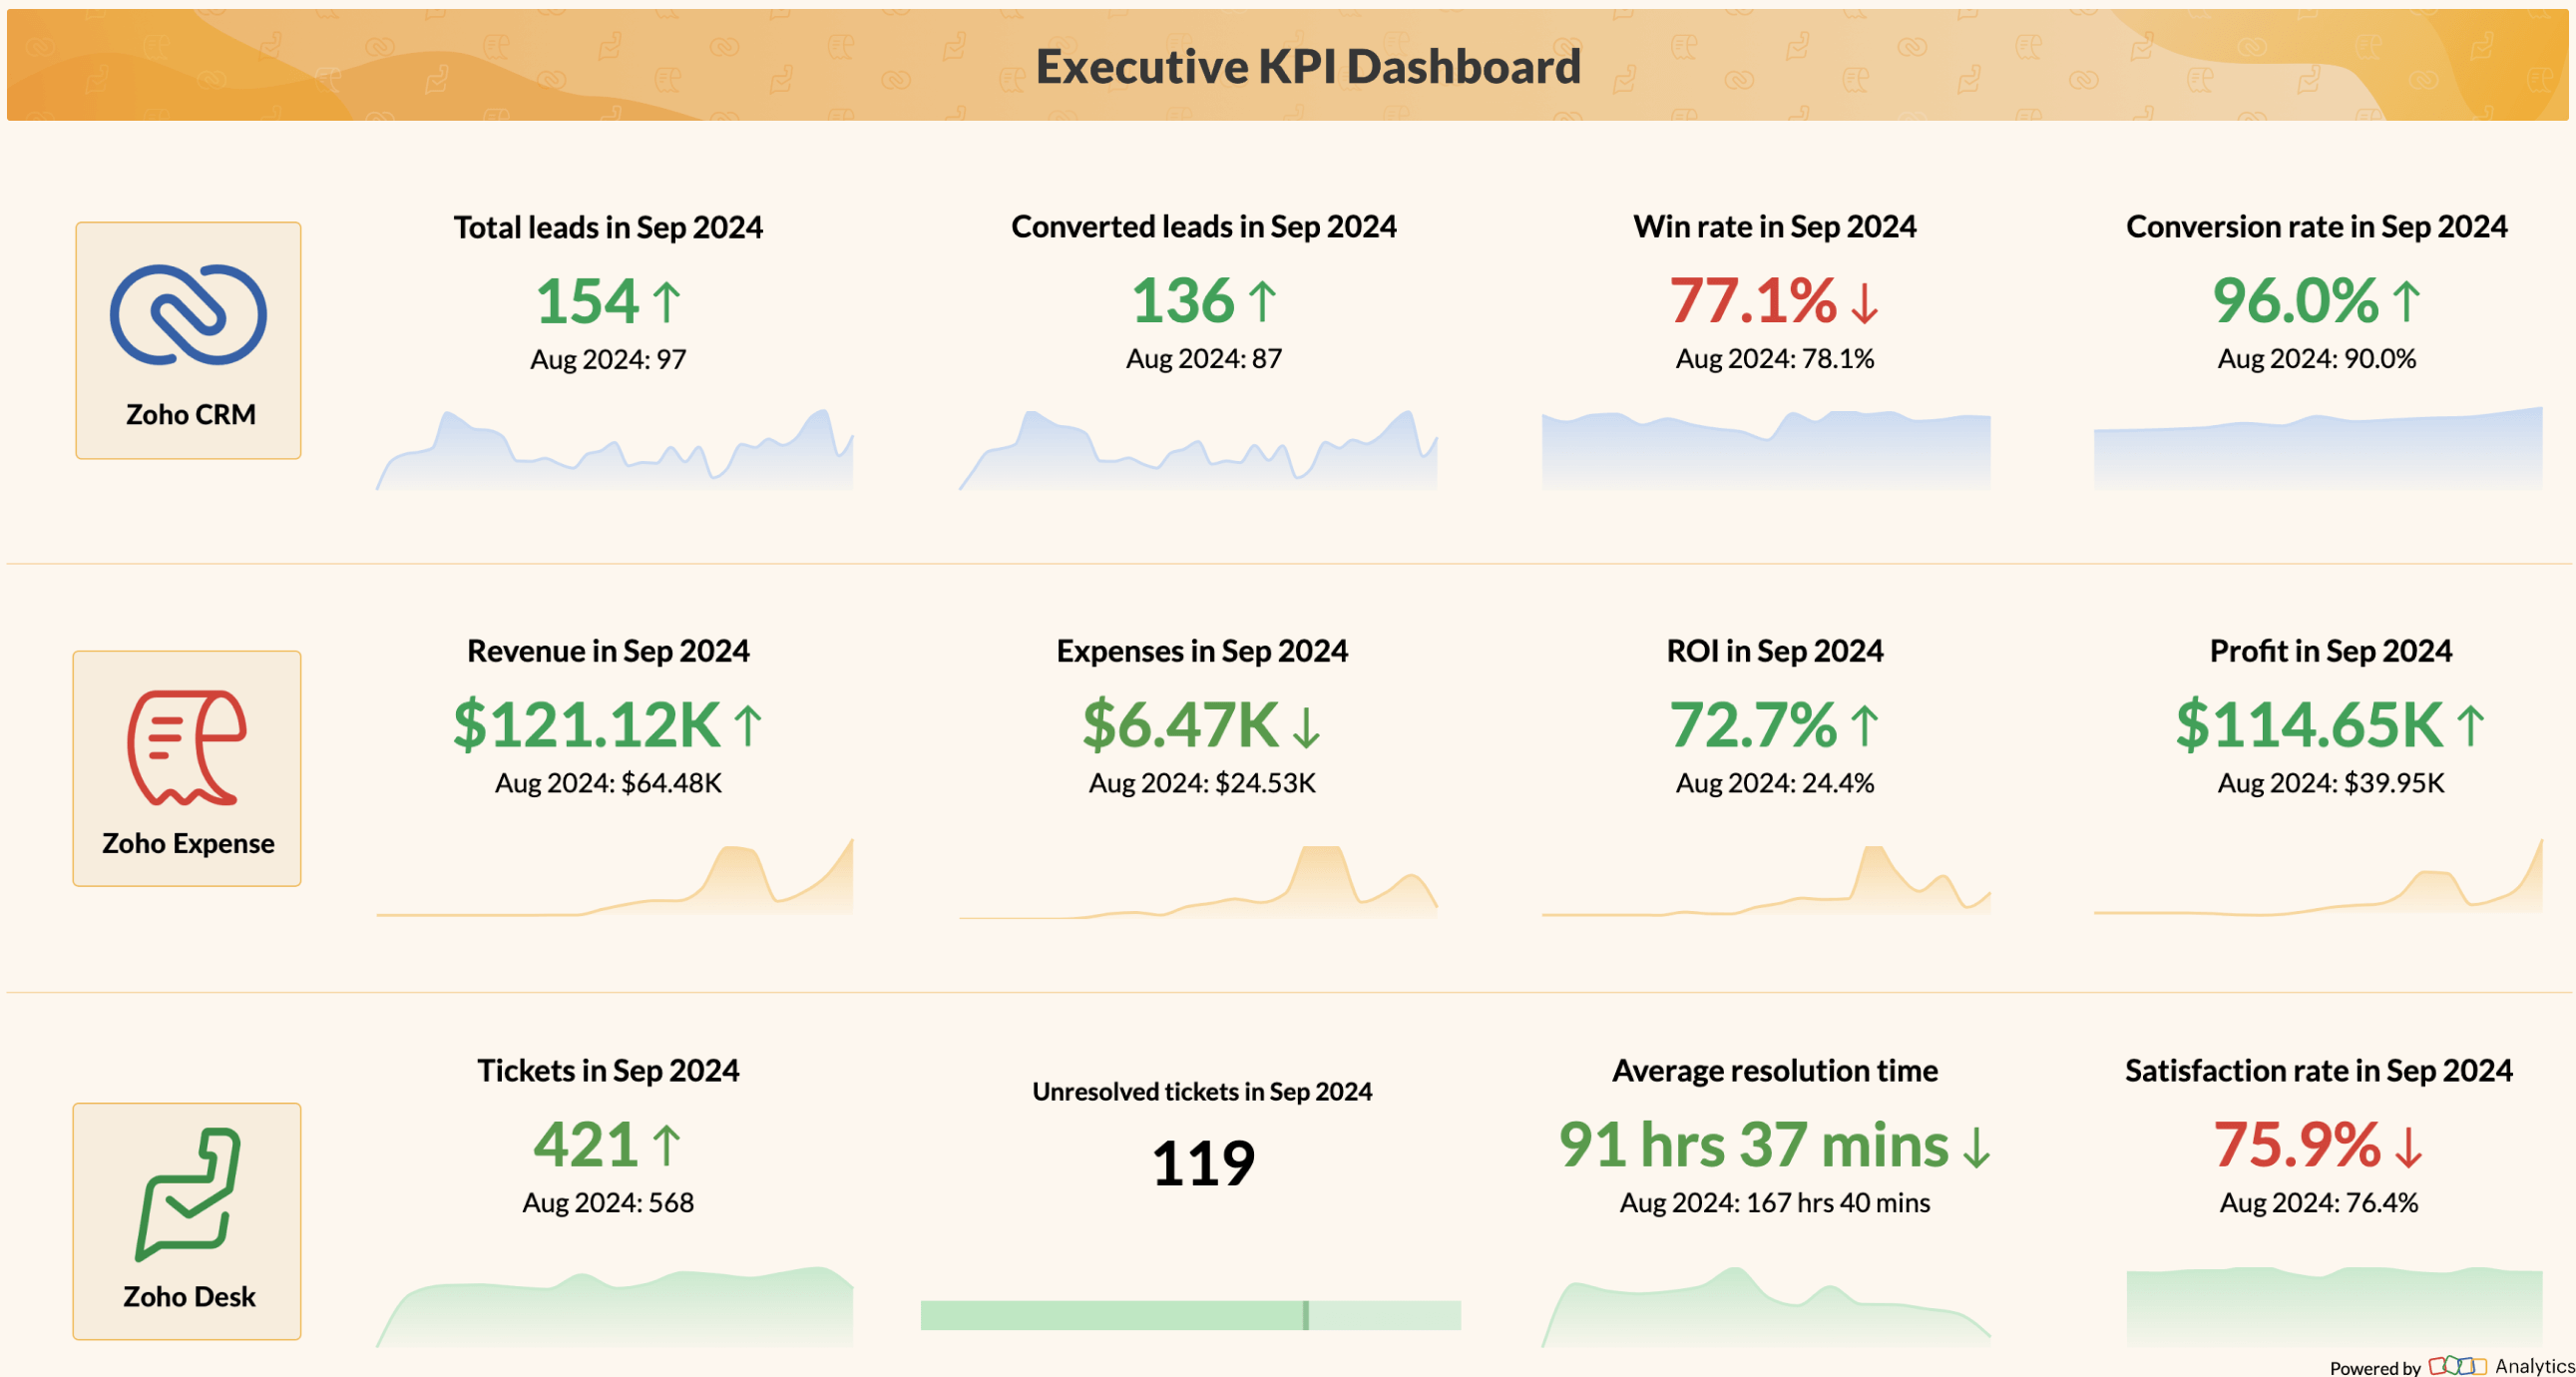
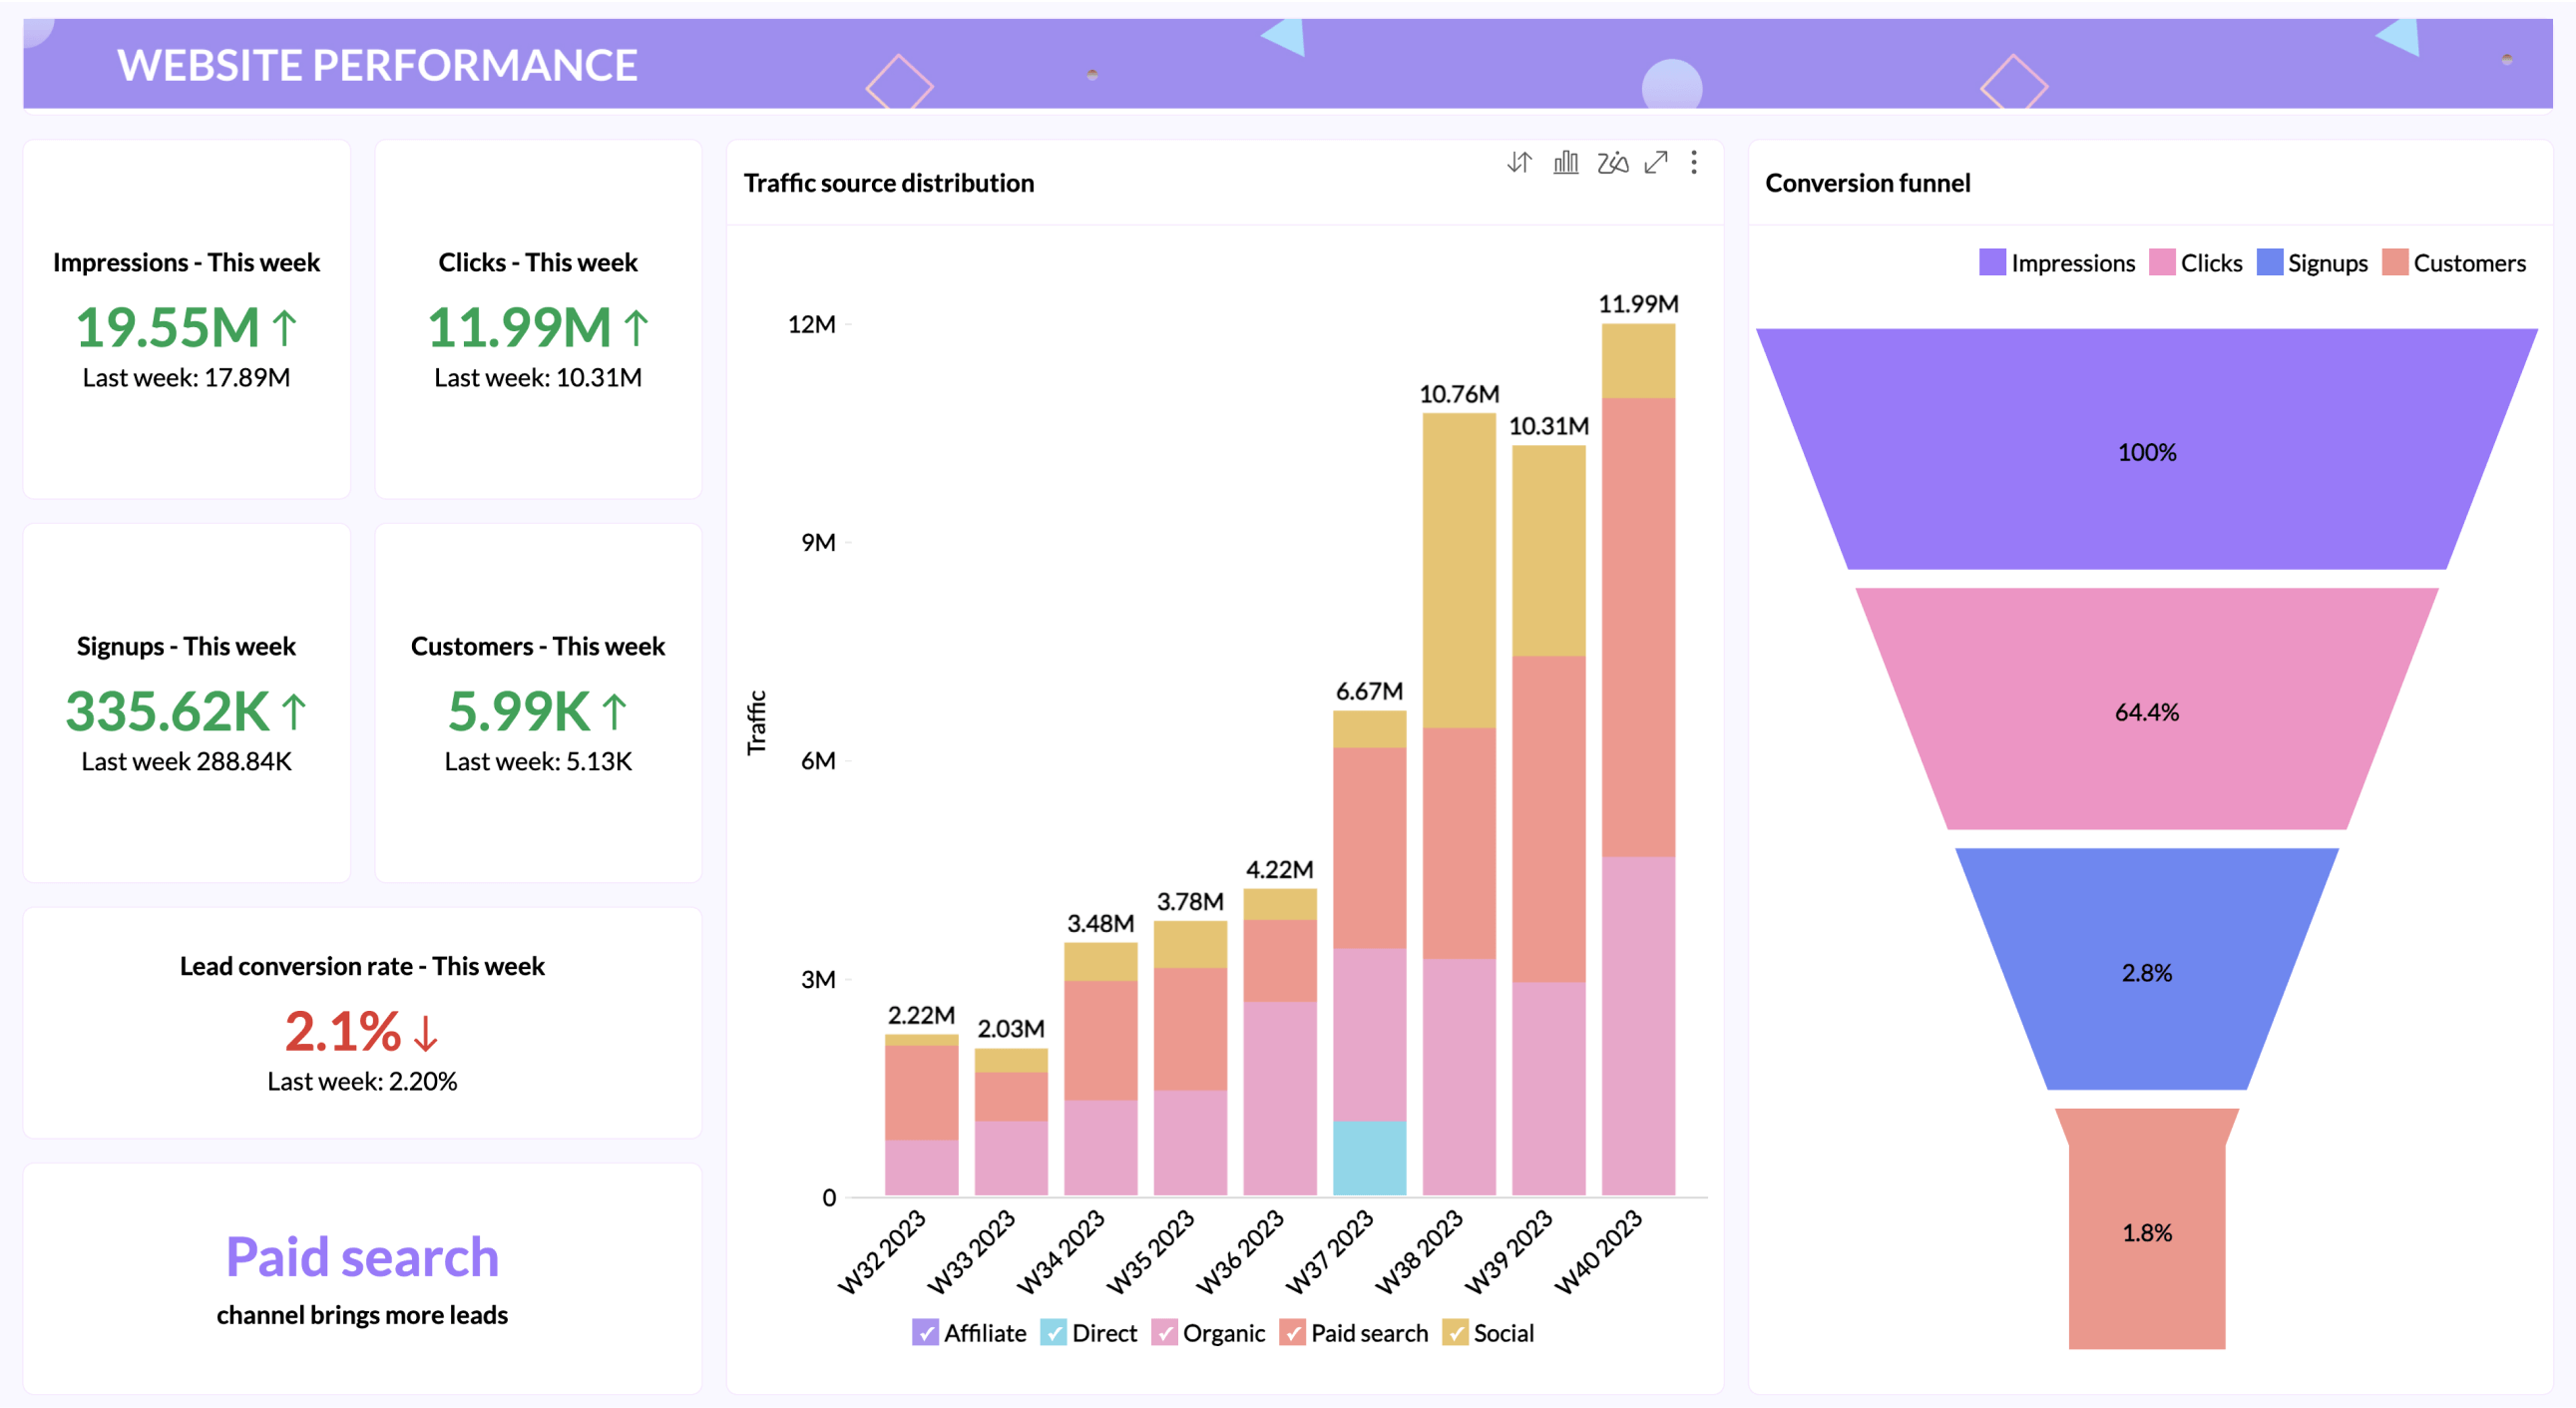
Intuitive visualization builder

Create stunning reports with drag-and-drop simplicity. Build charts and dashboards that speak volumes.

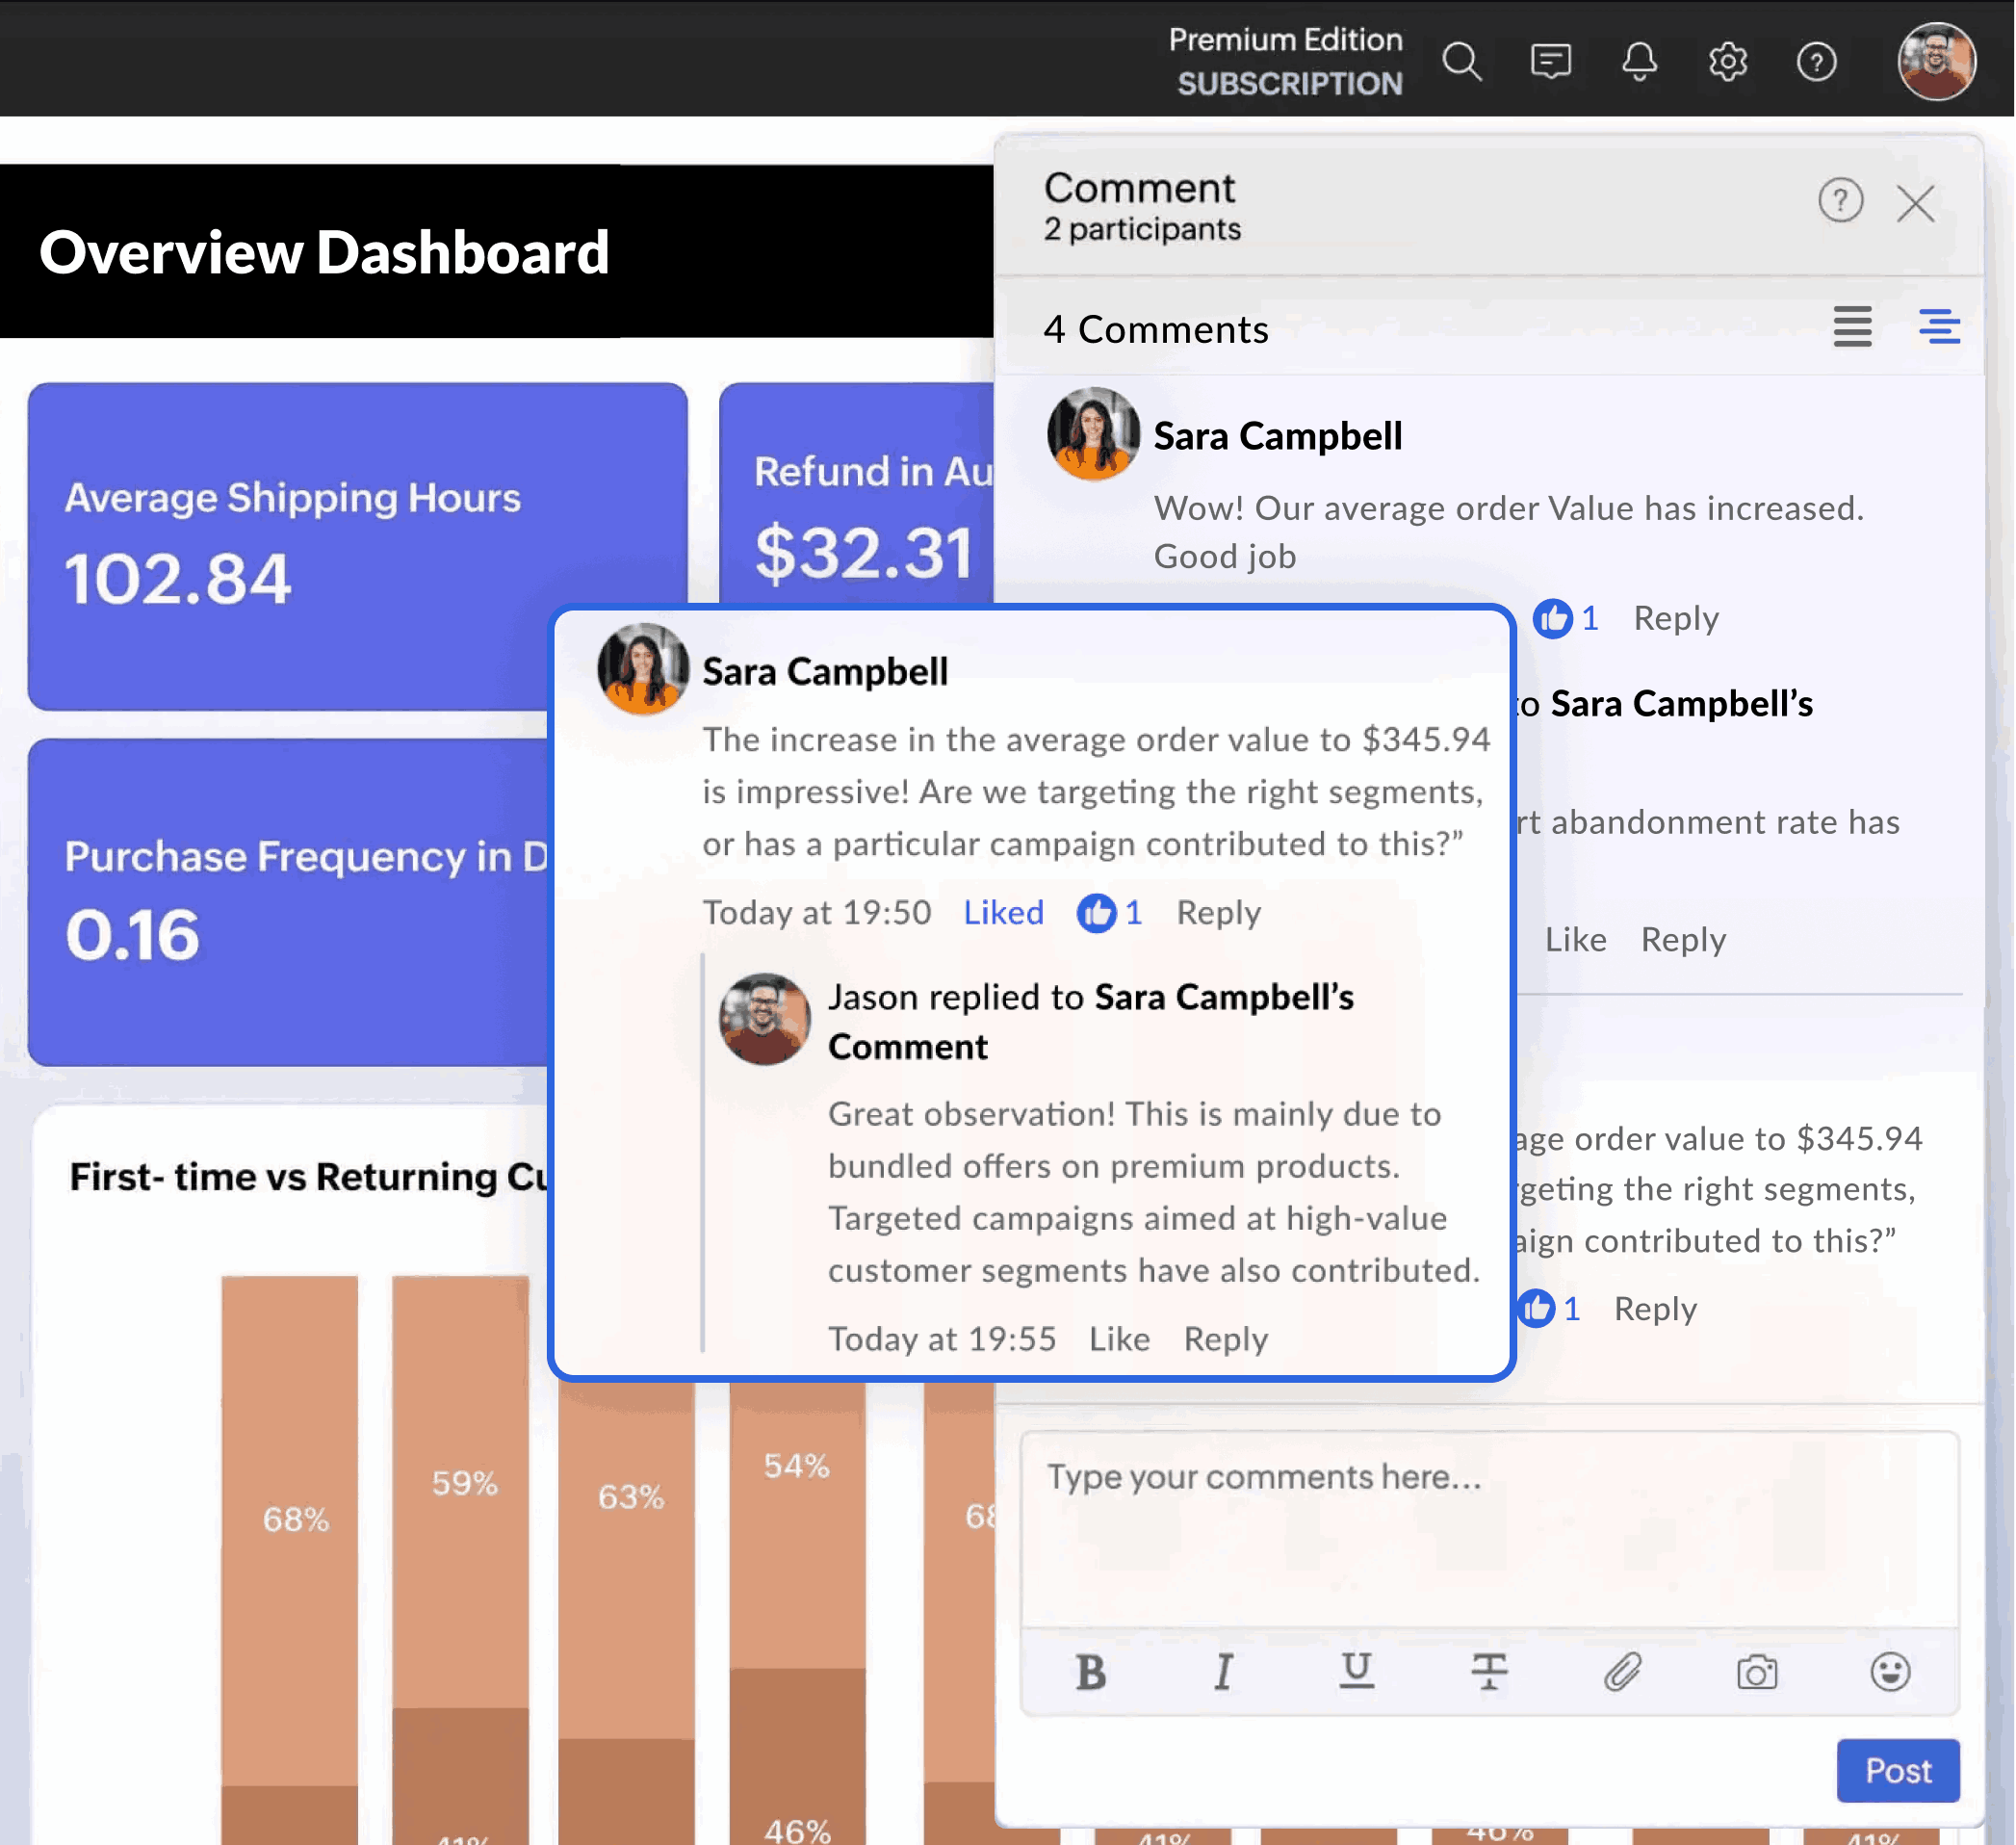
Secure collaboration

Work together without compromise. Share insights securely across teams with fine-grained permission controls.

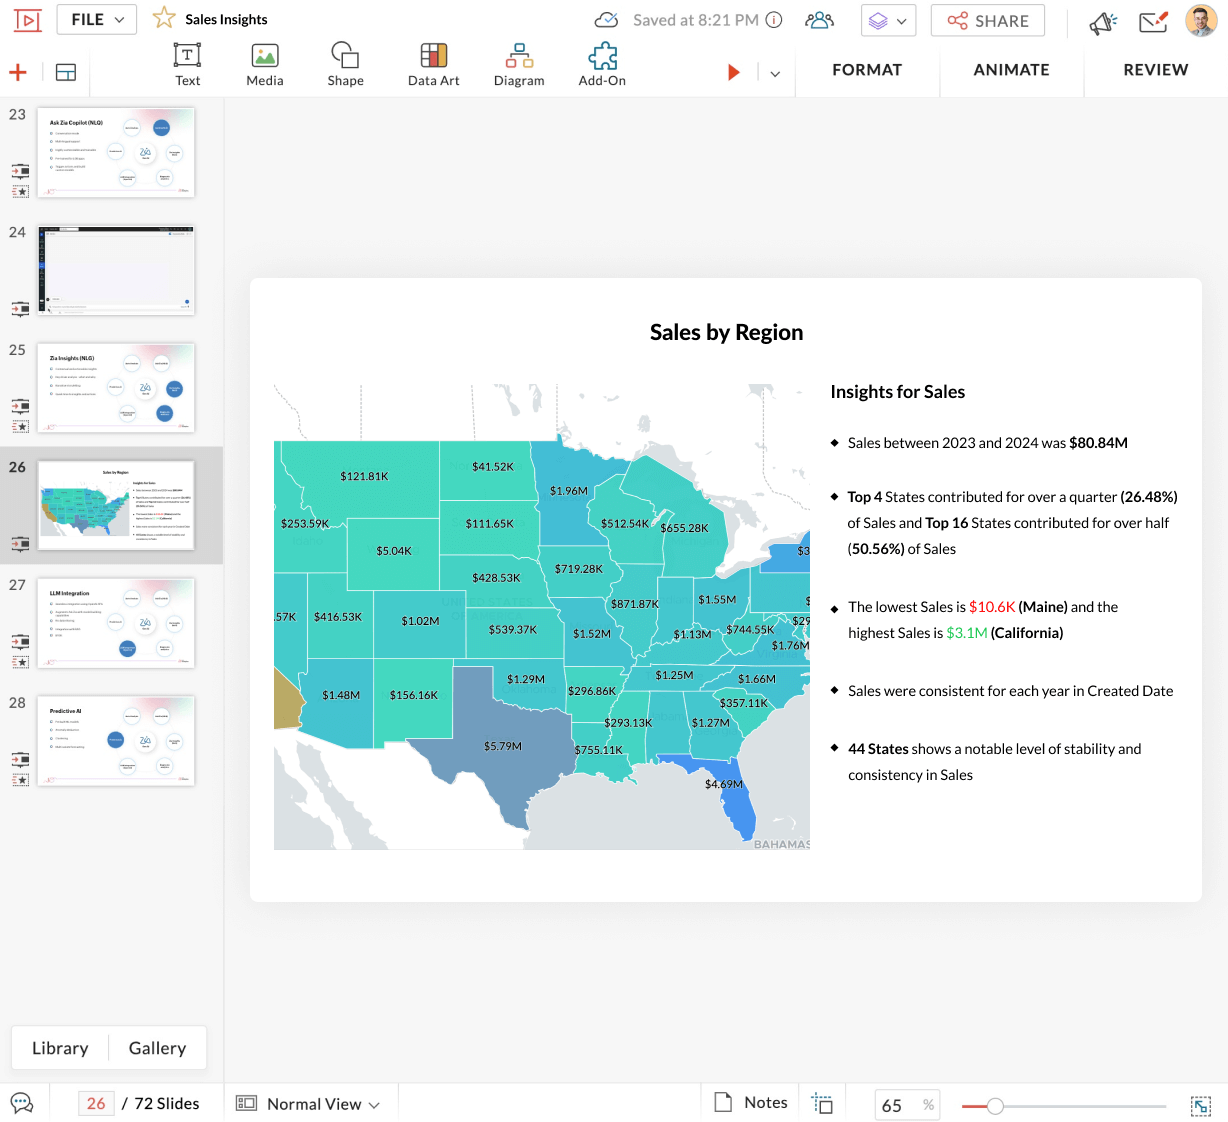
Automated slideshow generation

Turn data into presentations instantly. Automated slideshows let you focus on insights, not creating presentations from scratch.

Embedding and publishing options

Share your story anywhere. Embed interactive dashboards and reports or publish them online with just a click.

AI capabilities

Uncover patterns, generate predictions, and gain deeper insights faster than ever with advanced AI capabilities.

Best Data visualization software
webiste performance

Hear from our happy customers

See all testimonials
profile
Connor Nobert
Director of Analytics and Technology, Pulse LLC

"Zoho Analytics gives us a superior edge over Power BI and Tableau, when it comes to the aesthetics of visualization. ‌We're very happy with Zoho’s capability."

profile
Steve Dubane
Founder & CEO, Wingman Media

"Zoho Analytics created a tremendous amount of value for the agency and takes our relationship with clients to the next level. The preparedness to integrate the data, build alluring visualizations, and its shrewdness have given us the ability to retain clients.

profile
Korvi Rakshand
Founder, JAAGO Foundation

"Our main intent was to make data-driven decisions. We use Zoho CRM and Zoho Books and we wanted to precisely analyze every single data point from these apps. So we fell back on Zoho Analytics. The visualization with data precision is impeccable and we are extremely happy with the Zoho suite of products."

profile
ED Levis
Head of IT, NYC Navigator

"Data visualization is important for any BI tool. It's great to present data in a way that is meaningful to the audience, helping them quickly grasp the content. That’s where Zoho Analytics is very strong. We now analyze our sales, operations, and finance using Zoho Analytics."

profile
Daniel Franey
Director & Shareholder, Courier logistics limited

"With Zoho Analytics, the ability to visualize things became easy. Most of my managers now use Zoho dashboards and quickly create reports themselves. Its usability features, like easy drag and drop filters and drill down options, are top-notch."

profile
Ben Smith
Advisor and former COO of Sugarfina

"Zoho Analytics is the only product with the right mix of cost and value—with features like data visualization, integration, data blending, collaboration, user filters, drag and drop, geomaps, and much more at an affordable price"

profile
Maurizio Pisana
IT Manager, Caffe Moak

“Zoho Analytics—being fast, simple, yet compelling BI software—made our lives easier for importing, integrating, and analyzing data. Visualization is another plus in this product, and dashboards are very appealing"

profile
Connor Nobert
Director of Analytics and Technology, Pulse LLC

"Zoho Analytics gives us a superior edge over Power BI and Tableau, when it comes to the aesthetics of visualization. ‌We're very happy with Zoho’s capability."

profile
Steve Dubane
Founder & CEO, Wingman Media

"Zoho Analytics created a tremendous amount of value for the agency and takes our relationship with clients to the next level. The preparedness to integrate the data, build alluring visualizations, and its shrewdness have given us the ability to retain clients.

profile
Korvi Rakshand
Founder, JAAGO Foundation

"Our main intent was to make data-driven decisions. We use Zoho CRM and Zoho Books and we wanted to precisely analyze every single data point from these apps. So we fell back on Zoho Analytics. The visualization with data precision is impeccable and we are extremely happy with the Zoho suite of products."

profile
ED Levis
Head of IT, NYC Navigator

"Data visualization is important for any BI tool. It's great to present data in a way that is meaningful to the audience, helping them quickly grasp the content. That’s where Zoho Analytics is very strong. We now analyze our sales, operations, and finance using Zoho Analytics."

profile
Daniel Franey
Director & Shareholder, Courier logistics limited

"With Zoho Analytics, the ability to visualize things became easy. Most of my managers now use Zoho dashboards and quickly create reports themselves. Its usability features, like easy drag and drop filters and drill down options, are top-notch."

profile
Ben Smith
Advisor and former COO of Sugarfina

"Zoho Analytics is the only product with the right mix of cost and value—with features like data visualization, integration, data blending, collaboration, user filters, drag and drop, geomaps, and much more at an affordable price"

profile
Maurizio Pisana
IT Manager, Caffe Moak

“Zoho Analytics—being fast, simple, yet compelling BI software—made our lives easier for importing, integrating, and analyzing data. Visualization is another plus in this product, and dashboards are very appealing"

Visualize raw data with our data visualization platform

Sign up for freeSIGN UP FOR FREE

Frequently asked questions

What are the top data visualization tools in 2025?

  • In 2025, the leading data visualization tools are Zoho Analytics, Tableau, and Microsoft Power BI.
    • Zoho Analytics stands out with its AI-powered assistant, drag-and-drop interface, and extensive pre-built visualization options. It integrates seamlessly with over 500 data sources and offers advanced analytics, making it a comprehensive solution for businesses of all sizes.
    • Tableau remains one of the favorites due to its robust dashboarding capabilities, though it often requires more technical expertise.
    • Microsoft Power BI continues to be popular for users within the Microsoft ecosystem.
  • Zoho Analytics offers a strong balance of ease of use, advanced features, and affordability, making it one of the top data visualization tools in 2025.

What are the AI-powered features available in Zoho Analytics for creating visualizations?

  • Zoho Analytics is one of the top AI data visualization tools and leverages AI through its Zia, enhancing the data visualization experience in several ways:
    • Conversational analytics: Ask Zia questions in natural language and get instant reports and dashboards.
    • Automated insights: Zia automatically surfaces trends, outliers, and key insights from your data.
    • Smart recommendations: Based on your data and usage patterns, Zia suggests relevant charts and KPIs.
    • Forecasting & what-if analysis: Predict trends and run simulations using built-in AI models.
  • These features help users create insightful visualizations faster and more intuitively, regardless of technical background.

Does Zoho Analytics offer the most user-friendly interface in 2025?

  • Yes, Zoho Analytics is rated among the most user-friendly data visualization tools in 2025. It features a clean UI, drag-and-drop report creation, and an intuitive layout that allows users to create meaningful dashboards without a steep learning curve.

Does Zoho Analytics data visualization software offer the most mapping features?

  • Zoho Analytics offers a wide range of mapping features, including:
    • Geo maps at country, state, and city levels
    • Custom region maps
    • Heat maps, bubble maps, and pin maps
  • While some competitors offer niche geographic tools, Zoho Analytics strikes an excellent balance between mapping depth and usability.

What is data visualization?

  • Data visualization is a process of representing data visually using elements like charts, graphs, and maps. Data visualization helps individuals to understand patterns, trends, and insights, which may not be apparent from raw data. It is a key component in the data analysis process, which helps make complex data more accessible and understandable for decision-making.

What are data visualization tools?

  • Data visualization tools are software apps that help users create visual elements of data like charts, graphs, and maps. Most modern data visualization tools like Zoho Analytics offer features like a drag-and-drop interface, customization options, and real-time data integration.

What are the types of data visualization charts available in Zoho Analytics?

  • Zoho Analytics offers more than 50 data visualization types to cater to different analytical needs. Some of the key chart types available include:
    • Pie charts
    • Line charts
    • Bar charts
    • Stacked charts
    • Combo charts
    • Scattered charts
    • Bubble charts
    • Treemap
    • Sankey charts
    • Sunburst charts
    • Area charts
    • Map charts

Is there a free data visualization tool available?

  • Yes, Zoho Analytics offers a free data visualization tool version that allows users to create a variety of data visualizations, such as charts and dashboards.
 

Start your 15-day free trial.

No credit card required