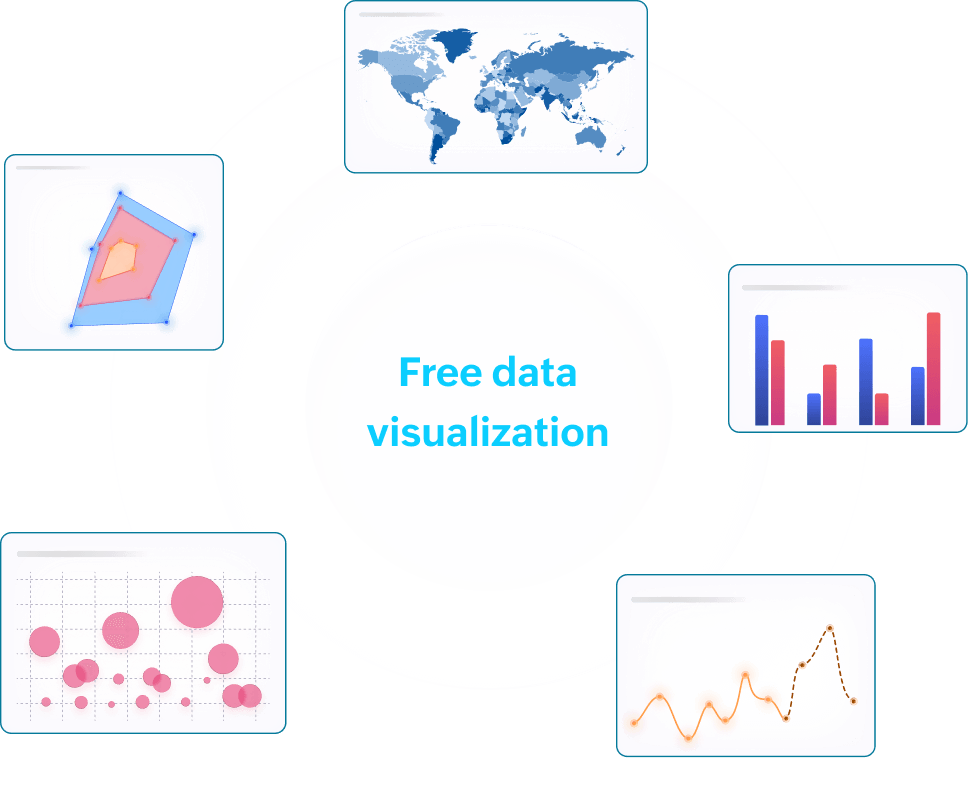
Free Data Visualization Software
All businesses have data, but not the budget or the team to make sense of it. Zoho Analytics gives you completely free data visualization software to transform raw numbers into clear charts, reports, and dashboards without writing a single line of code.
Sign up for free
- 16K
Customers
- 3M
Users
Why adopt data visualization software for free?
Free data visualization tools help you make sense of complex information by turning raw data into clear, interactive charts and reports. Instead of struggling with spreadsheets and numbers, you can spot trends, patterns, and insights at a glance.
With Zoho Analytics as your data visualization software, you can easily generate reports, create dynamic dashboards, and communicate data-driven insights.
How to visualize data for free in 3 steps ?
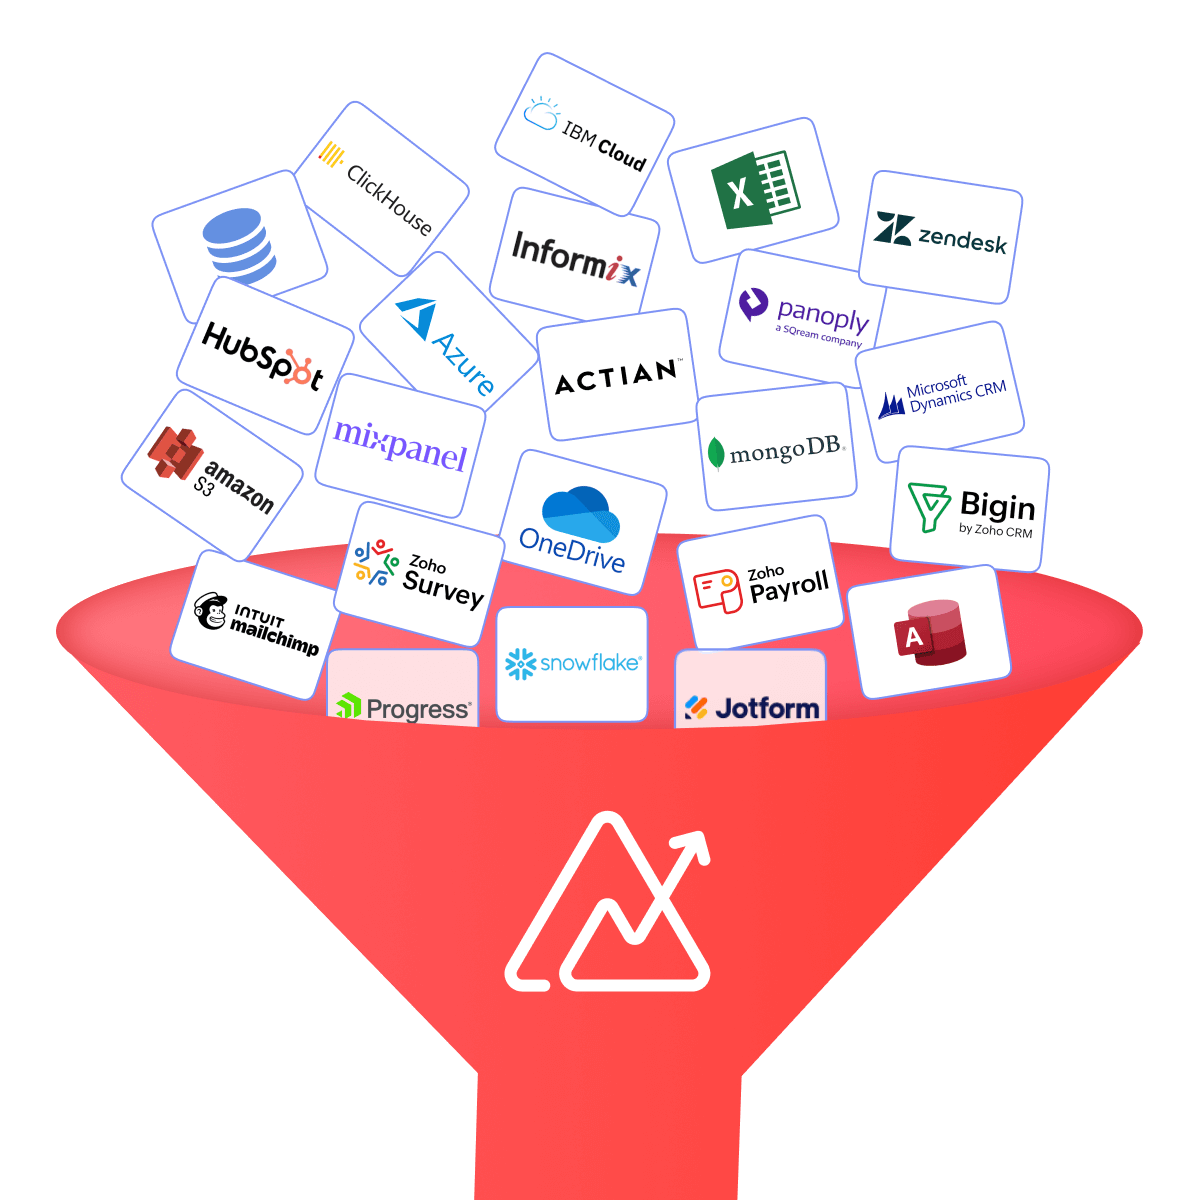
Step 1: Bring your data
Import data from spreadsheets, CSV files, cloud drives, databases, or data warehouses, and schedule automatic daily syncs so your reports always reflect the latest numbers. Your data is ready to work with in minutes.
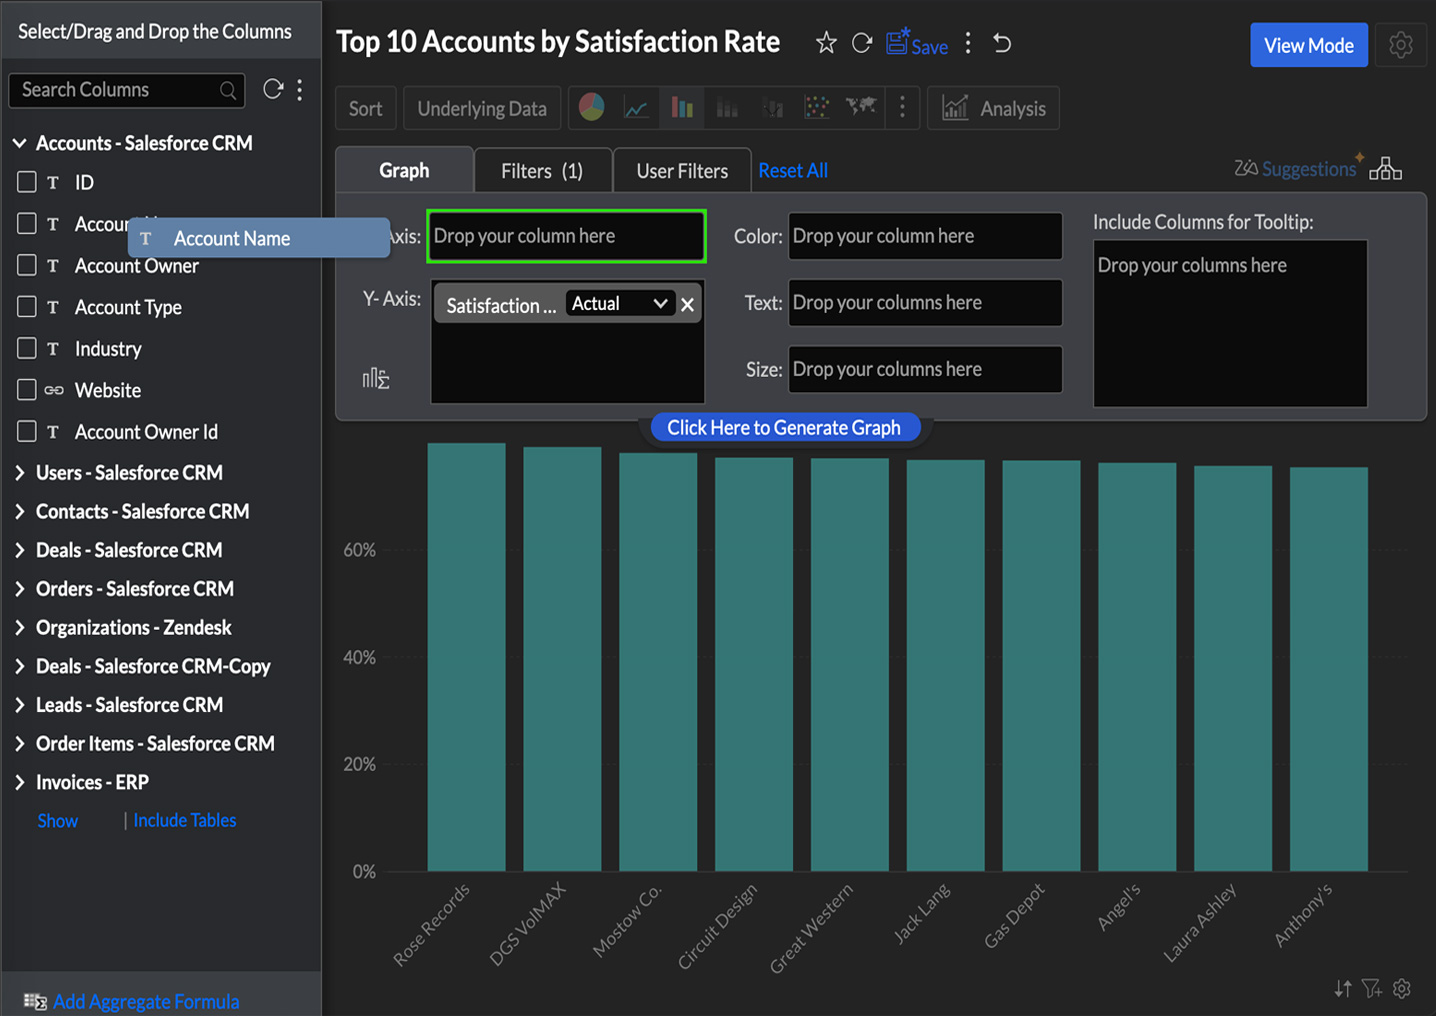
Step 2: Visualize your data
Turn raw data into unlimited reports and interactive data visualization dashboards using a simple drag-and-drop builder. With 50+ chart types, from bar charts and pie charts to geo maps and funnel views, you can build the exact visual your audience needs, without writing a single line of code.
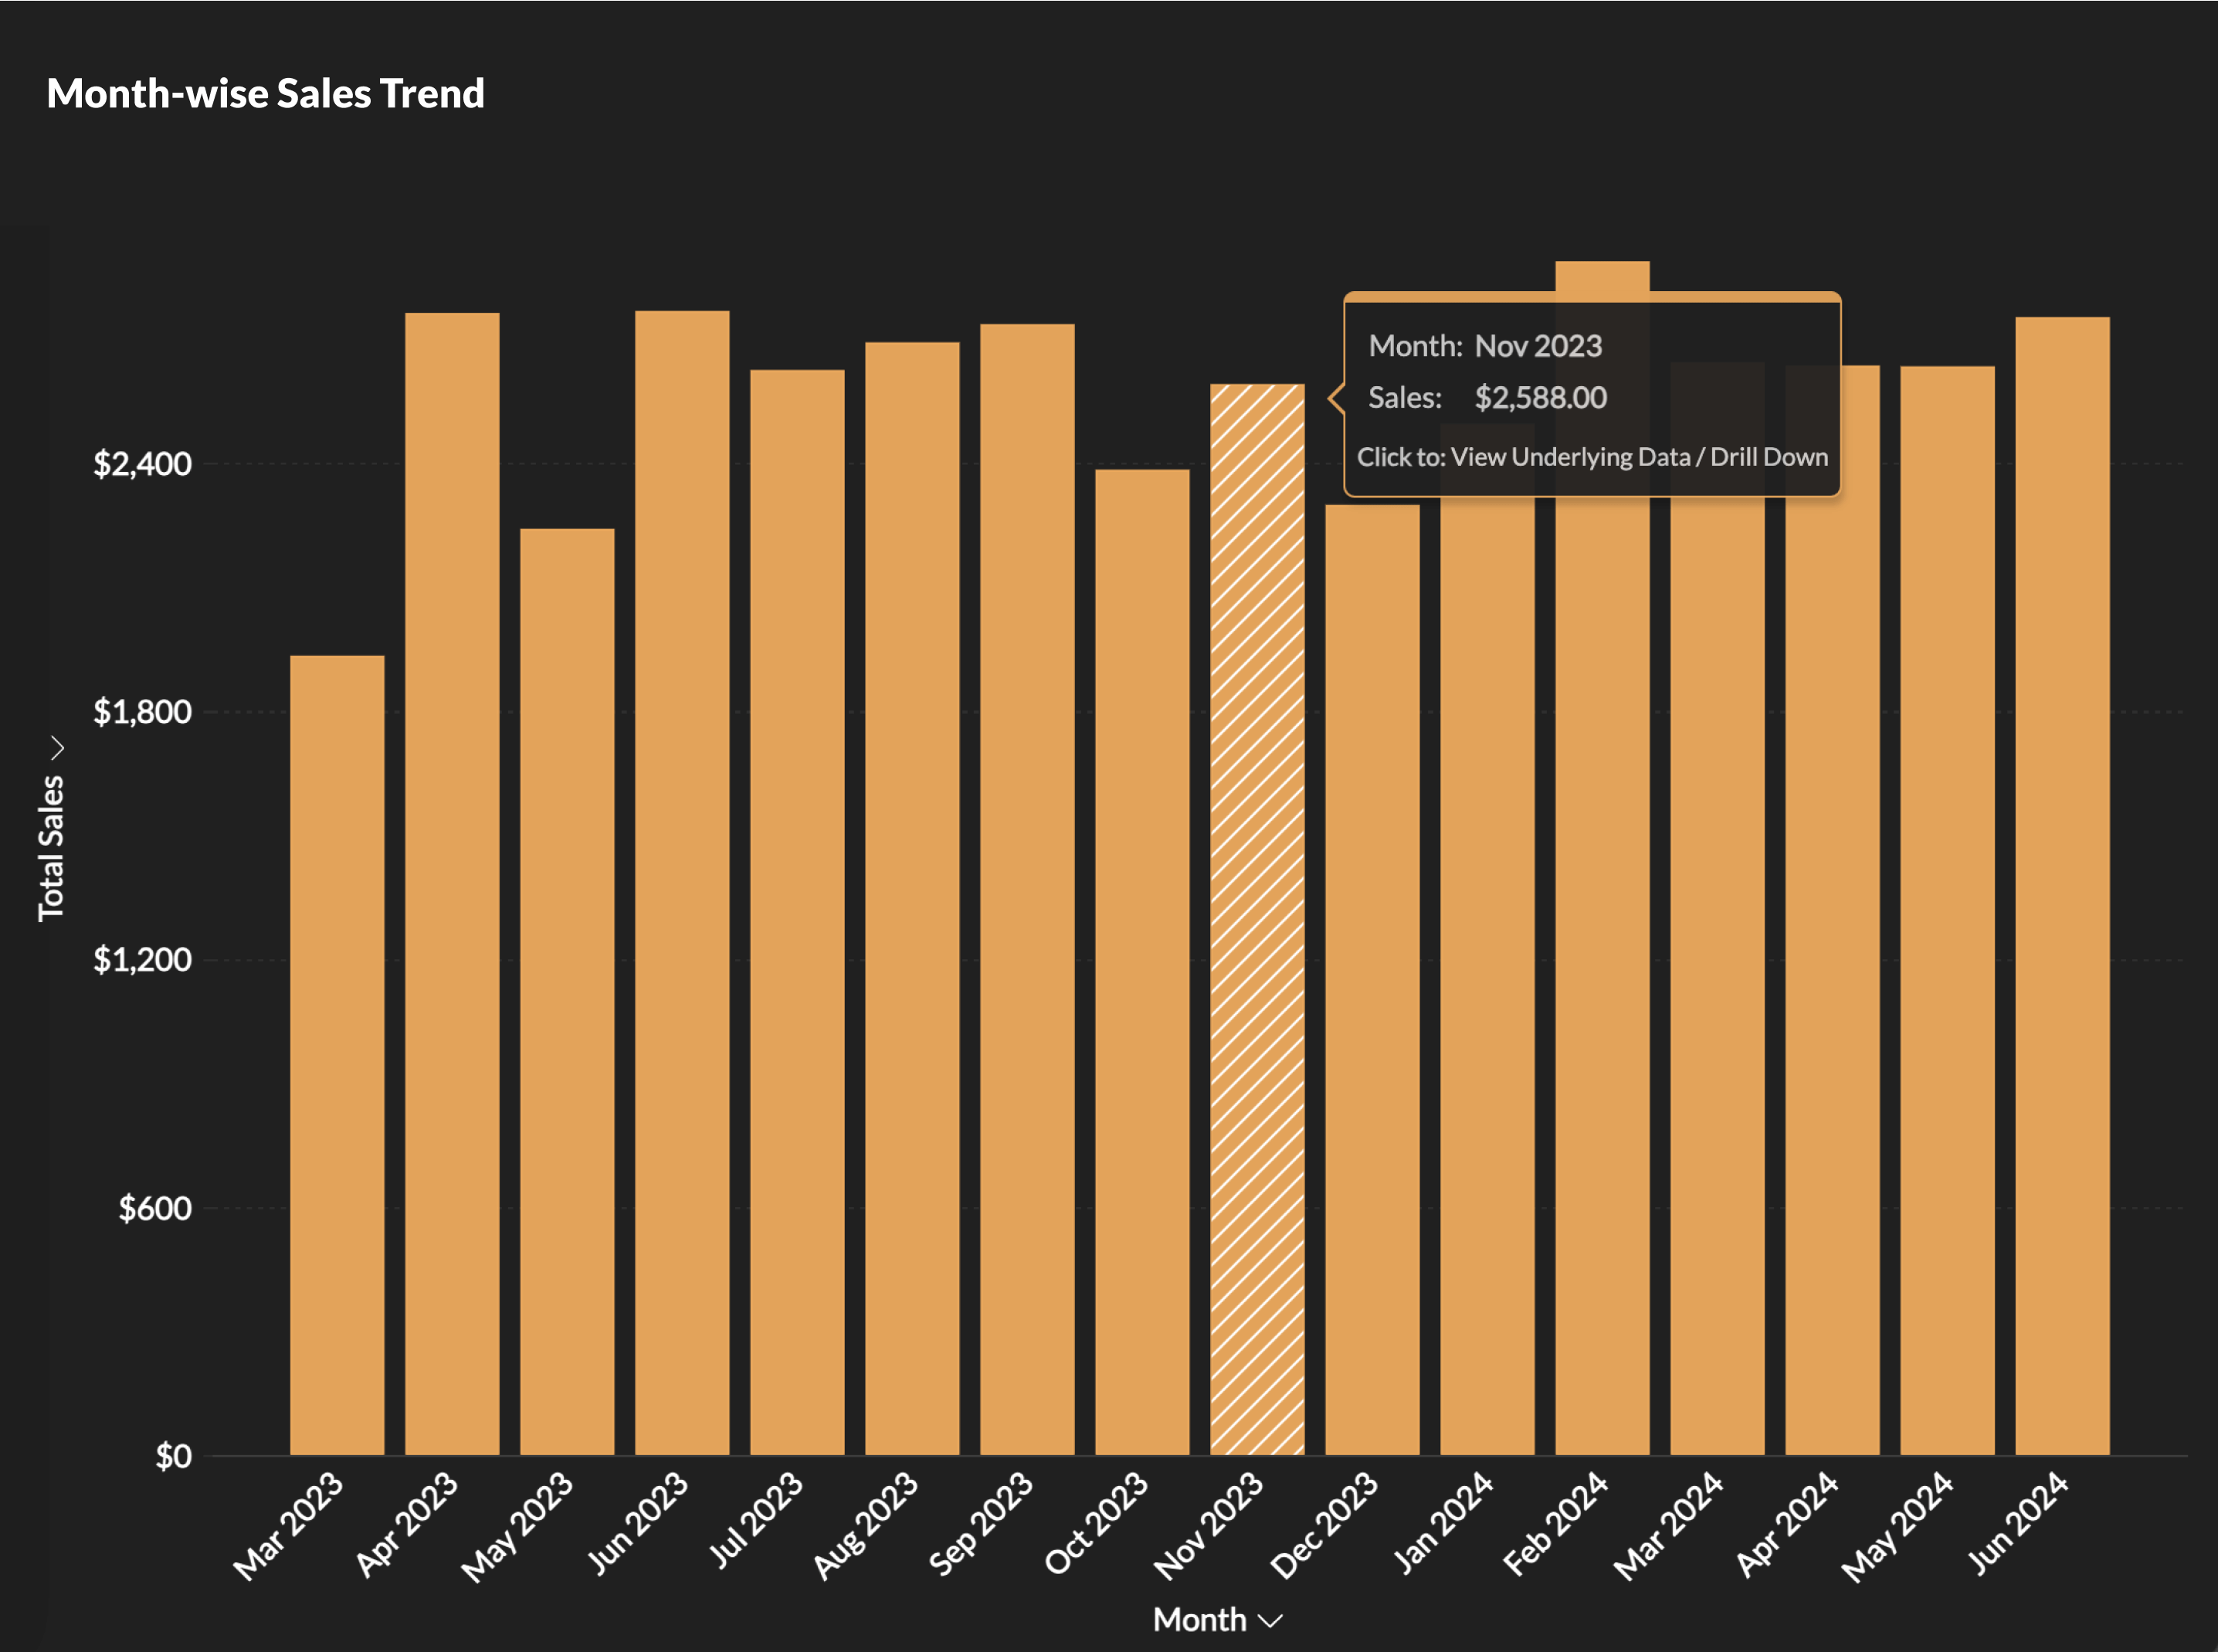
Step 3: Analyze and extract key insights
Spot trends before they become obvious. The free plan includes auto analysis, predictive analytics, what-if analysis, trend analysis, and anomaly detection, so you can go from raw numbers to confident decisions without needing a data analyst on your team.
Best 4 free data visualization tools

Zoho Analytics is data visualization software that gives you 50+ data visualization types: bar, line, pie, scatter, bubble, funnel, geo map, heat map, word cloud, histogram, Sankey, treemap, and more. The drag-and-drop report builder doesn't require any technical setup. You pick your data, pick your chart, and start reading your numbers.
On the data side, the free plan connects to spreadsheets, CSV files, cloud drives, relational databases, and data warehouses. You can schedule daily automatic syncs, so the dashboards reflect current numbers. Reports and data visualization dashboards are unlimited, private by default, and shareable with up to two collaborators. There are Android and iOS apps if you're checking things away from a desk.
The free plan also includes a layer of analytics that most tools reserve for paid tiers. Auto Analysis generates reports from your raw data without you having to configure anything. Predictive analytics shows you where a metric is headed, not just where it's been. What-if analysis lets you change a variable, say a pricing assumption or a cost input, and see how it moves the rest of your numbers. Trend analysis overlays trend lines across chart types so directional shifts become visible at a glance. Anomaly detection spots data points that fall outside normal patterns, the kind of thing that's easy to miss in a spreadsheet.
Two things worth knowing about the alternatives: Tableau Public makes every dashboard publicly visible, so private internal reporting isn't an option. Looker Studio's free tier works well if your data lives entirely in Google's ecosystem. Zoho Analytics doesn't have either of those restrictions on the free plan.

Power BI Desktop is a free data visualization tool offering rich charting, flexible data modeling, and interactive dashboards. It integrates seamlessly with Excel and other Microsoft products, making it a great choice for users already familiar with the Microsoft ecosystem. The free desktop version is powerful for personal analytics, allowing you to build reports, transform data, and analyze performance.

Tableau Public is a free platform designed to help users create visually compelling dashboards that can be published online. It offers advanced visualization options, smooth interactivity, and a robust community gallery for inspiration. Although dashboards created in Tableau Public are publicly accessible, it’s an excellent tool for students, analysts, journalists, and data enthusiasts who want to share interactive stories with the world.

Looker is a data visualization tool ideal for marketing, web analytics, and reporting needs. It connects natively with Google Analytics, Google Ads, BigQuery, and dozens of third-party sources. Looker Studio makes it easy to build dashboards with real-time updates, customizable visuals, and interactive filtering.
What you get with Zoho Analytics' free plan
For startups and small businesses looking to make better use of their data, Zoho Analytics’ free plan is the perfect solution. Packed with advanced features, it reduces the time to insights at scale.
Easy Integration
Connect, import, and integrate data seamlessly, from spreadsheets to cloud databases.
Automatic data sync
Schedule daily data imports to keep your information up to date automatically.
Unlimited reports and dashboards
Create private reports and dashboards without any restrictions.
AI-powered advanced analytics
Gain deeper insights with AI features like predictive analytics, what-if analysis, auto-analysis, and anomaly detection.
Easy collaboration
Share and collaborate with team members, up to two users.
Mobile app
View and manage reports and dashboards on the go with dedicated mobile apps for Android and iOS.

With Zoho Analytics' free data visualization software

Your analysts get...
- Interactive charts & graphs
- Automated data updates
- Customizable dashboards
- Easy-to-share reports
- AI-powered insights
Your managers get...
- Performance tracking & KPIs
- Automated reporting
- Trend analysis & forecasting
- Data-driven decision-making
- Seamless team collaboration
Your business becomes...
- More efficient
- Impactful
- Collaborative
- Scalable
- Data-driven
Hear from our happy customers
See all testimonials
Connor Nobert
Director of Analytics and Technology, Pulse LLC"Zoho Analytics gives us a superior edge over Power BI and Tableau, when it comes to the aesthetics of visualization. We're very happy with Zoho’s capability."

Steve Dubane
Founder & CEO, Wingman Media"Zoho Analytics created a tremendous amount of value for the agency and takes our relationship with clients to the next level. The preparedness to integrate the data, build alluring visualizations, and its shrewdness have given us the ability to retain clients.

Korvi Rakshand
Founder, JAAGO Foundation"Our main intent was to make data-driven decisions. We use Zoho CRM and Zoho Books and we wanted to precisely analyze every single data point from these apps. So we fell back on Zoho Analytics. The visualization with data precision is impeccable and we are extremely happy with the Zoho suite of products."

ED Levis
Head of IT, NYC Navigator"Data visualization is important for any BI tool. It's great to present data in a way that is meaningful to the audience, helping them quickly grasp the content. That’s where Zoho Analytics is very strong. We now analyze our sales, operations, and finance using Zoho Analytics."

Daniel Franey
Director & Shareholder, Courier logistics limited"With Zoho Analytics, the ability to visualize things became easy. Most of my managers now use Zoho dashboards and quickly create reports themselves. Its usability features, like easy drag and drop filters and drill down options, are top-notch."
Ben Smith
Advisor and former COO of Sugarfina"Zoho Analytics is the only product with the right mix of cost and value—with features like data visualization, integration, data blending, collaboration, user filters, drag and drop, geomaps, and much more at an affordable price"
Maurizio Pisana
IT Manager, Caffe Moak“Zoho Analytics—being fast, simple, yet compelling BI software —made our lives easier for importing, integrating, and analyzing data. Visualization is another plus in this product, and dashboards are very appealing"
Connor Nobert
Director of Analytics and Technology, Pulse LLC"Zoho Analytics gives us a superior edge over Power BI and Tableau, when it comes to the aesthetics of visualization. We're very happy with Zoho’s capability."
Steve Dubane
Founder & CEO, Wingman Media"Zoho Analytics created a tremendous amount of value for the agency and takes our relationship with clients to the next level. The preparedness to integrate the data, build alluring visualizations, and its shrewdness have given us the ability to retain clients.
Korvi Rakshand
Founder, JAAGO Foundation"Our main intent was to make data-driven decisions. We use Zoho CRM and Zoho Books and we wanted to precisely analyze every single data point from these apps. So we fell back on Zoho Analytics. The visualization with data precision is impeccable and we are extremely happy with the Zoho suite of products."
ED Levis
Head of IT, NYC Navigator"Data visualization is important for any BI tool. It's great to present data in a way that is meaningful to the audience, helping them quickly grasp the content. That’s where Zoho Analytics is very strong. We now analyze our sales, operations, and finance using Zoho Analytics."
Daniel Franey
Director & Shareholder, Courier logistics limited"With Zoho Analytics, the ability to visualize things became easy. Most of my managers now use Zoho dashboards and quickly create reports themselves. Its usability features, like easy drag and drop filters and drill down options, are top-notch."
Ben Smith
Advisor and former COO of Sugarfina"Zoho Analytics is the only product with the right mix of cost and value—with features like data visualization, integration, data blending, collaboration, user filters, drag and drop, geomaps, and much more at an affordable price"
Maurizio Pisana
IT Manager, Caffe Moak“Zoho Analytics—being fast, simple, yet compelling BI software—made our lives easier for importing, integrating, and analyzing data. Visualization is another plus in this product, and dashboards are very appealing"