Ziaに質問
AIコパイロットのZoho Zia に、自然な言葉で話しかけてみてください。Zoho Zia があなたの質問を、洞察に満ちたビジュアルへと変換します。
Zoho Zia のおすすめ
Zoho Zia が、検索するデータに合わせてカスタマイズした、状況に応じた可視化表示をインテリジェントに提案します。
レポートとダッシュボードの自動生成
Zoho Zia が、データからプロフェッショナルグレードのレポートやダッシュボードを数秒で自動生成できます。
お客さま
ユーザー
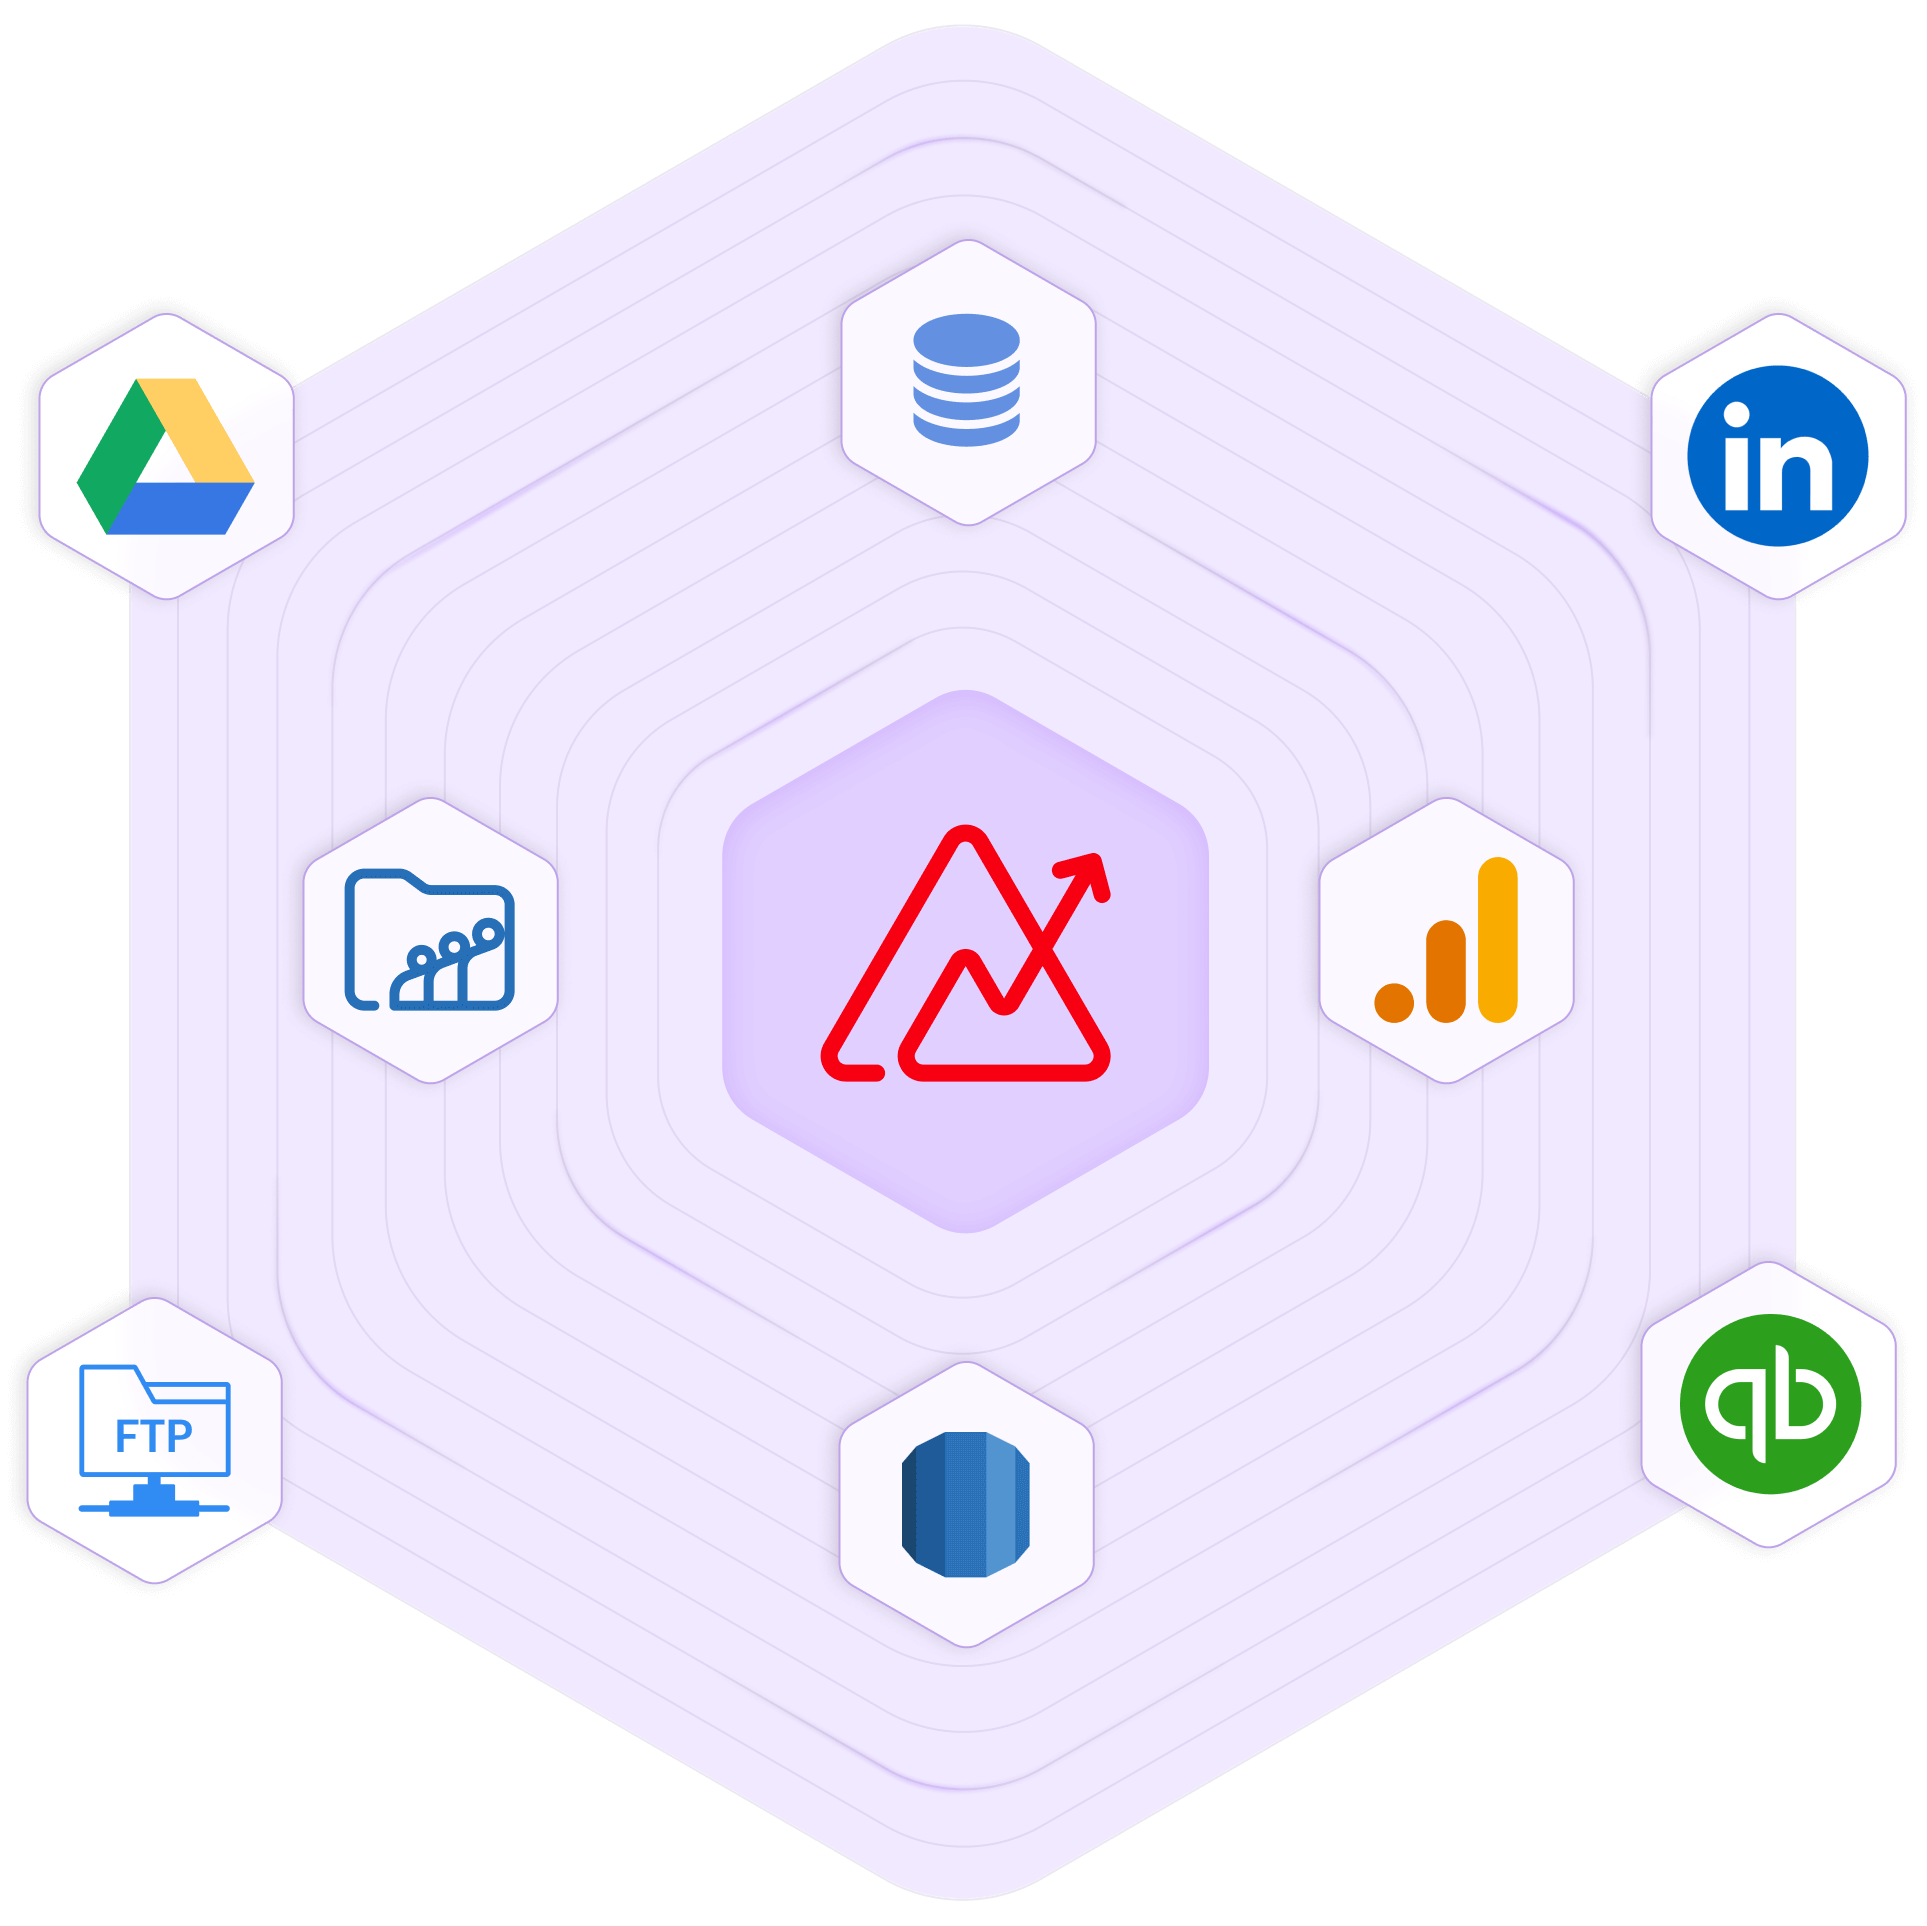
複数のソースからデータをインポートして可視化し、詳細な分析ができます。アクセスできるデータは、クラウドビジネスアプリ、データベースとデータレイク、クラウドドライブ、ローカルファイル、Web URLです。
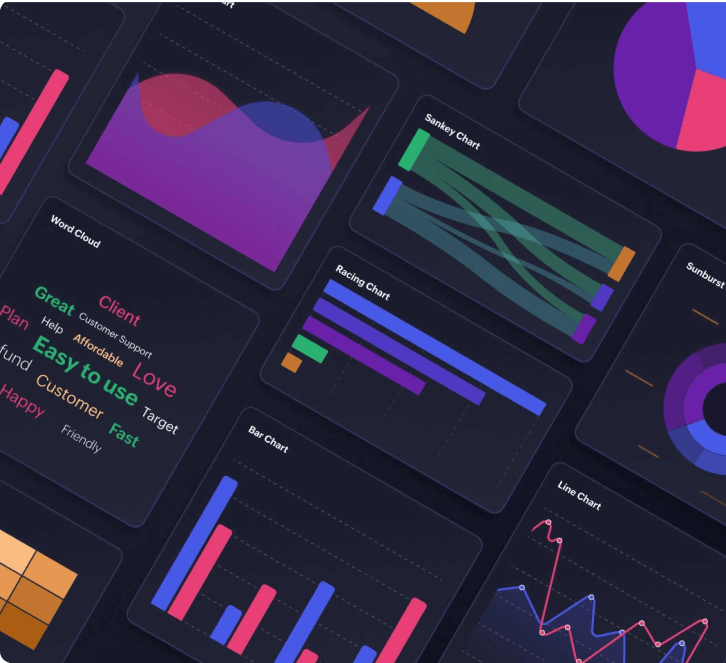
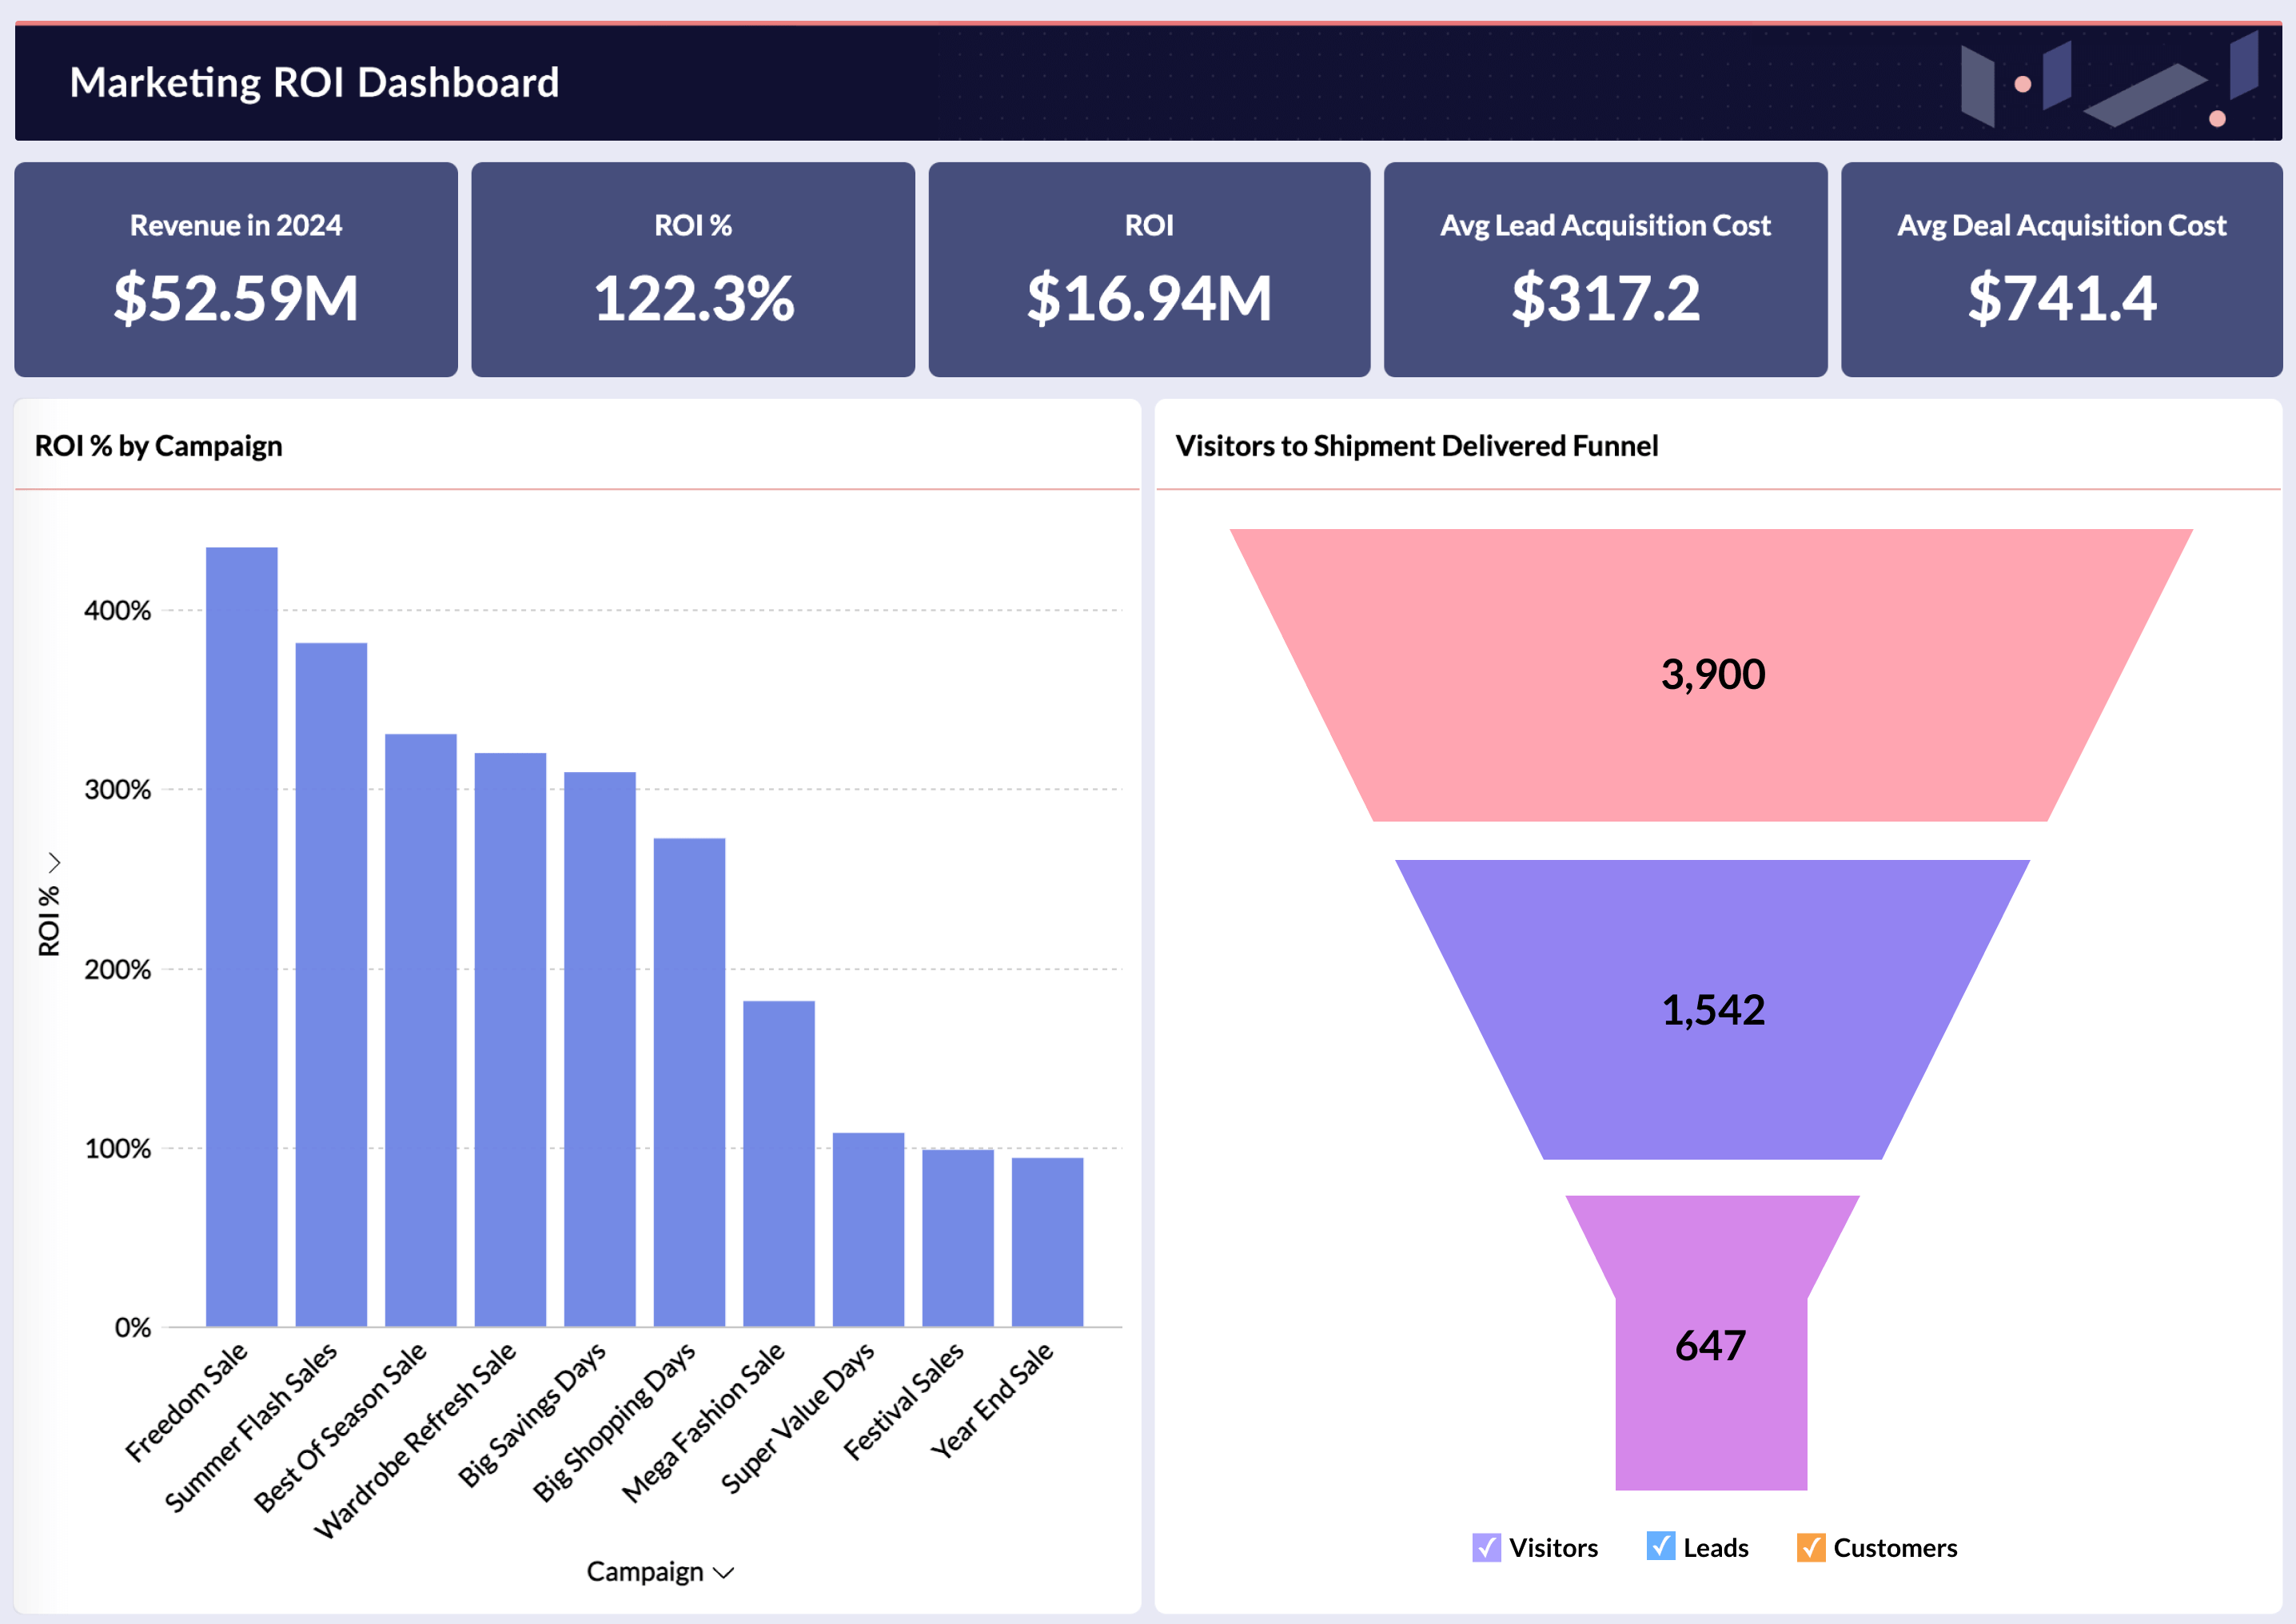
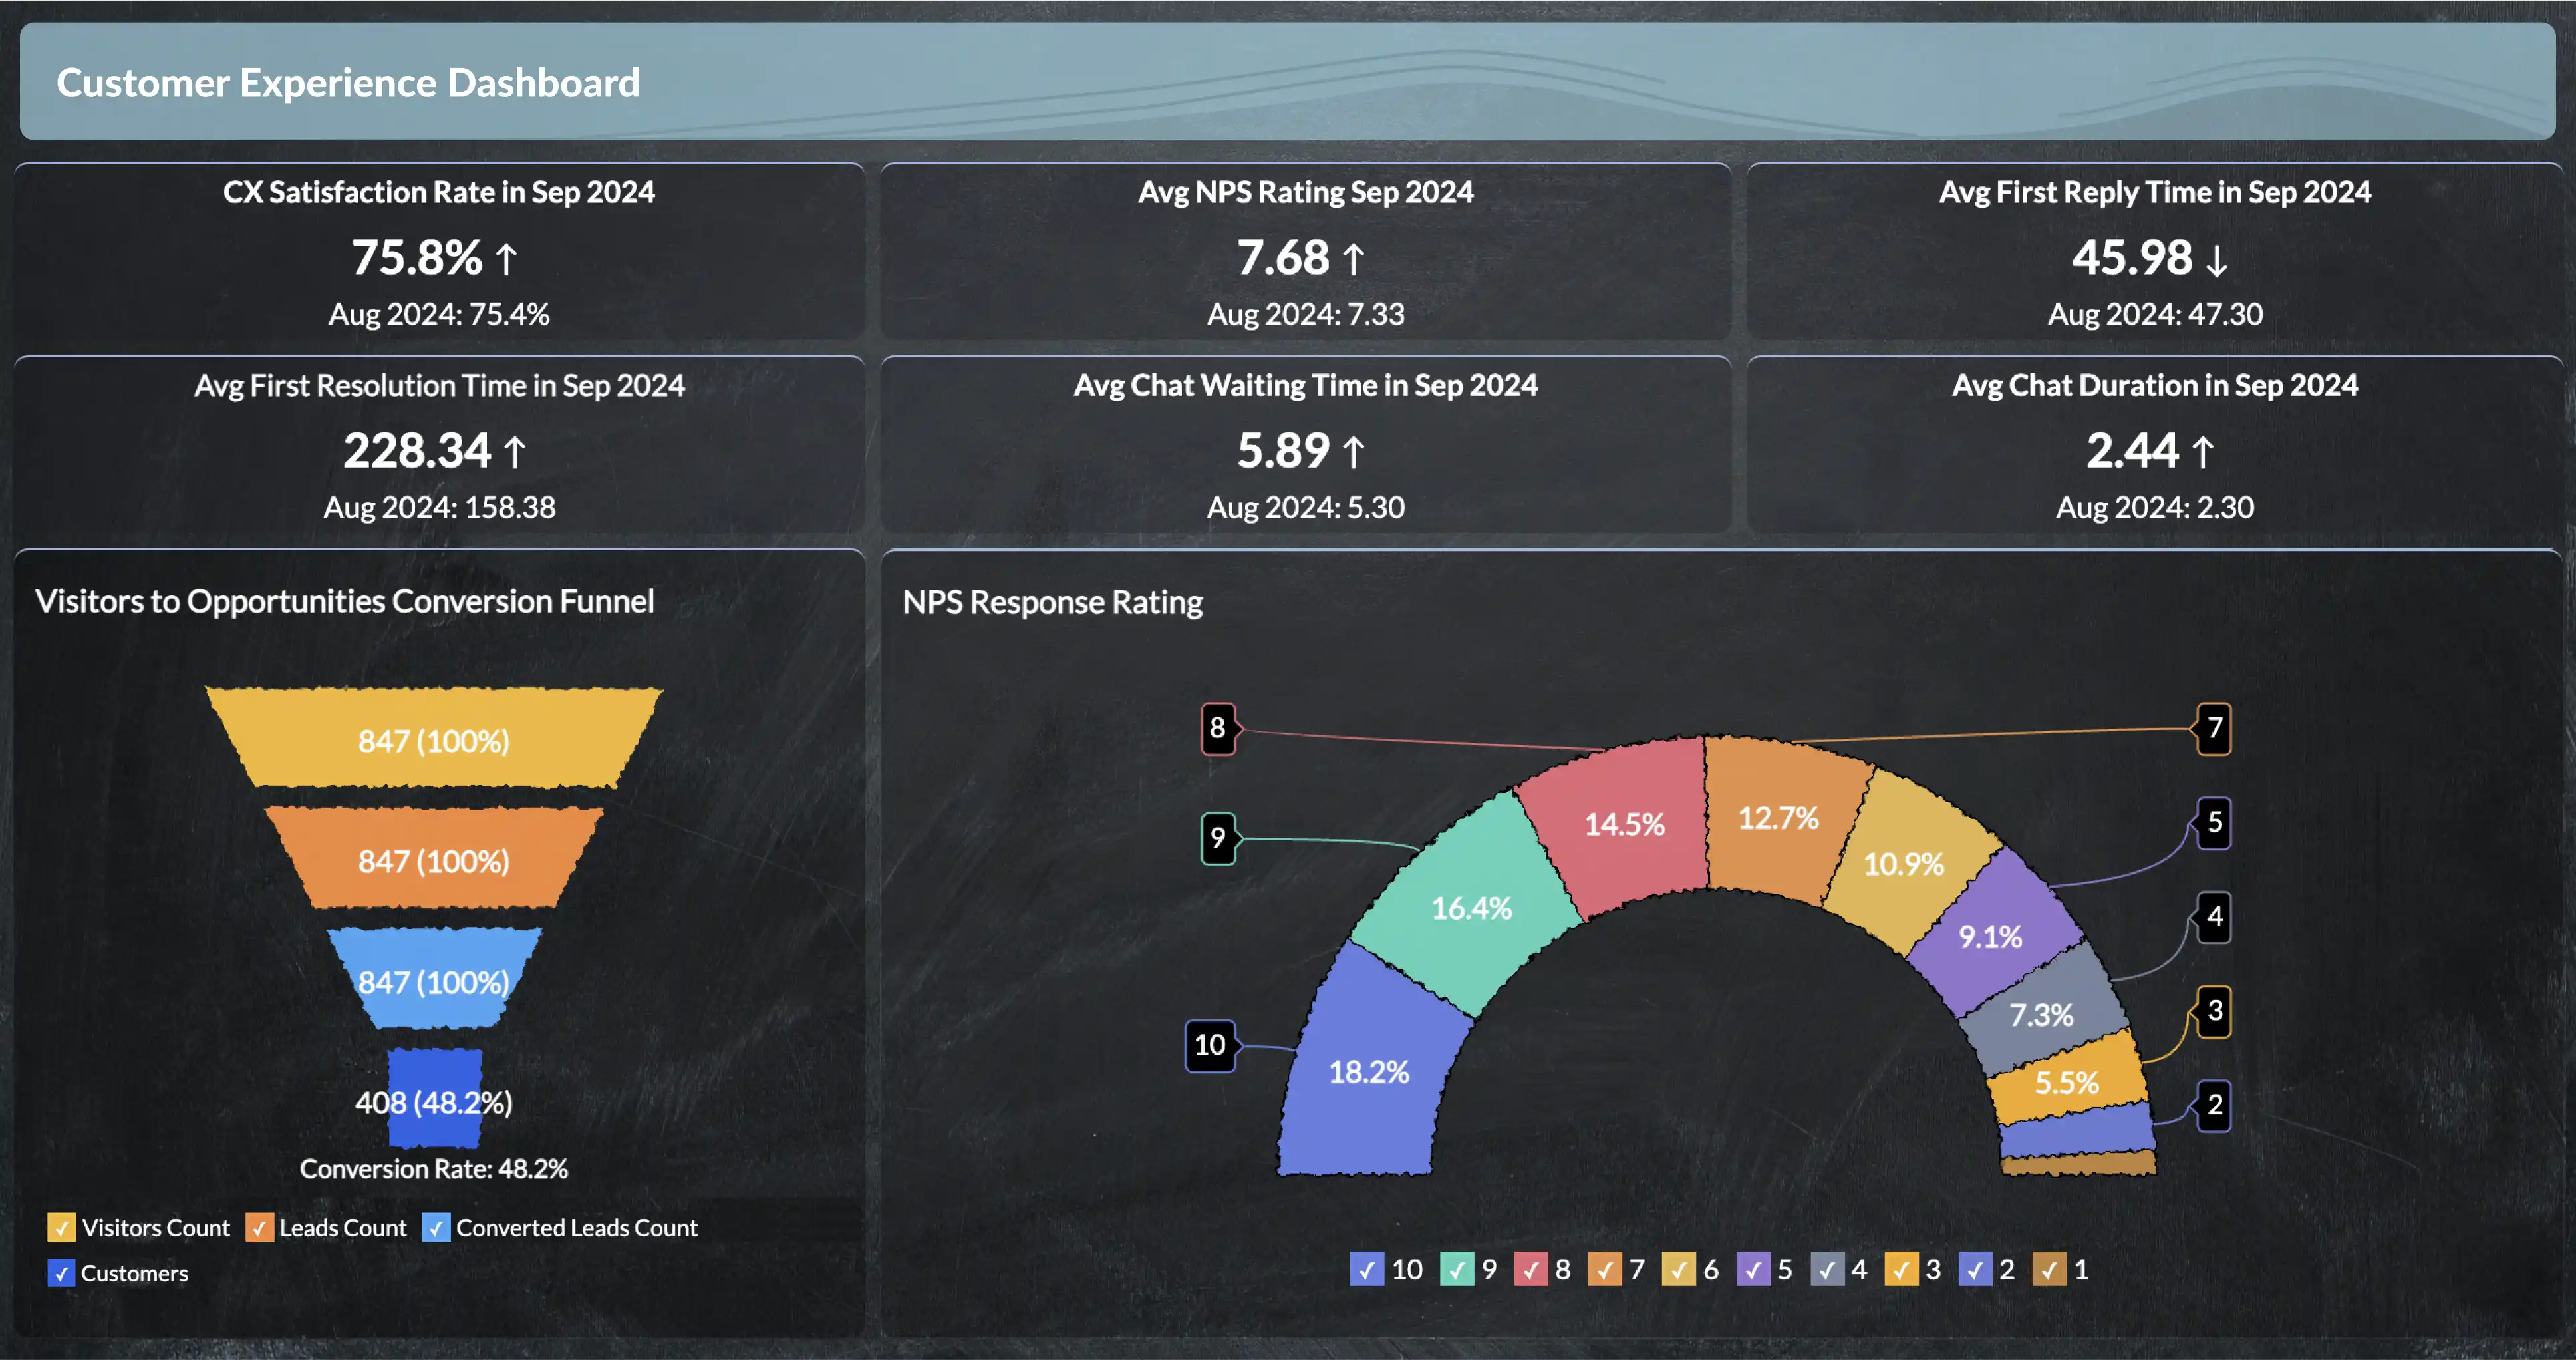
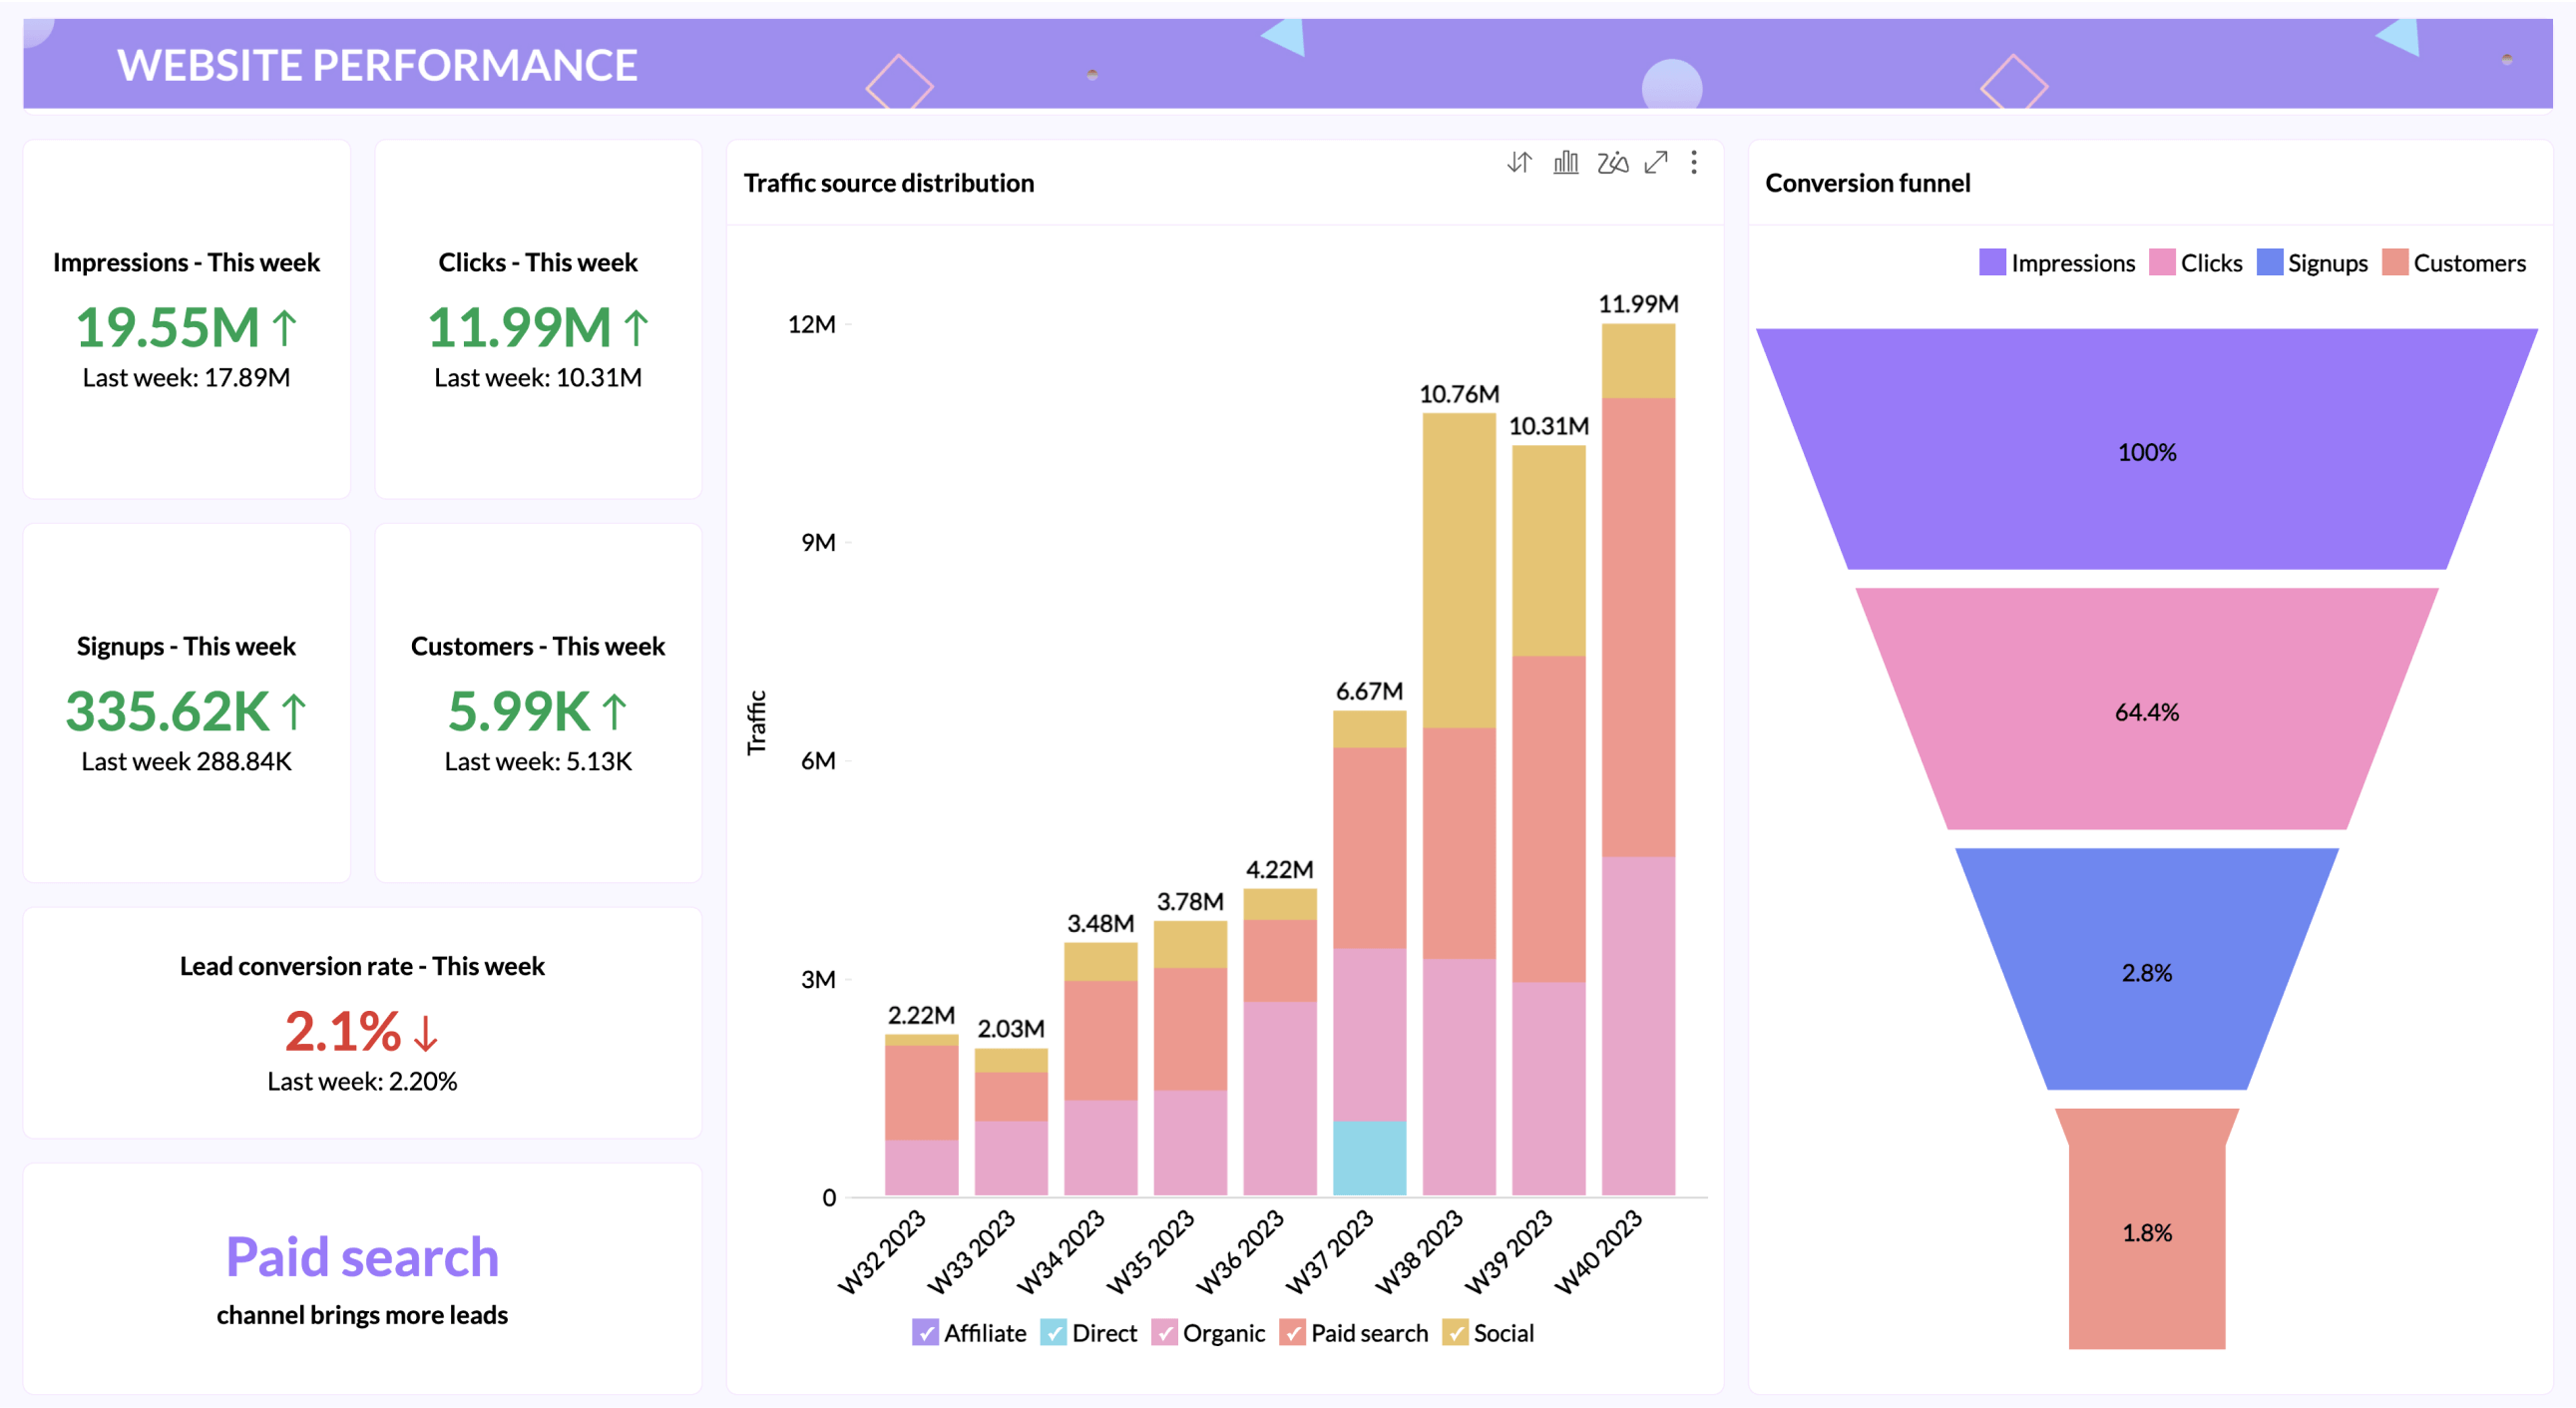
チャート、ウィジェット、ピボットテーブル、表ビューコンポーネントなど、多様なデータ可視化ツールを活用できます。直感的なドラッグ&ドロップインターフェイスにより、レポートやダッシュボードなどのインタラクティブなデータ可視化表示を作成できます。
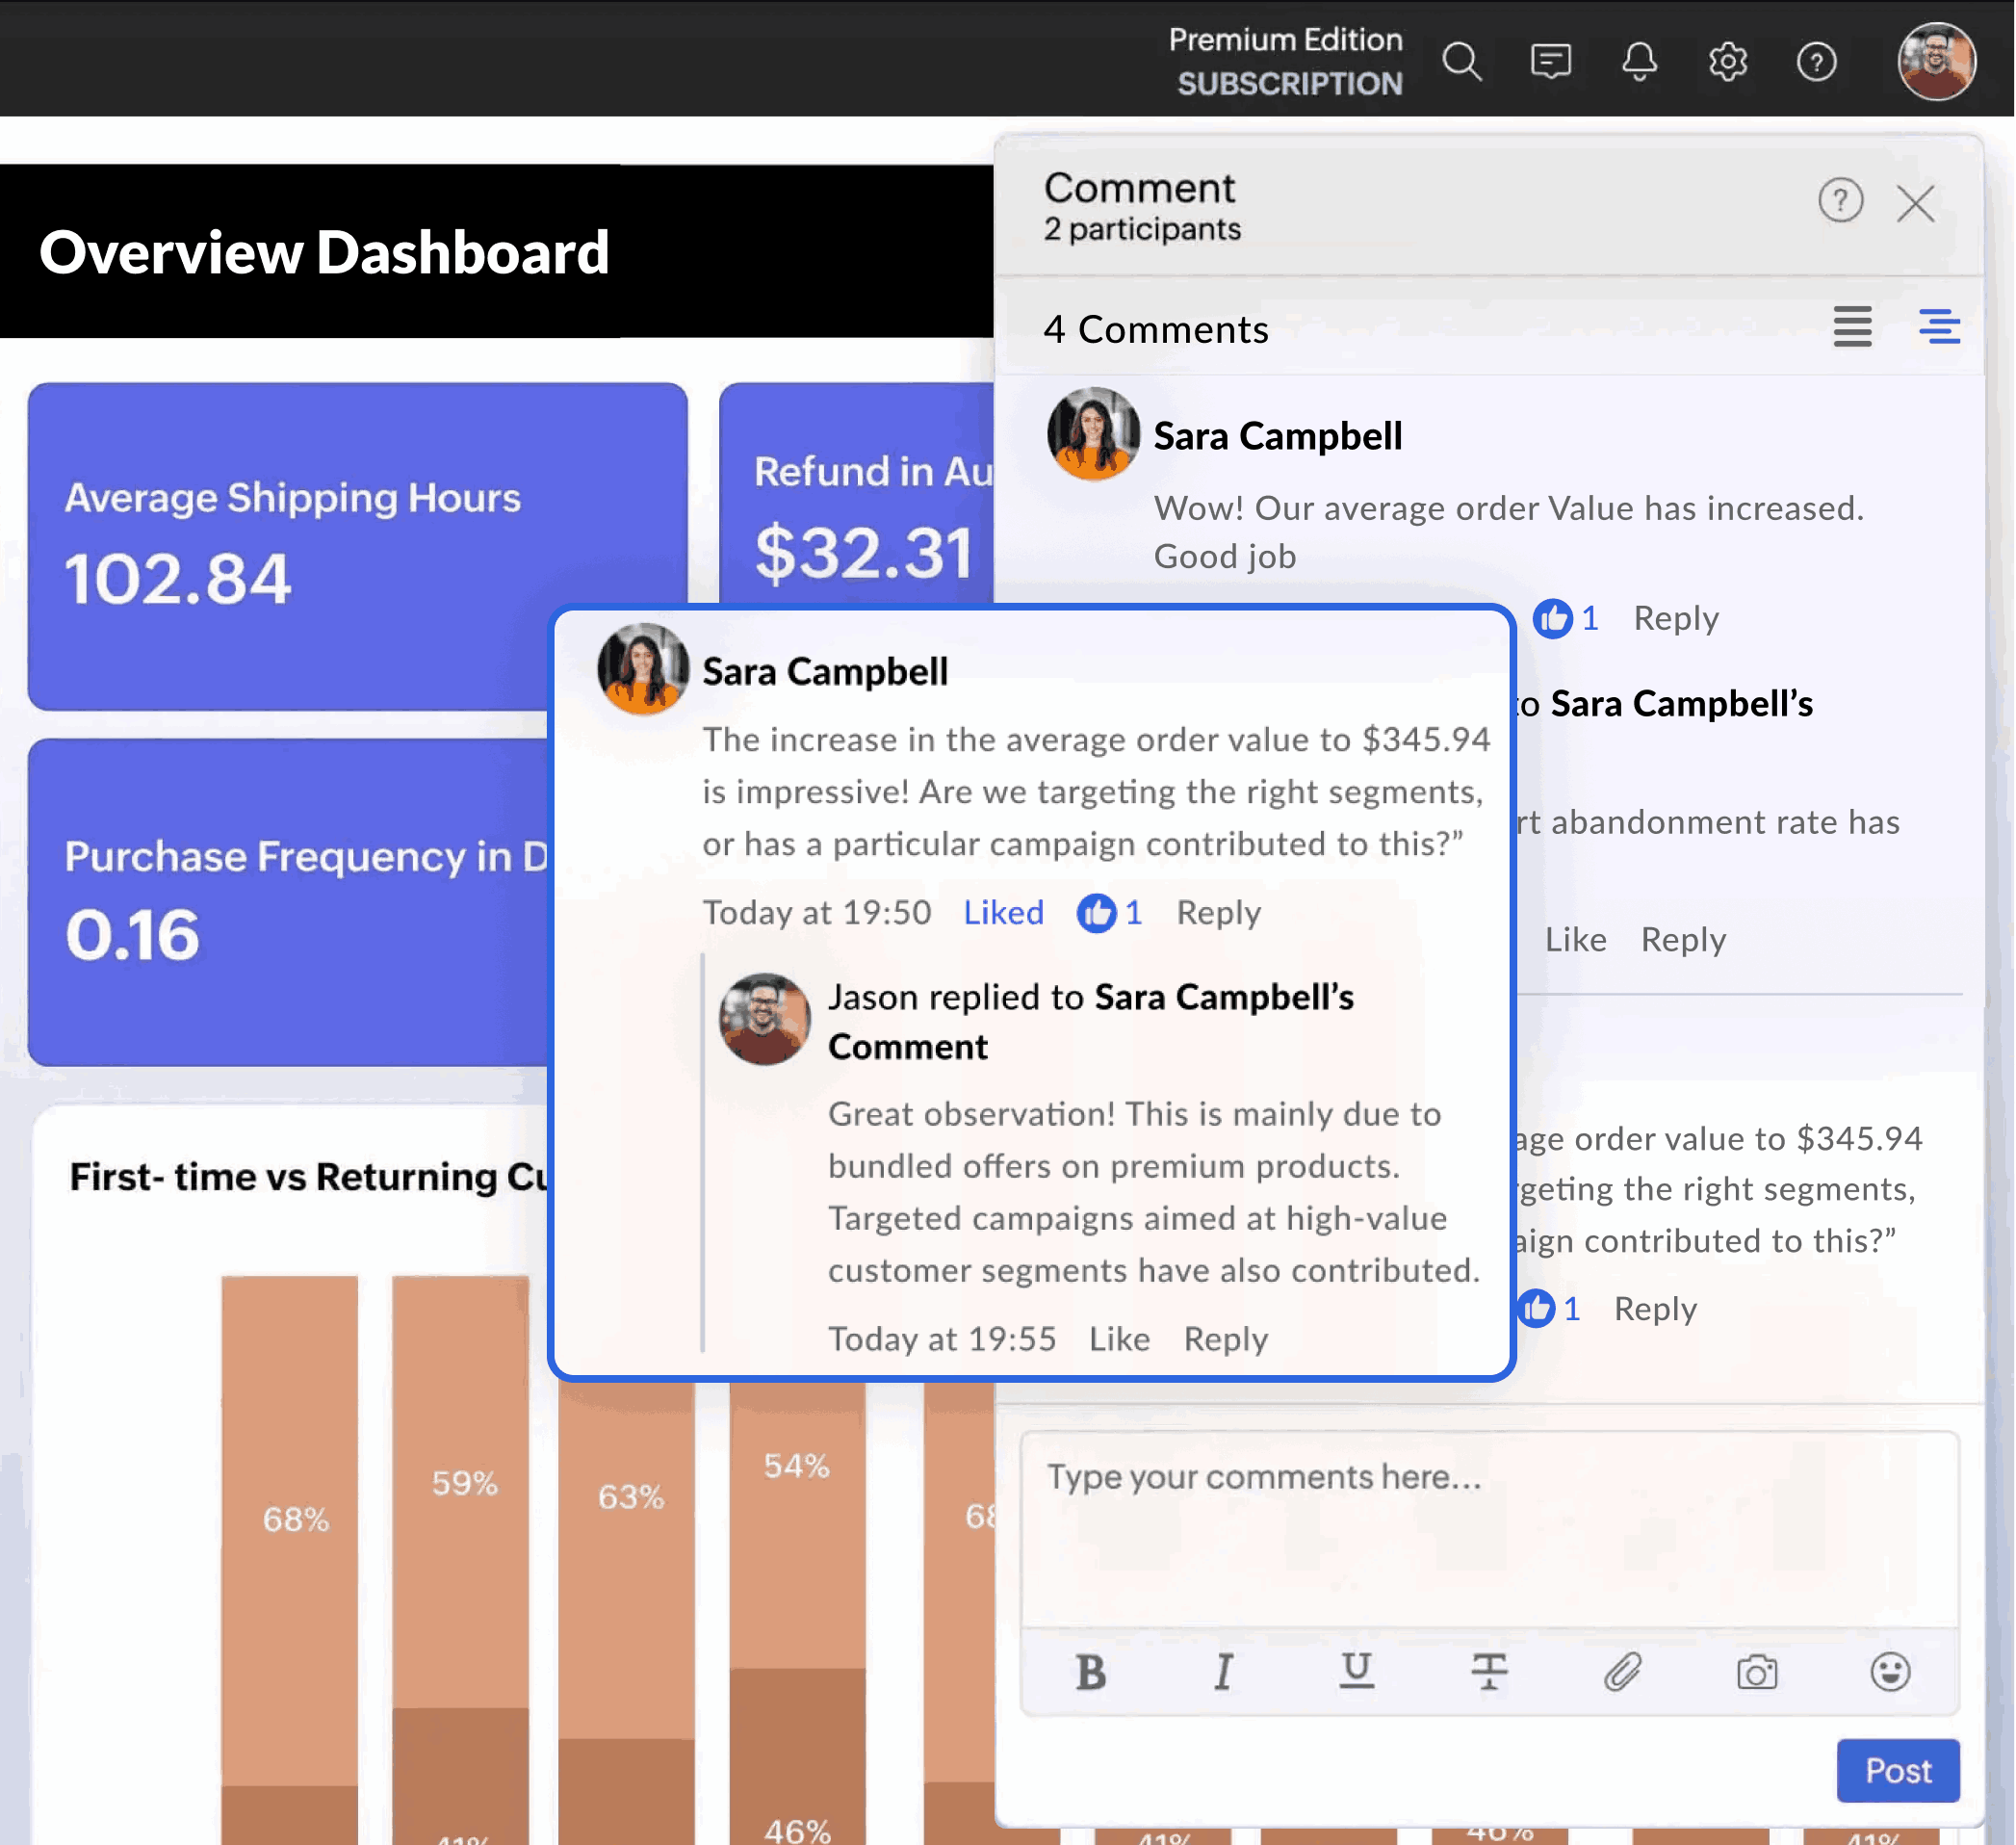
同僚とレポートやダッシュボードを共有して、チームワークを強化しましょう。特定のレポートやダッシュボード上で、状況に応じてコメントスレッドを立ち上げて、リアルタイムにコラボレーションできます。アクセス制御を設定し、レポートやダッシュボードを埋め込み、メールスケジュールを設定して、レポートをエクスポートまたは印刷できます。
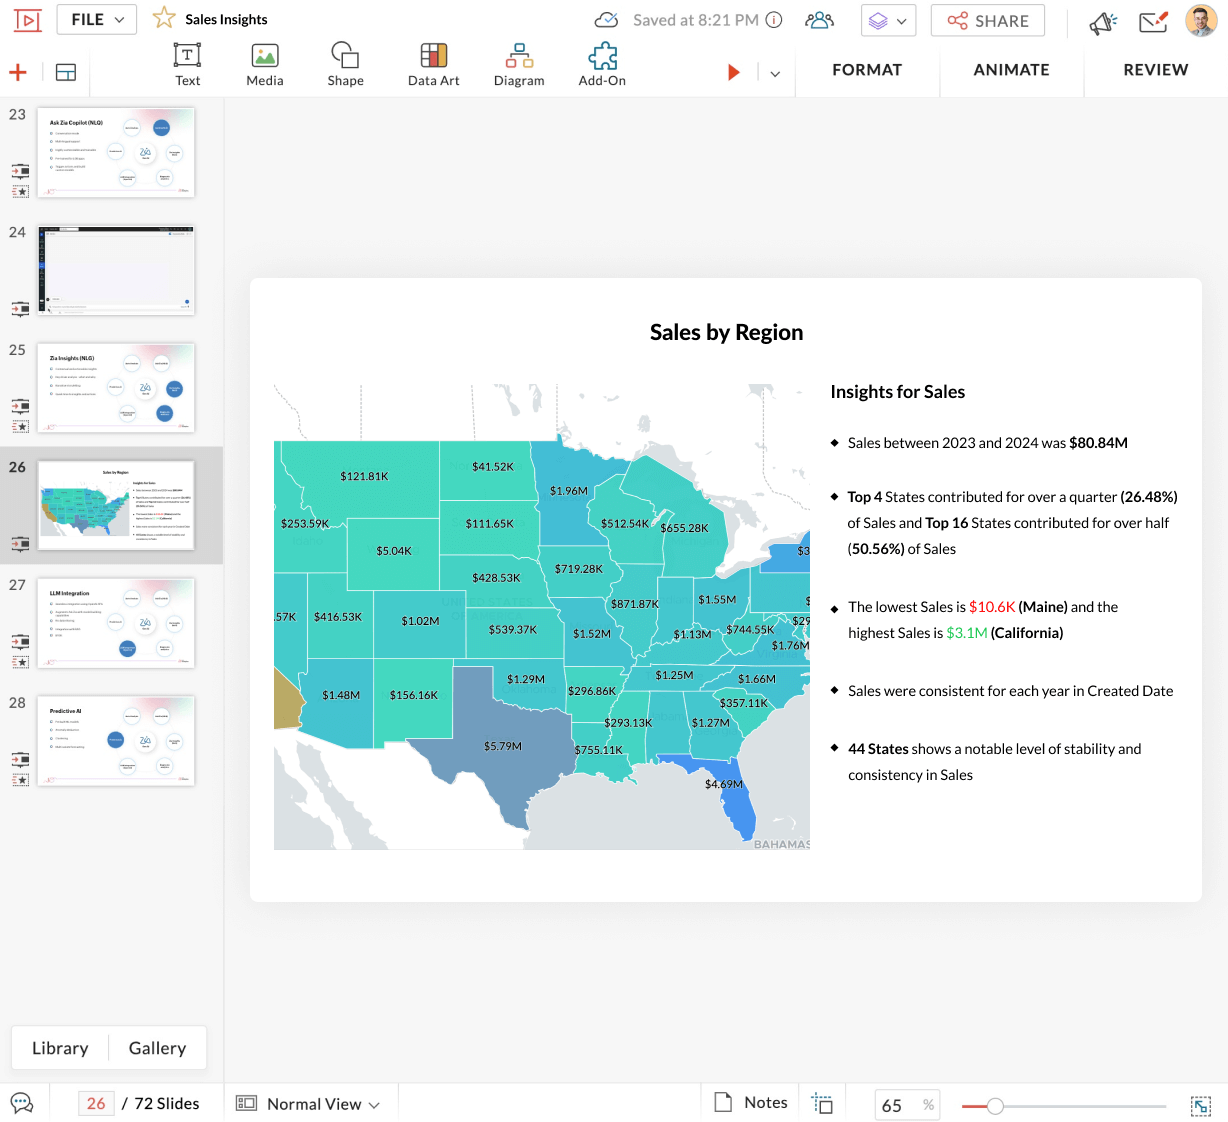
表示したいレポートやダッシュボードを選択すると、Zoho Analytics がインタラクティブな可視化とZiaの洞察の解説付きのスライドショーを自動生成します。レポートの画像をコピー&ペーストする必要はなくなり、プレゼンテーションを動的に作成できます。
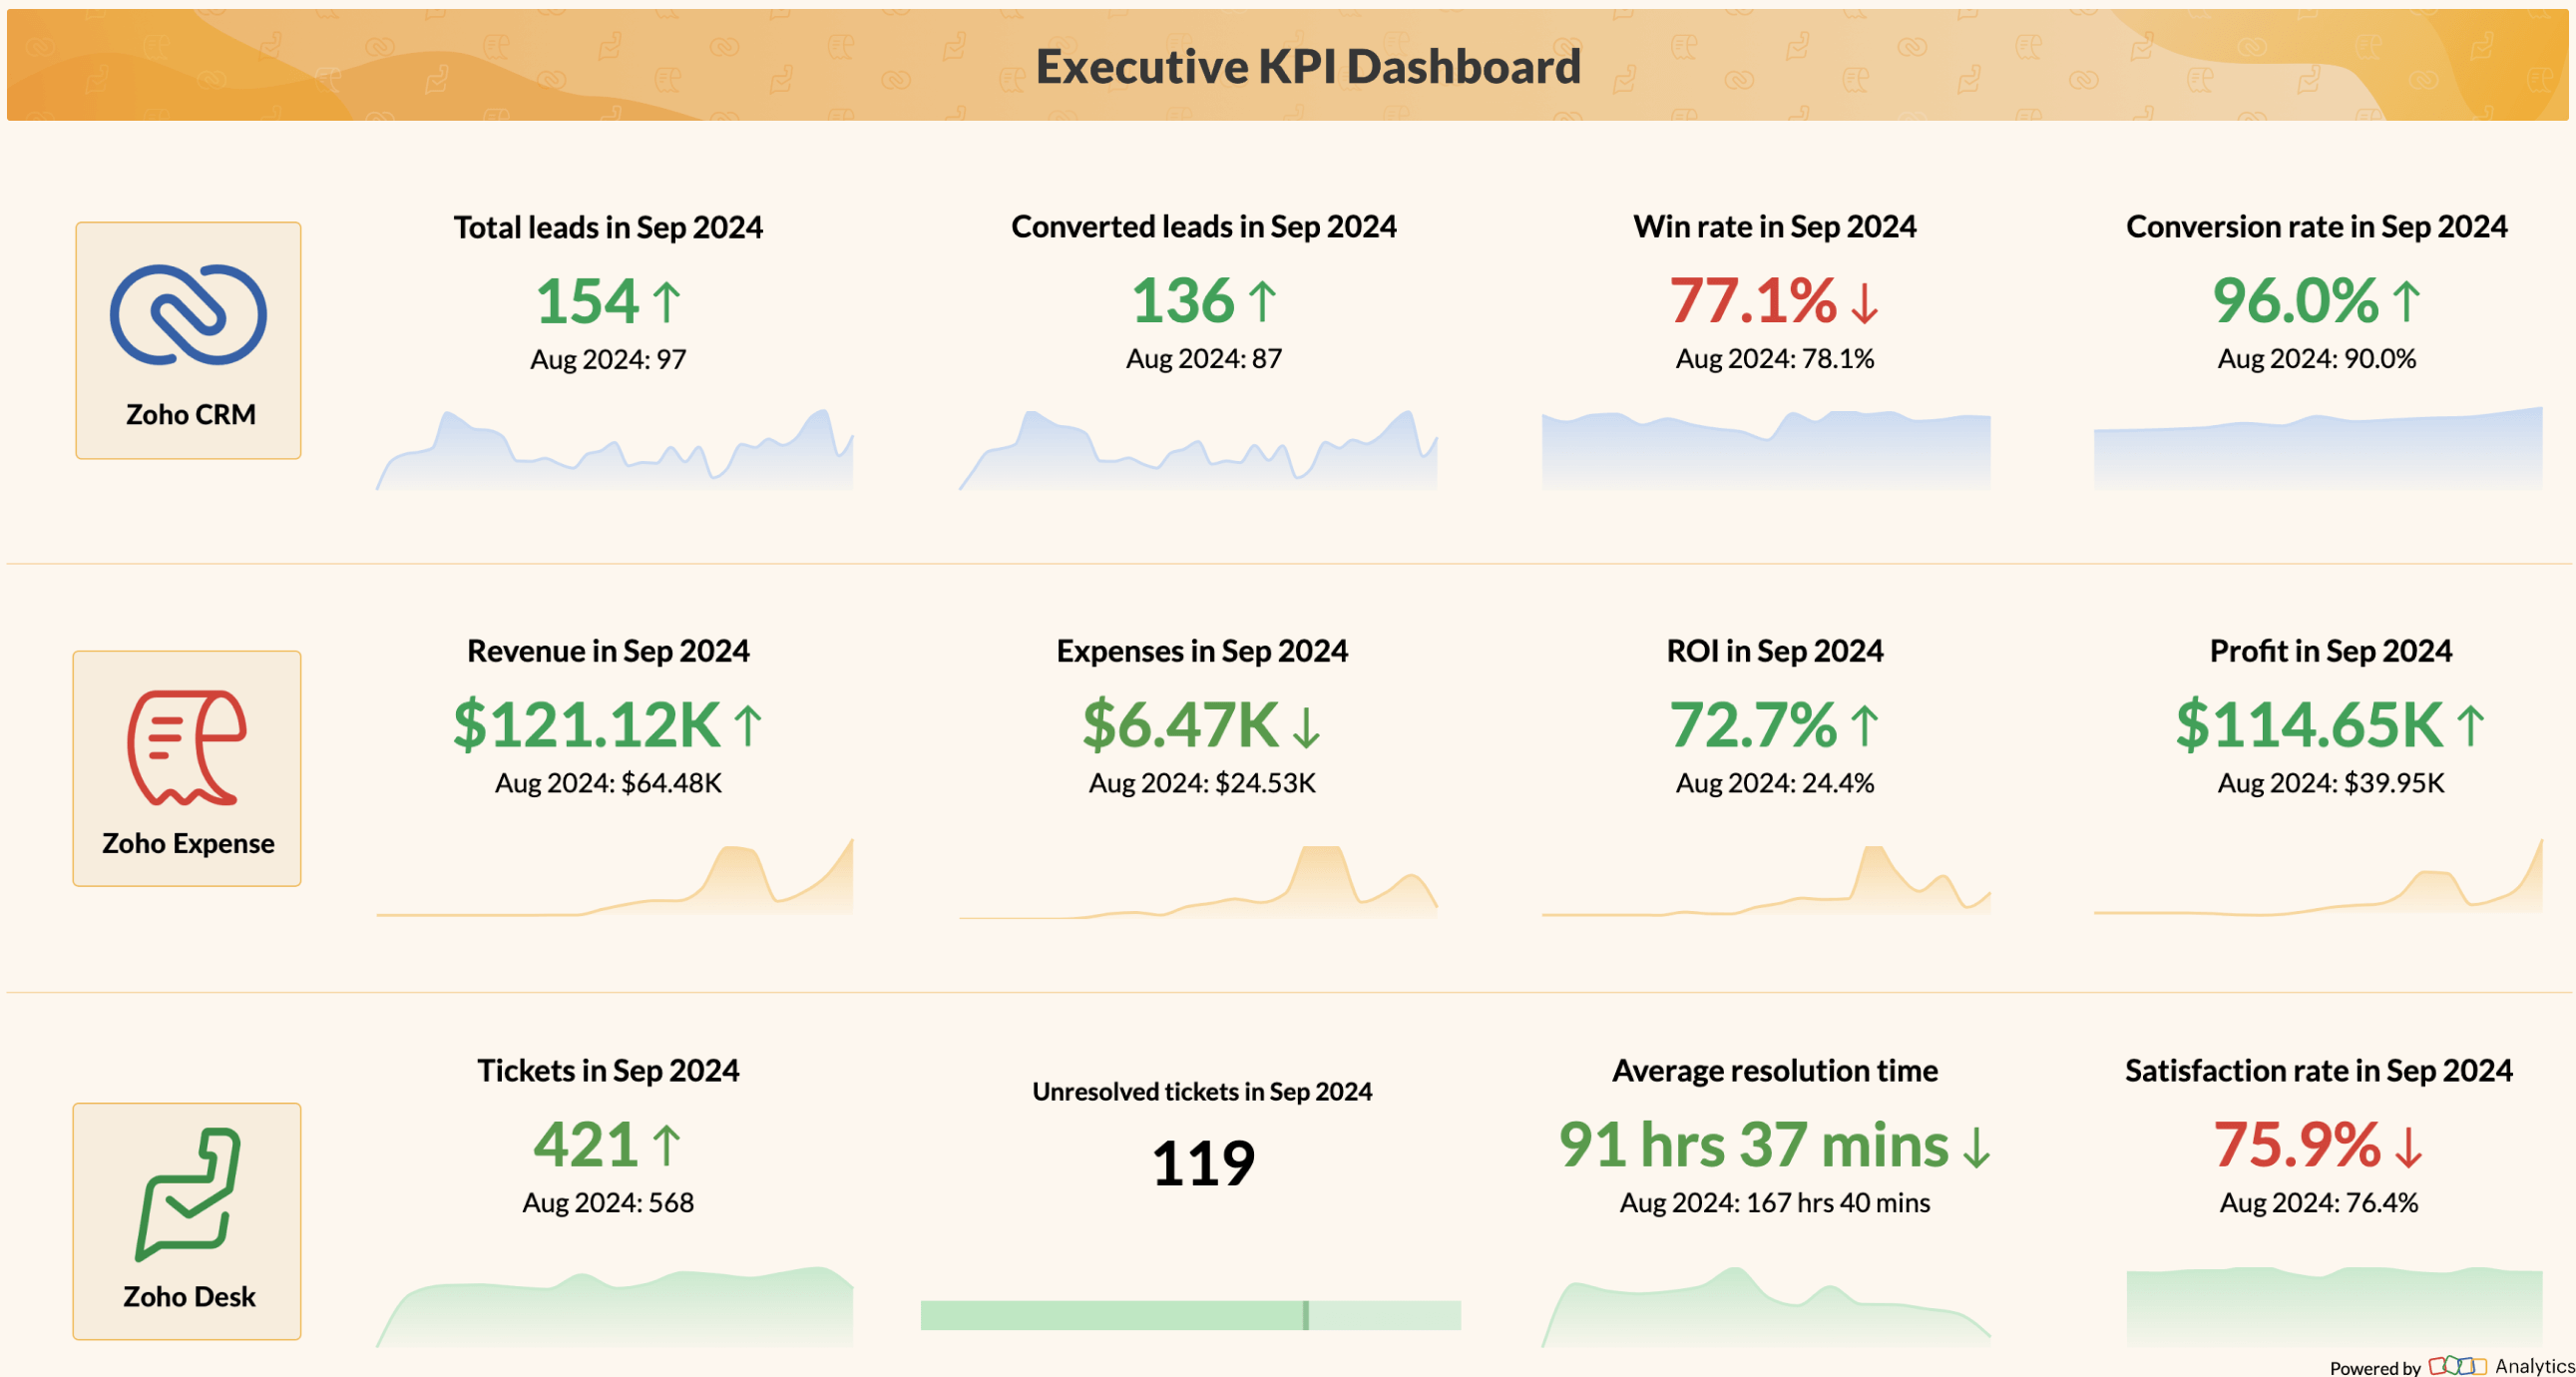
さまざまなソースからのデータを融合し、機能横断的なレポートを生成して、ビジネスに対する深い洞察を得ることができます。たとえば、CRMからの売上データをヘルプデスクデータと組み合わせて、「売上とチケット数との比較」レポートを作成できます。
AIコパイロットのZoho Zia に、自然な言葉で話しかけてみてください。Zoho Zia があなたの質問を、洞察に満ちたビジュアルへと変換します。
Zoho Zia が、検索するデータに合わせてカスタマイズした、状況に応じた可視化表示をインテリジェントに提案します。
Zoho Zia が、データからプロフェッショナルグレードのレポートやダッシュボードを数秒で自動生成できます。
スプレッドシートからのデータをクラウドデータベースに接続、インポートし、連携できます。
ドラッグ&ドロップで魅力的なレポートをかんたんに作成できます。情報豊富なチャートやダッシュボードを構築できます。
妥協することなく共同で作業できます。きめ細かな権限制御で、チーム全体で洞察を安全に共有できます。
データをプレゼンテーションに即座に変換できます。ゼロからプレゼンテーションを作成する代わりに、スライドショーの自動生成により、洞察に集中できます。
どこからでもストーリーを共有できます。わずか1クリックで、インタラクティブなダッシュボードやレポートを埋め込んだり、オンラインで公開したりできます。
高度なAI機能を使用して、従来よりも迅速にパターンを明らかにし、予測を生成し、より深い洞察を得られます。

"Zoho Analytics gives us a superior edge over Power BI and Tableau, when it comes to the aesthetics of visualization. We're very happy with Zoho’s capability."

"Zoho Analytics created a tremendous amount of value for the agency and takes our relationship with clients to the next level. The preparedness to integrate the data, build alluring visualizations, and its shrewdness have given us the ability to retain clients.

"Our main intent was to make data-driven decisions. We use Zoho CRM and Zoho Books and we wanted to precisely analyze every single data point from these apps. So we fell back on Zoho Analytics. The visualization with data precision is impeccable and we are extremely happy with the Zoho suite of products."

"Data visualization is important for any BI tool.It's great to present data in a way that is meaningful to the audience, helping them quickly grasp the content.That’s where Zoho Analytics is very strong.We now analyze our sales, operations, and finance using Zoho Analytics."

"With Zoho Analytics, the ability to visualize things became easy.Most of my managers now use Zoho dashboards and quickly create reports themselves. Its usability features, like easy drag and drop filters and drill down options, are top-notch."
"Zoho Analytics is the only product with the right mix of cost and value—with features like data visualization, integration, data blending, collaboration, user filters, drag and drop, geomaps, and much more at an affordable price"
“Zoho Analytics—being fast, simple, yet compelling BI software—made our lives easier for importing, integrating, and analyzing data. Visualization is another plus in this product, and dashboards are very appealing"
"Zoho Analytics gives us a superior edge over Power BI and Tableau, when it comes to the aesthetics of visualization.We're very happy with Zoho’s capability."
"Zoho Analytics created a tremendous amount of value for the agency and takes our relationship with clients to the next level.The preparedness to integrate the data, build alluring visualizations, and its shrewdness have given us the ability to retain clients.
"Our main intent was to make data-driven decisions.We use Zoho CRM and Zoho Books and we wanted to precisely analyze every single data point from these apps.So we fell back on Zoho Analytics.The visualization with data precision is impeccable and we are extremely happy with the Zoho suite of products."
"Data visualization is important for any BI tool.It's great to present data in a way that is meaningful to the audience, helping them quickly grasp the content.That’s where Zoho Analytics is very strong.We now analyze our sales, operations, and finance using Zoho Analytics."
"With Zoho Analytics, the ability to visualize things became easy.Most of my managers now use Zoho dashboards and quickly create reports themselves.Its usability features, like easy drag and drop filters and drill down options, are top-notch."
"Zoho Analytics is the only product with the right mix of cost and value—with features like data visualization, integration, data blending, collaboration, user filters, drag and drop, geomaps, and much more at an affordable price"
“Zoho Analytics—being fast, simple, yet compelling BI software—made our lives easier for importing, integrating, and analyzing data.Visualization is another plus in this product, and dashboards are very appealing"