Why do you need online project reports?
Online charts and reports often use graphs, images, and charts to visually present useful information such as project status, length of activity, and time spent doing each task. These reports are easy to interpret, making them an ideal way of communicating the latest updates to all your project stakeholders.
Benefits of project management reports
- Allows you to identify the resources needed to complete a project
- Project reporting tools help you monitor whether the project is on schedule or not
- Offers insights into how your team is progressing against pre-defined goals
- Quickly and easily generates useful reports using your business data, with no IT help
Key features of our project reporting tool
Zoho Projects comes with a set of project reporting tools to give you actionable insights into your projects. You can assess how long a project will take to complete, find out who is free and who is occupied, and prioritize the order in which the tasks are to be carried out. With this, you can work out the most efficient way to complete a project.
Interested in using software for project reports? Here's a list of the various reports that are available in our project reporting tool.
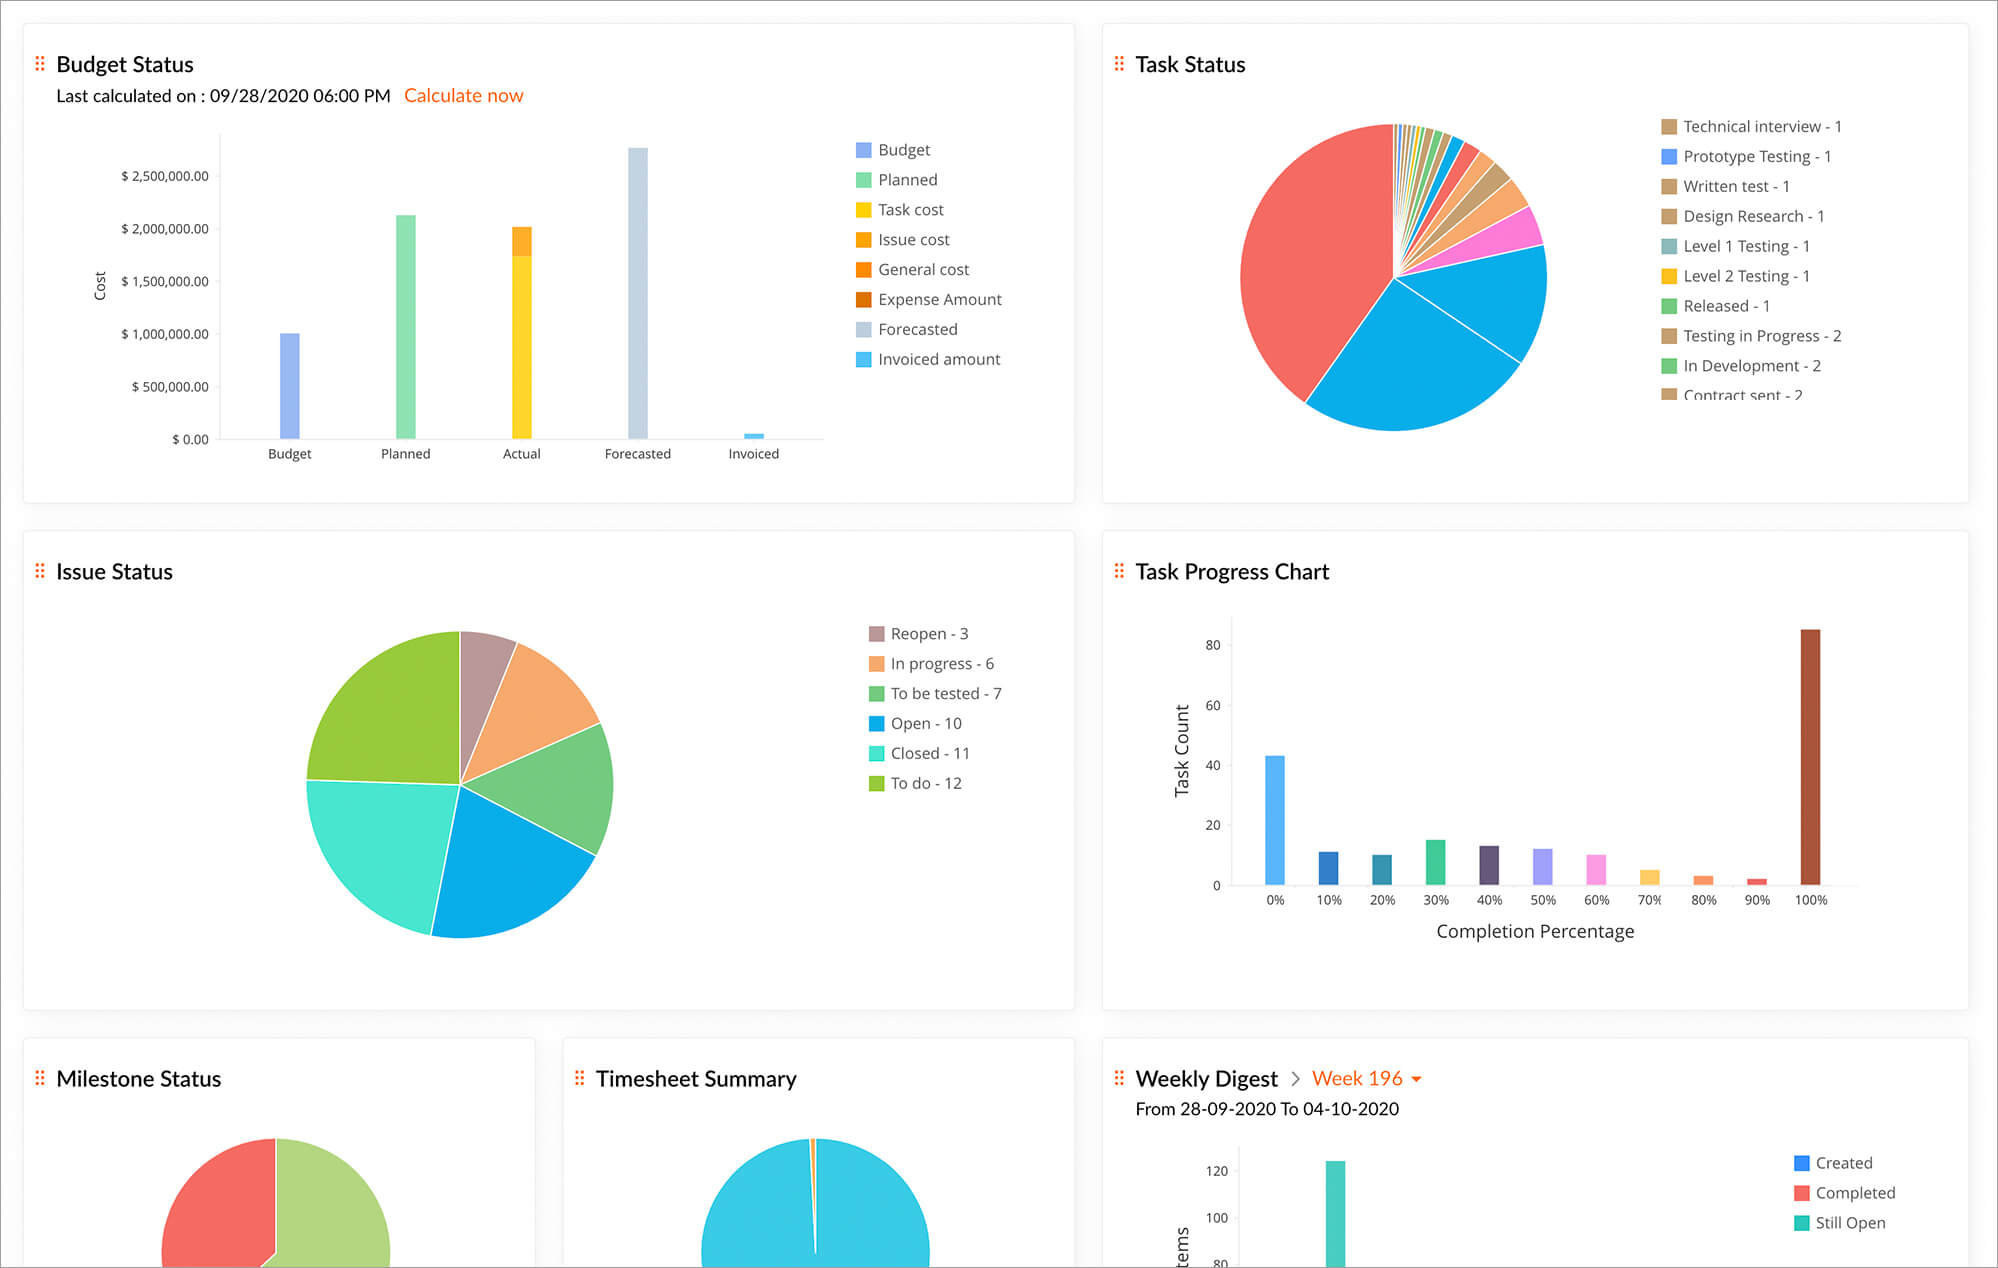
Project status reports
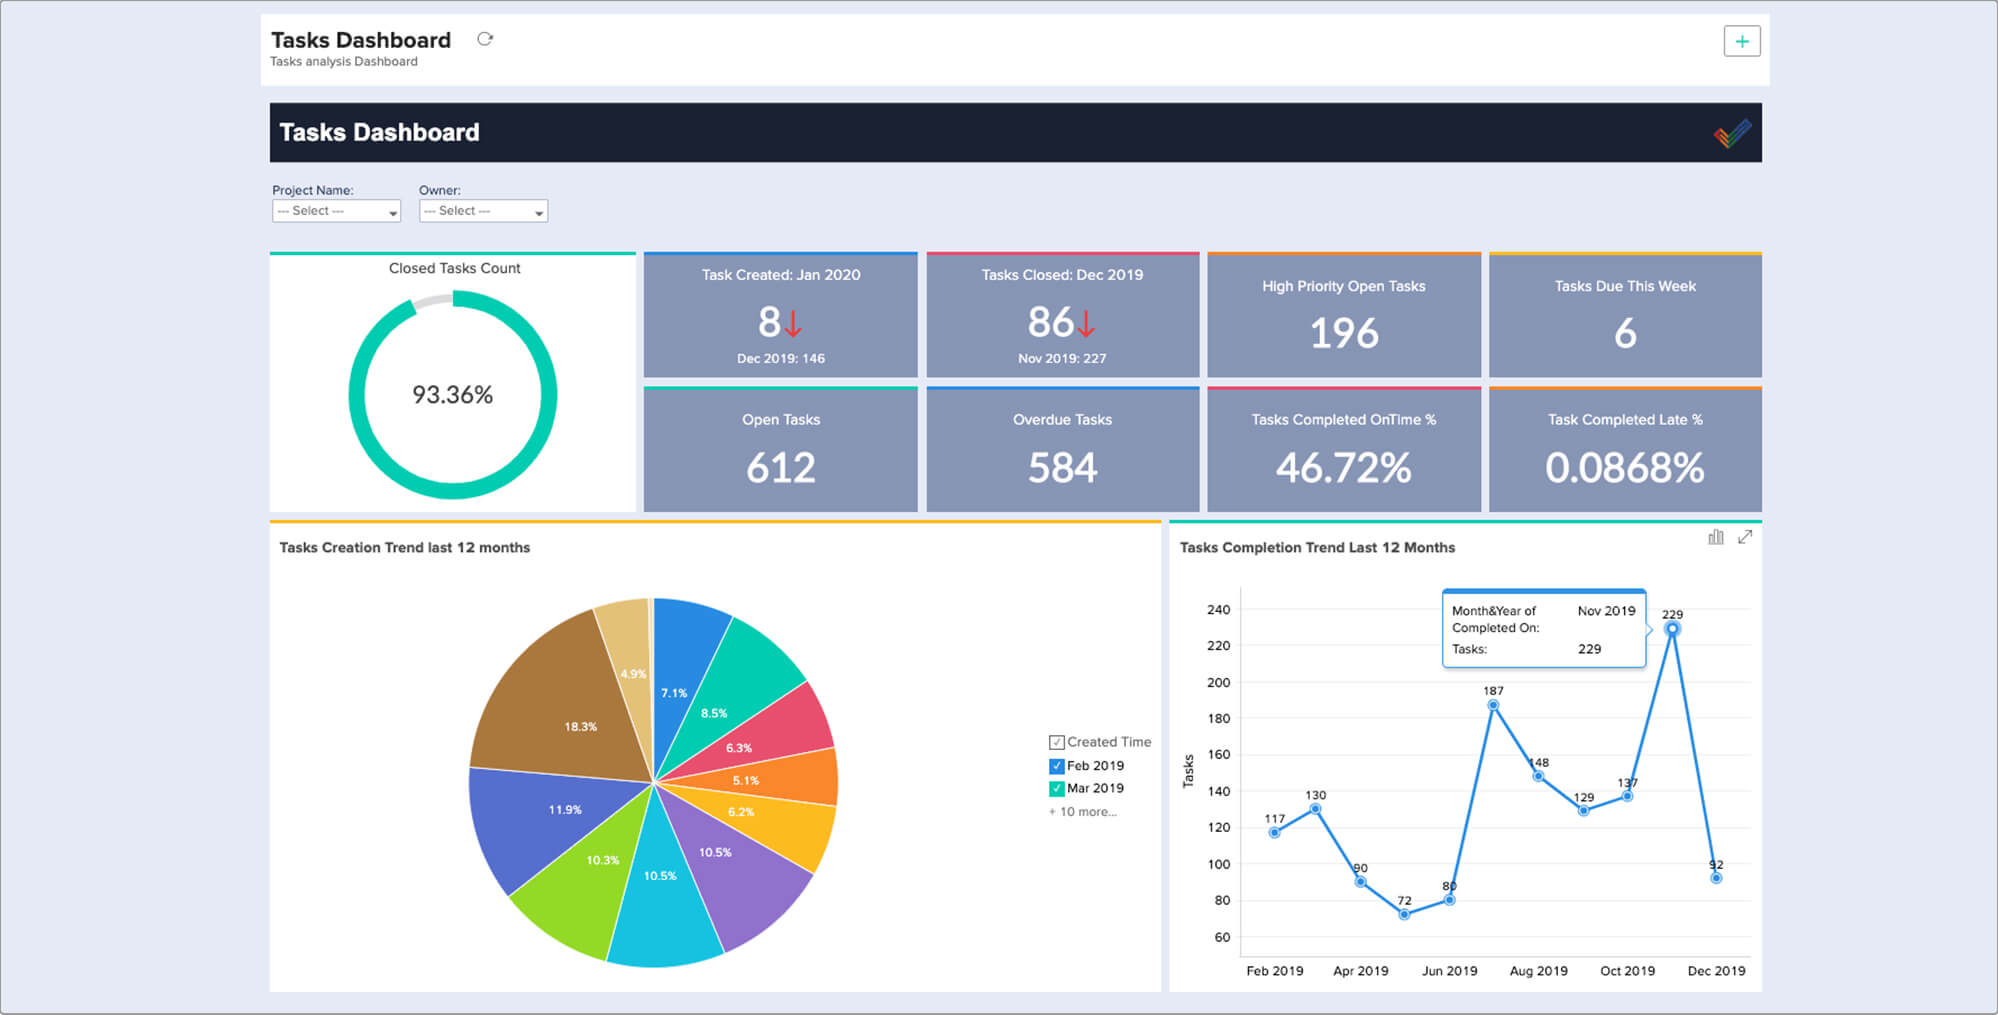
Zoho Projects has an extensive, fully featured dashboard that depicts your project's progress, budget health, team performance, overdue tasks, timesheet summary, and more.
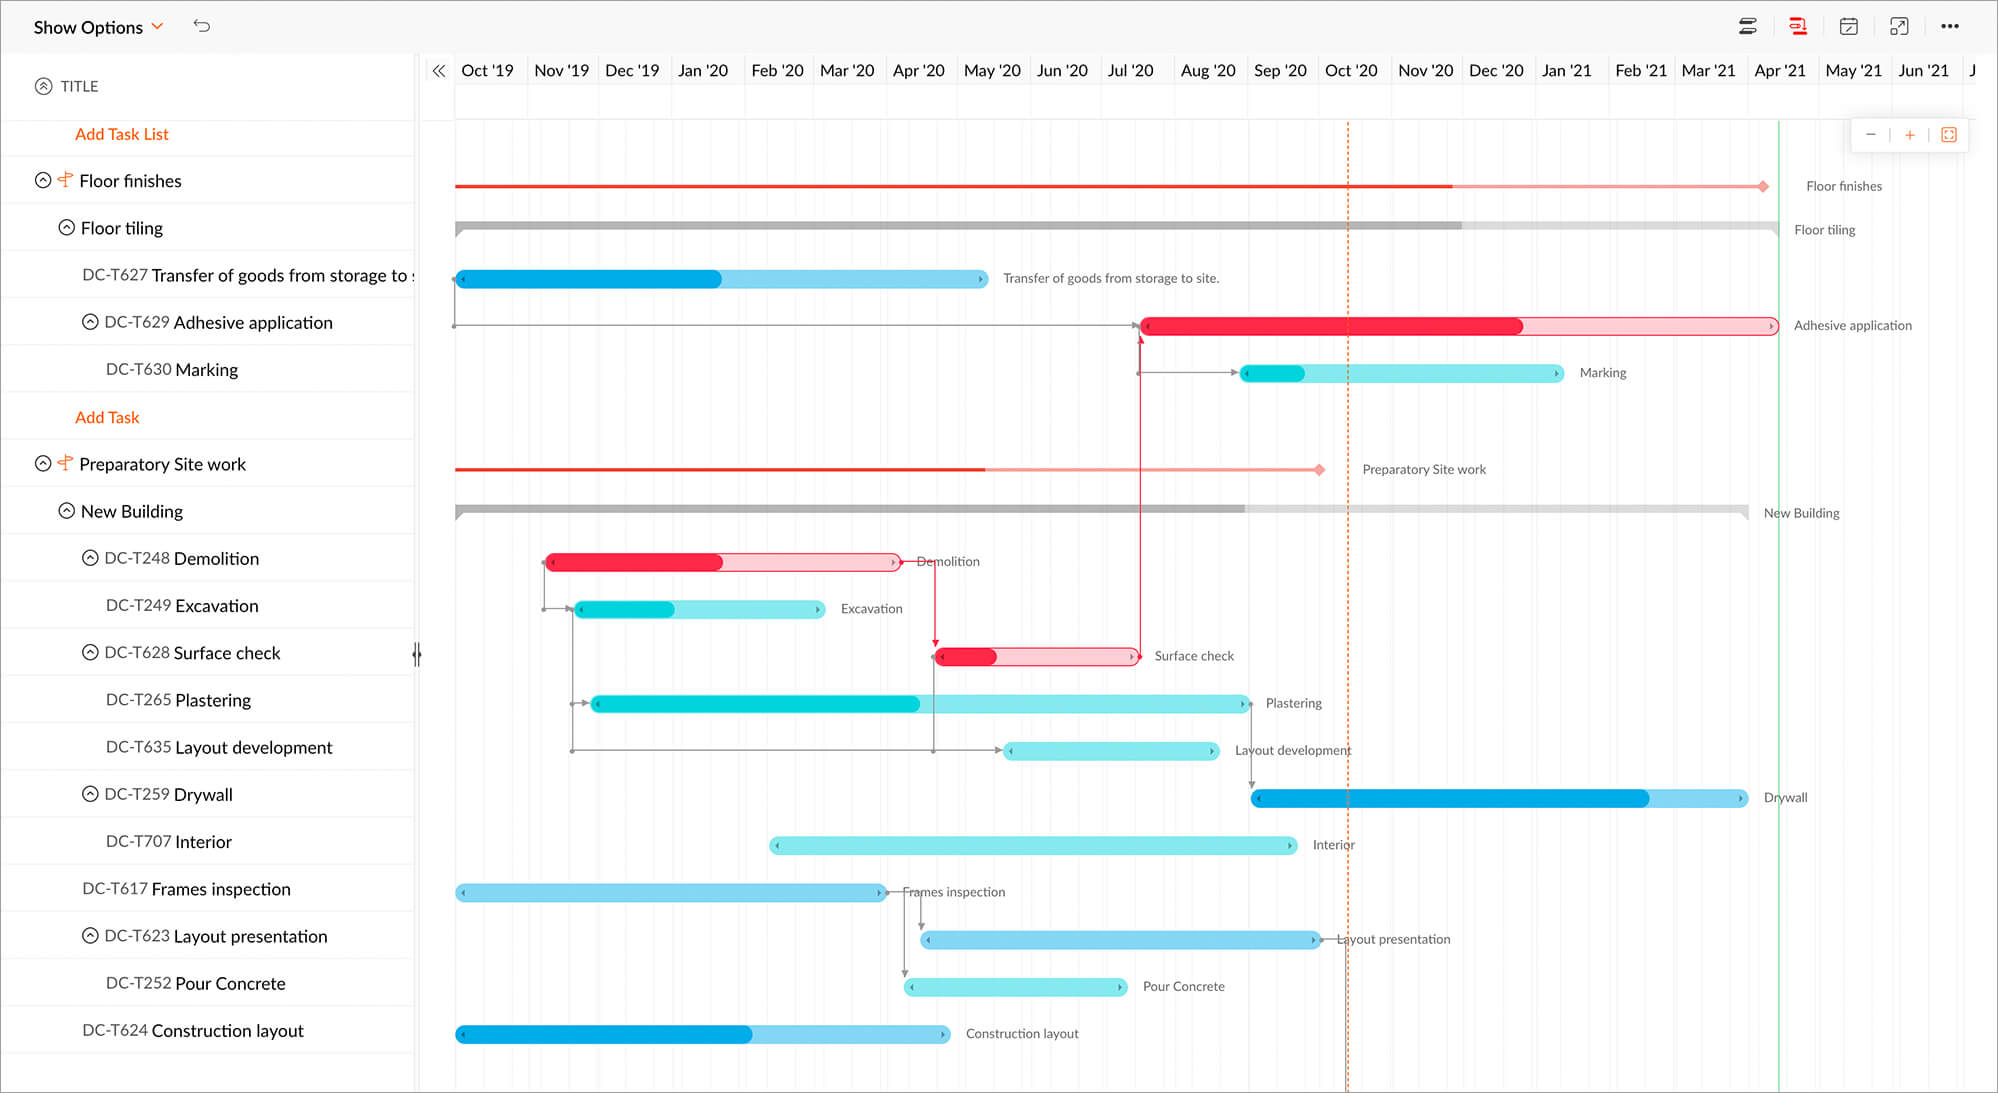
Timeline report
Plan efficiently using our Gantt chart, and track how your project is progressing in real time, using our project reporting tool. Easily set dependencies between your tasks with a simple drag-and-drop interface in the Gantt module to keep up with the critical path of your project.
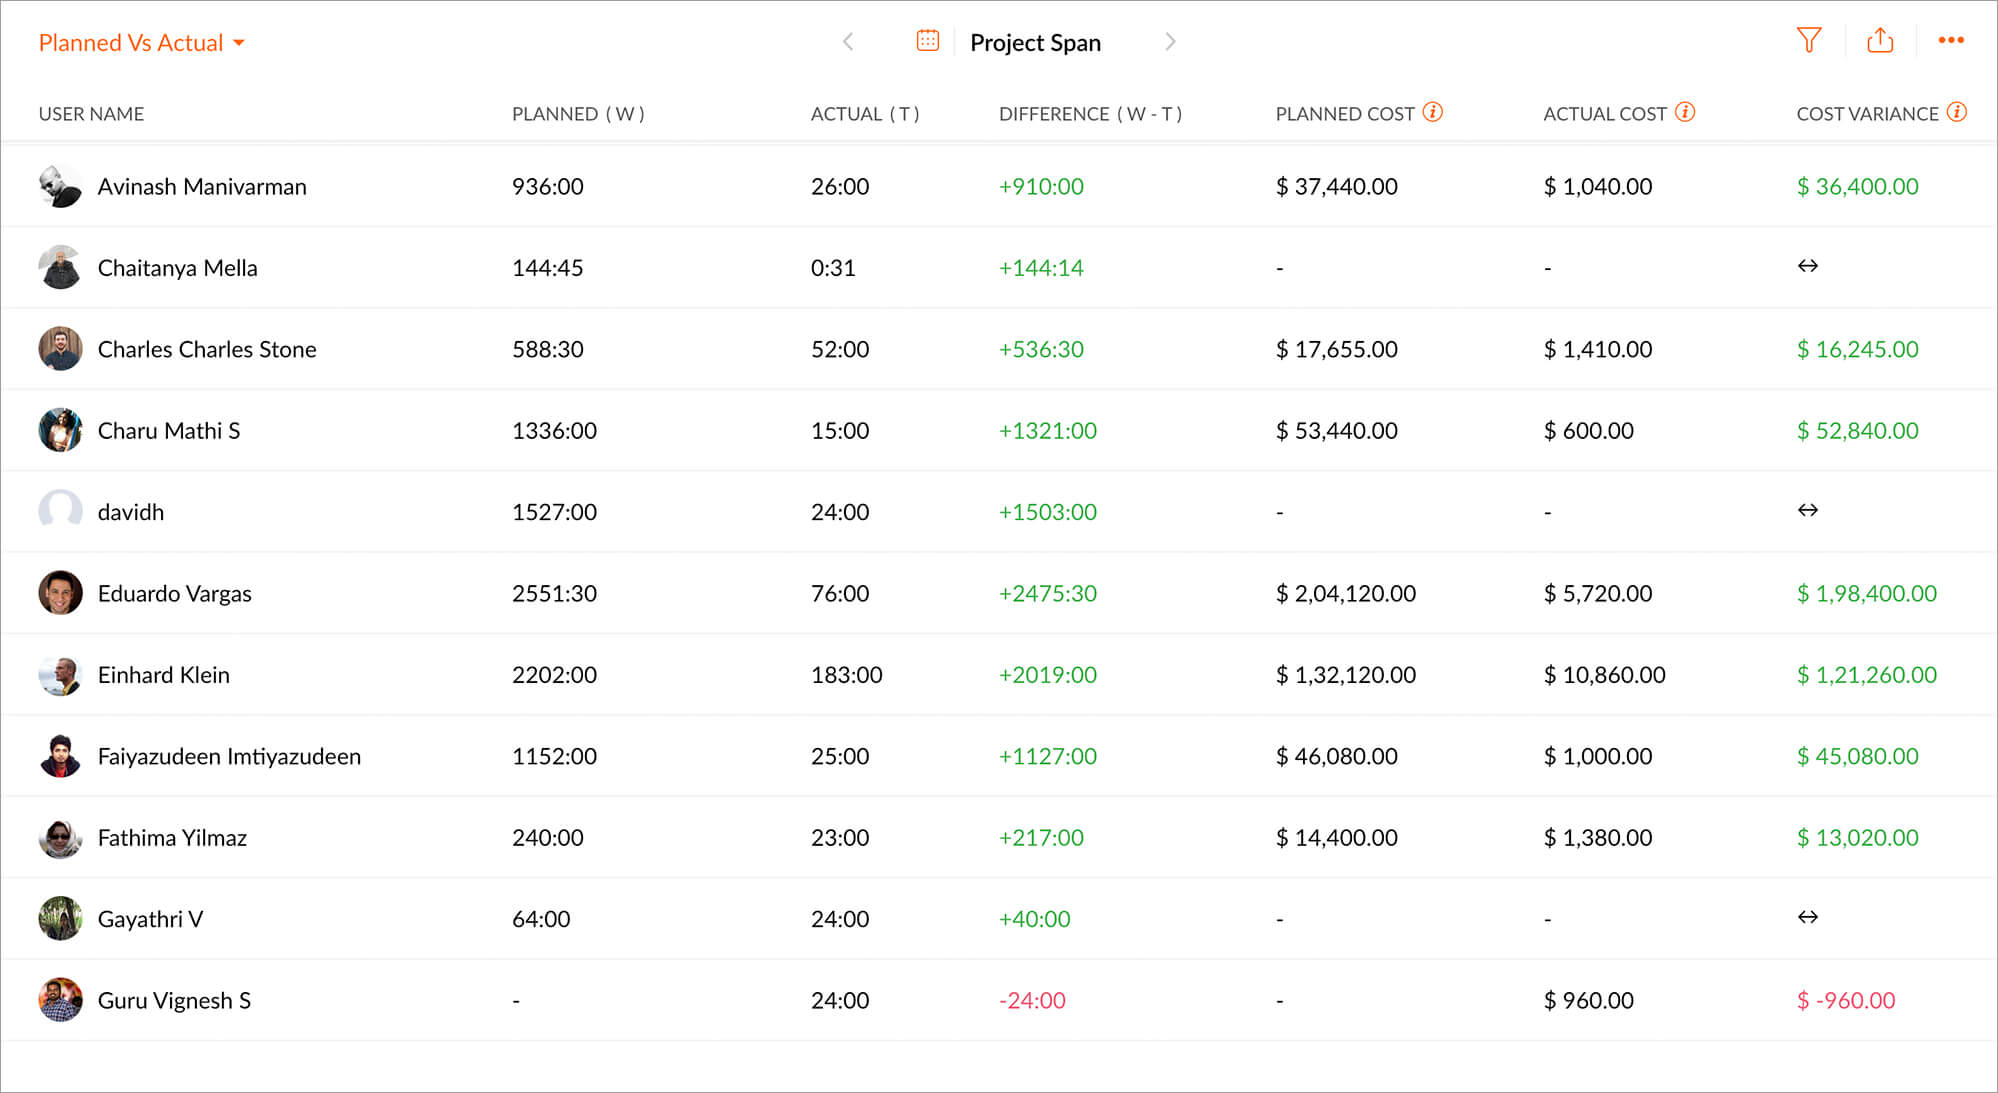
Variance reports
Set a standard for your cost and schedule to compare with your actual performance. In Zoho Projects, this can be done with baselines, planned vs. actual hours for time, and planned vs. actual cost for budget.
Resource availability report
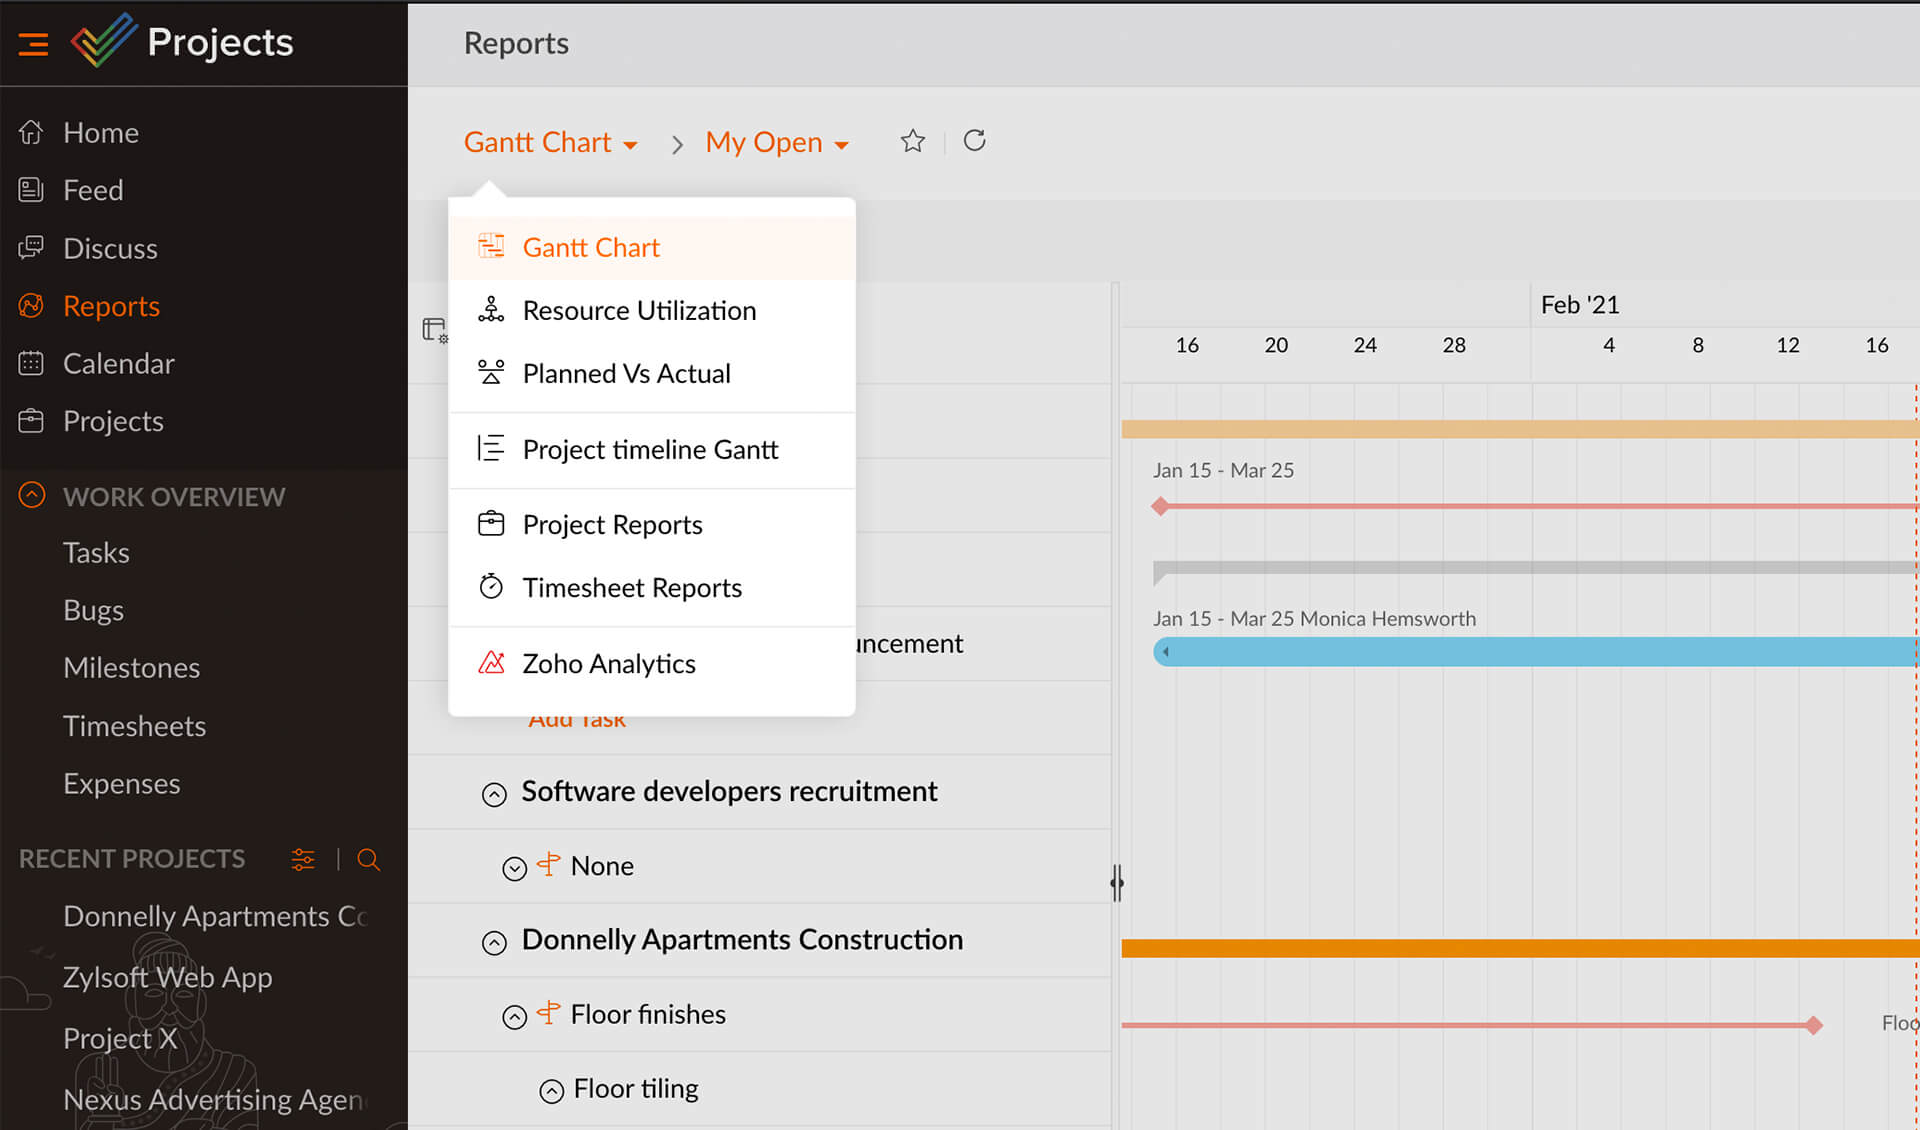
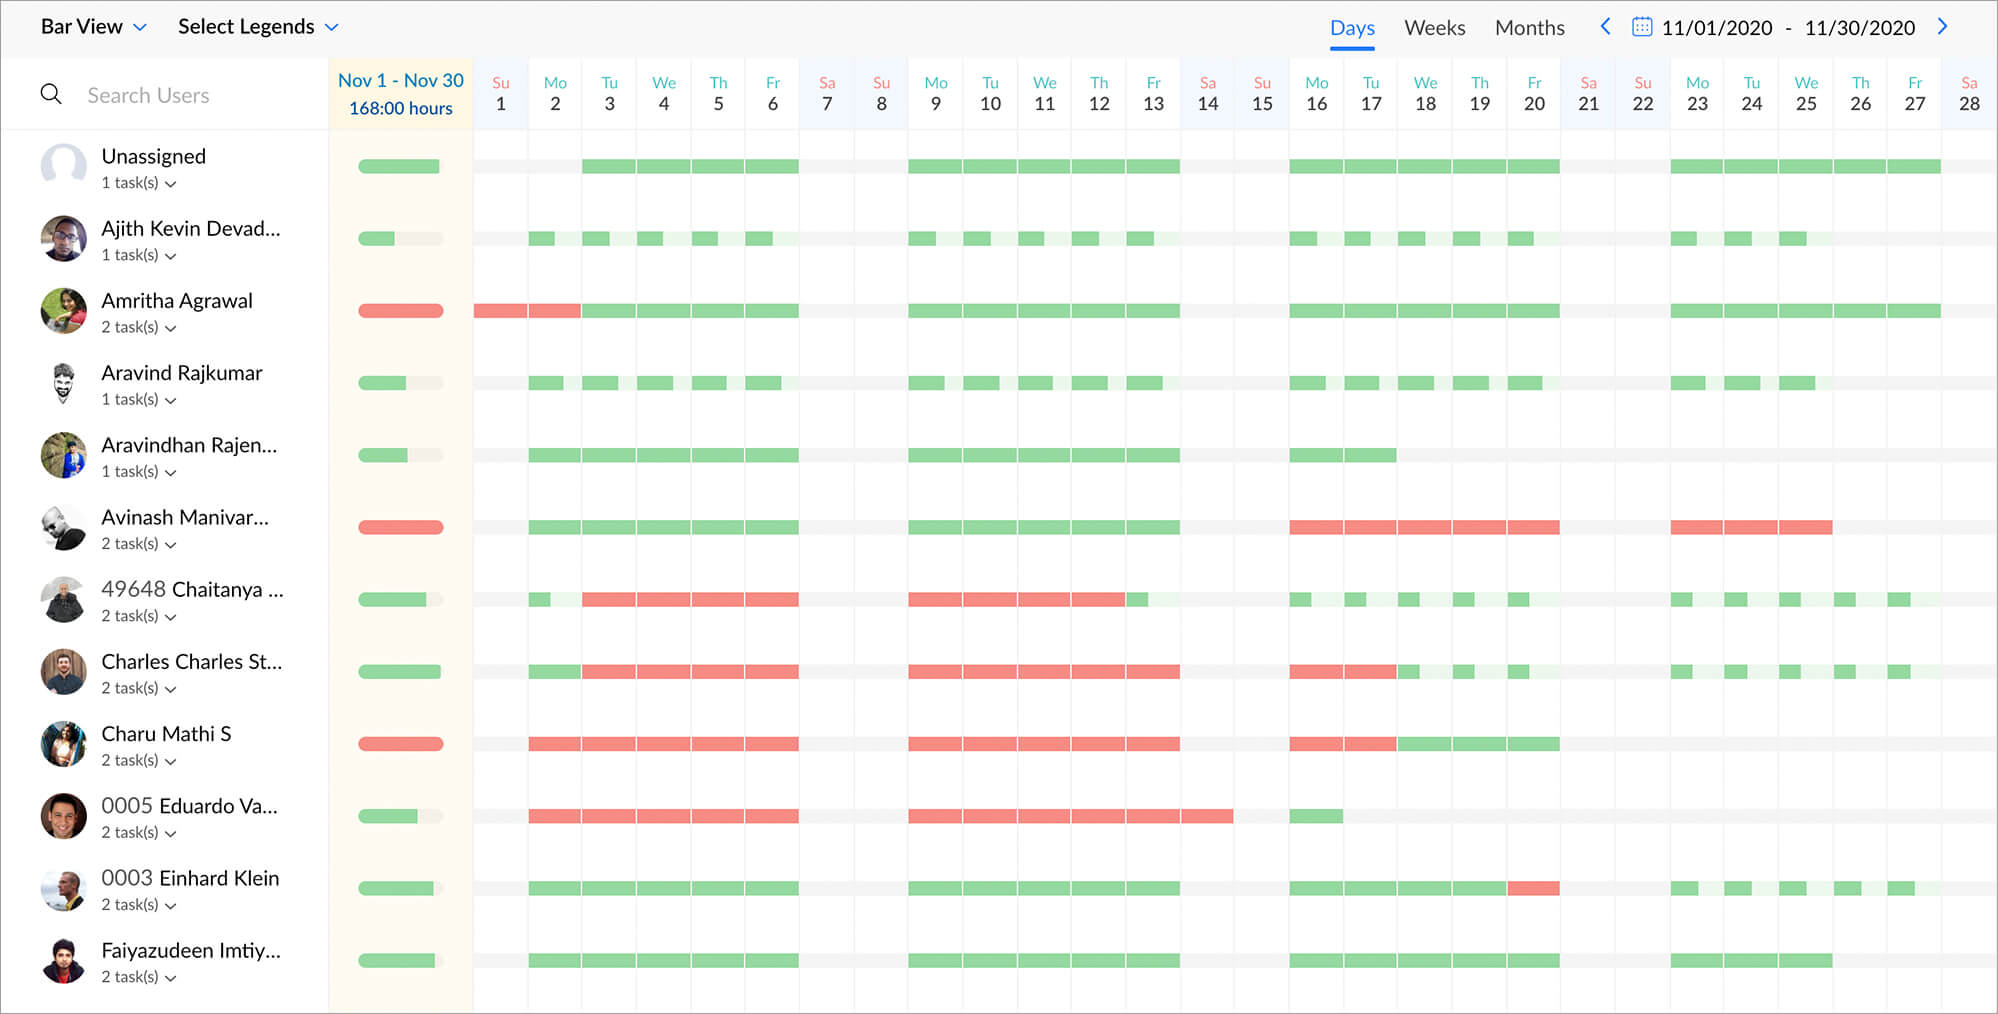
Track your team's workload using our project reporting tool's resource utilization chart. Reallocate work items within your team based on how overworked or underworked an employee is. Resource allocation can also be done by knowing the team's availability during planning.
Time tracking report
Visualize and analyze your time log entries using the timesheet reports and easily calculate the amount to invoice your clients.
Task and issue reports
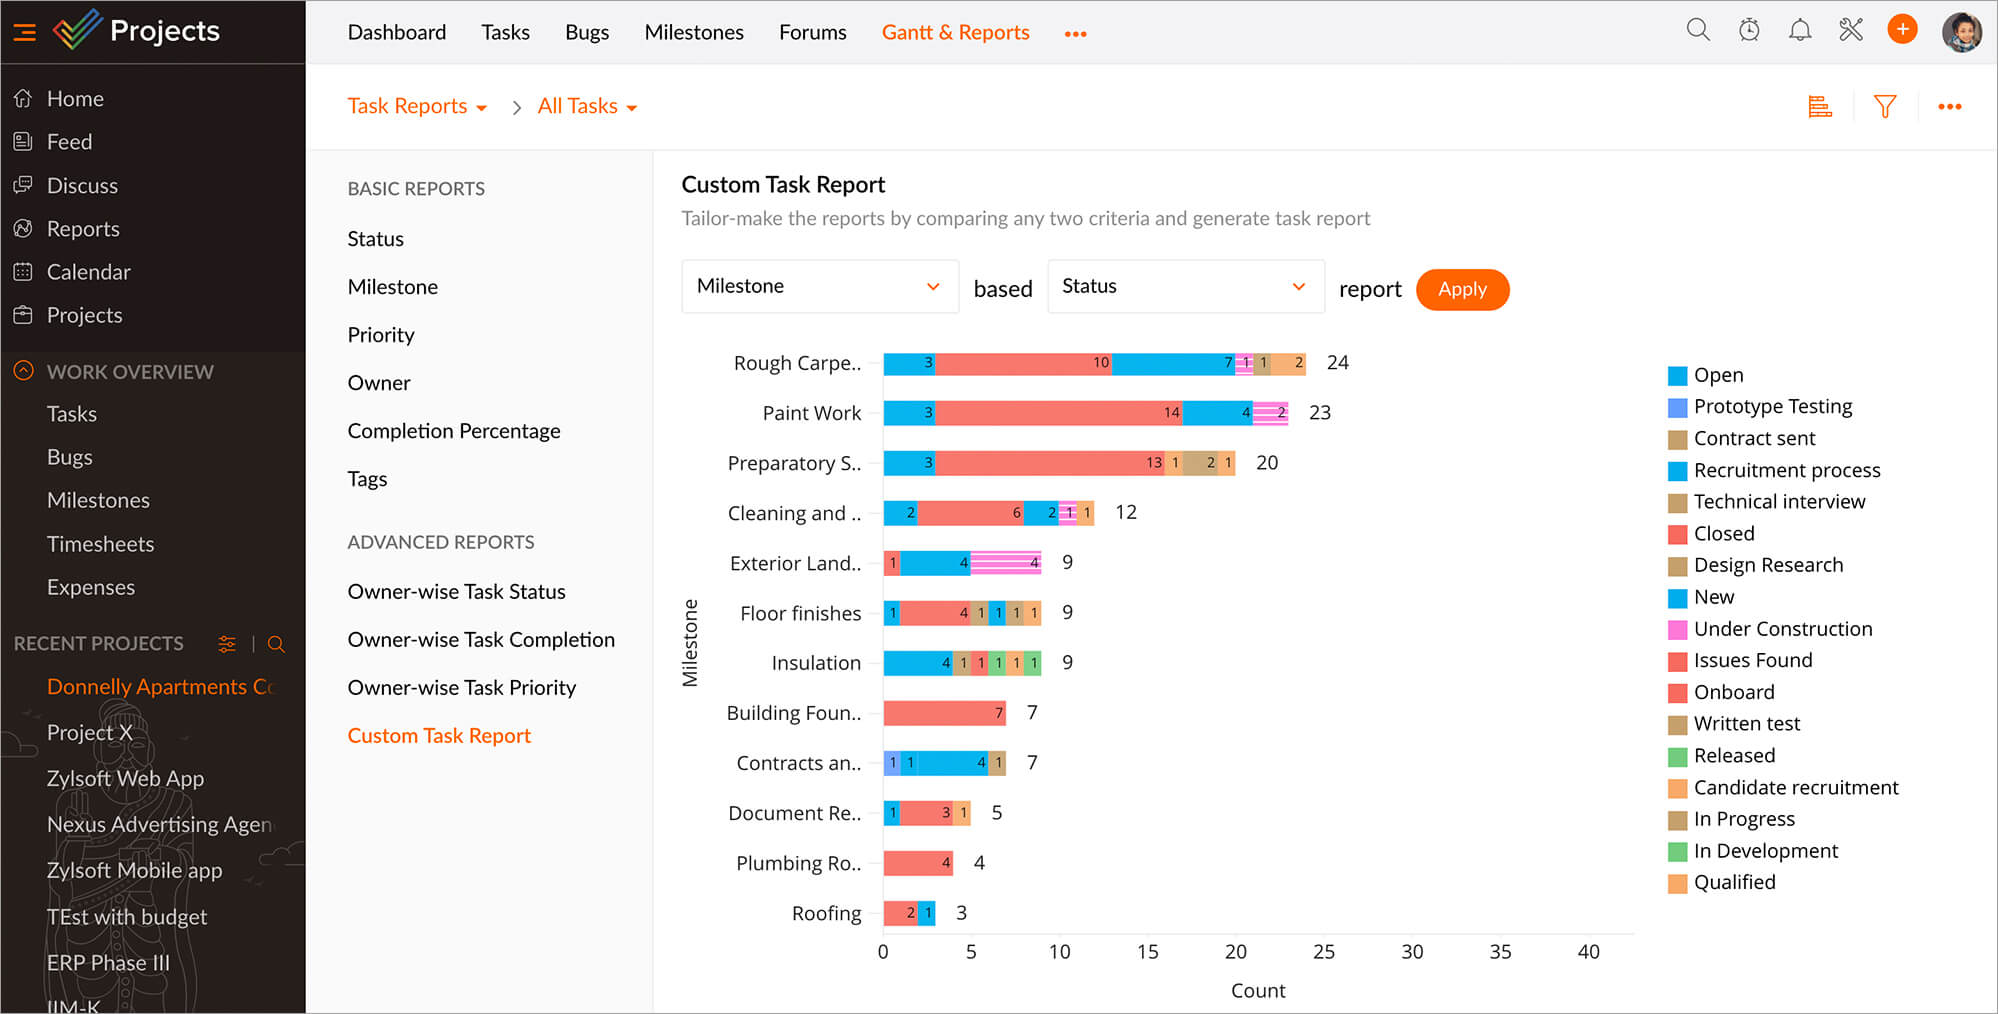
Create basic and advanced reports for your tasks and issues by comparing various aspects of these modules. Custom reports can also be created for both tasks and issues using our online project report maker.
Zoho Analytics integration
With our Zoho Analytics integration, you can create and customize more than 50 reports to give you deep insights into your projects. You can also integrate with Zoho Expense now to create expense reports for your projects.
How to create project management reports
Project reporting is a tried-and-tested technique that assists teams by speaking the universal language of numbers, graphics, and charts, communicating vital information, and catching stakeholders up to speed. Here is how you can create compelling project management reports.
1. Get the purpose straight
Define the purpose of creating this project report. Who is it meant for? Teams? Stakeholders? Management? What is it going to communicate? For eg. A project status report gives you an overview of where your project stands and where it could be potentially headed. A variance report outlines a comparison of the planned and actual by consider. Setting the objectives and building a structure ensures that your report has a strong foundation and does not dissuade from its purpose.
2. Gather relevant information
Next, start compiling data relevant to the report. The data that you gather should be relevant, credible, and up to the minute. Make sure the narrative is well-structured, logical, and sequential so you can bring coherence to your project report.
3. Create an outline
Provide the compiled data with a solid outline. Lay them out in order so teams can navigate the report and can keep up with the progressive information. Ensure that the formatting is consistent — headers, sub-headers, and bullet points maintain conciseness and keep the content crisp. Proof-read the content for better accuracy and revise it for reliability. Here are some of the standard sections that you can incorporate into your report:
- Title: Project name, start and end date, author, organization
- Project participants: Names and clearly-defined roles and responsibilities
- Executive summary: Reports a summary of the key points
- Introduction: States the purpose of the report
- Project scope: How has the project scope changed since its inception
- Customer name and information: Makes project reporting easier
- Methodology: Lists the tools and processes implemented
- Results: Showcases findings and issues if any
4. Write the report
You can now start writing your report. Avoid unnecessary use of jargon or sentence structures that leave members confounded. The success of a good report lies in its ability to communicate effectively — so make proper use of infographics, charts, and tables to assimilate hard-to-understand data into simple information. Review and revise wherever appropriate.
Why is Zoho Projects the best project reporting software?
Zoho Projects is a powerful project reporting software that stands out through its extensive ecosystem, adapting to various business requirements. With its user-friendly interface, easy-to-implement features, and numerous customizations, Zoho Projects is an invaluable asset for half a million SMBs and enterprises worldwide, helping them scale up and achieve enhanced efficiency.
FAQ
What are project reports?
Project reports are comprehensive documents or dashboards that give information about the different aspects of a project from the beginning to the very end. These reports are extremely crucial and serve multiple purposes. For instance, they provide updates to all the involved stakeholders, guide project teams as they make decisions, and more importantly, document the progress for future reference.
Most project management software comes with detailed report modules, as analytics is vital to the whole project management process. For instance, in Zoho Projects, you get multiple types of reports, including planned vs. actual reports, workload reports, and those that visualize what happens on a project at the milestone and task levels.
What is the importance of project reporting software?
One primary advantage of project reporting software is the automation of data collection and consolidation, which drastically reduces time spent on manual data entry. This automation ensures that project reports are consistently based on the most accurate and current data, giving very little room for errors and inconsistencies. Apart from this, standardized templates and reporting tools within the software make it even easier to create professional, consistent reports across different projects.
Another significant advantage is the collaborative capabilities on offer. Team members—even those across the globe working on different timelines—have a centralized platform to look at all the reports in real time, which enhances their teamwork and communication. As an added benefit, an organization can even enforce role-based viewing and editing capabilities for an additional layer of security.
Decision-making becomes a lot easier at the managerial level, as you can visualize relevant and pertinent data through the use of data visualization tools. These tools give you a clear idea of how an organization is performing on various projects in their portfolio.
There are a lot of other benefits as well, like the flexibility to scale the number of projects that an organization can complete, the ability to analyze historical trends, and the means to simplify compliance and accountability.
How can Zoho Projects help me track project progress in real time?
By taking advantage of the plethora of reports we have on offer! Download, share, and disseminate only the latest information to team members, and never lose track.
Can I customize reports based on my team’s KPIs and workflows?
Of course you can! Zoho Projects' reports come with an array of customizations that help you tailor them to your team's requirements.
Does Zoho Projects support workload and resource utilization reports?
Zoho Projects has a Workload Report that lets you keep tabs on your team's individual capacity and helps you facilitate an environment for optimized resource utilization.
How does Zoho Projects help identify project delays or bottlenecks?
You can create and download project, task, and issue reports from Zoho Projects and use that data to gather insights that can help you spot delays and mitigate errors. Zia Insights, Zoho's AI bot, can help you bring such insights to light.
Can I generate reports across multiple projects or portfolios?
Yes, you absolutely can.
Is it easy to visualize data with charts, graphs, or dashboards?
With in-built customizable reports, you can conjure up charts, graphs, dashboards, and so much more!
How secure is my reporting data in Zoho Projects?
With encryption and protection features for reports, rest assured that your data inside Zoho Projects is secure.
Do I need technical skills to create or customize reports?
All you need is Zoho Projects and you're good to go!
Can I export reports to formats like PDF or Excel for sharing?
You can export your reports as PDF for simplified and hassle-free sharing.